


1. Introduction
1.1. Research Background and Motivation
The background of the study is based on the impact of the increase rate of money supply on China's MA and AD. China's monetary policy has become increasingly frequent since the 2008 financial crisis [1]. Therefore, understanding the money supply will be extremely important. There are two important concepts. One is M1, the narrow money supply, which includes money in circulation, demand deposits of enterprises, and so on. The other is M2, the broad money supply, which has added time deposits, foreign currency deposits, trust deposits and so on to the original part of M1. M1 only contains the most liquid currency, while M2 covers more less liquid funds, such as time deposits and corporate deposits, etc. Therefore, M1 is often used to observe the current purchasing power of the public, and M2 is more used as an observation indicator of future inflation expectations. The difference between the growth rate of M1 and M2 is called the money growth scissors difference. When the difference is greater than 0, it indicates that the liquidity of funds is good, and individuals and enterprises are more optimistic about the economy and more inclined to consume and invest, which can enhance the economic vitality. When the difference is less than 0, it indicates that the liquidity of funds is poor, individuals and enterprises are more pessimistic about the economy and tend to save, which is not conducive to economic growth and may cause the stock market to fall. Therefore, when the money growth scissors difference between M1 and M2 is calculated, it can be a good analysis of China's MA and AD.
1.2. Literature Review
Money supply is an important intermediate variable of monetary policy instruments [2]. In the post-financial crisis era, China's economic downturn is the fundamental reason for the formation of the scissors gap of currency increase rate. The decrease in the opportunity cost of residents and enterprises to hold demand deposits and the decrease in the return rate of time deposits are the direct reasons for the formation of the scissors gap of monetary growth [3]. Ren Biyun's analysis of the reverse expansion of the scissors gap of M2 and M1 increase rate in China after the reform and opening up puts forward five suggestions based on the basic characteristics of China's economic operation [4]. The increase rate of money supply M1 continues to rise under the overall low economic condition, so as to obtain the impact brought by the increase rate of M1 [5]. There is a long-term positive correlation between the money growth scissors, and the impact on the macro economy is mainly achieved by changing money liquidity, bank liquidity, market liquidity, entrepreneurs' expectations for the future and the capital market [6]. The M1 and M2 scissors spread index can be used as a leading indicator to forecast the change trend of the inflation rate. By paying close attention to and detecting the change trend of the M1 and M2 scissors spread, the future price trend can be forecast in advance, so as to timely adjust the direction and intensity of monetary policy and improve the countercyclical macro-control behavior of the central bank [7].
1.3. Research Contents
The main research content of this paper is to use time series model to forecast the MA and AD of China. The value of the scissors difference between M1 and M2 can be used as a leading indicator of MA and AD in China. Therefore, the research idea is to predict the value of the scissors difference between M1 and M2 by using the time series model, so as to obtain its change, and then judge the performance of MA and AD.
2. Methodology
2.1. Data Selection and Source
In order to forecast the activity and total demand of the Chinese market, the increase rate of M1 and M2 as well as their growth scissors difference are extremely important data in the research. Monthly data of M1 and M2 from 2008 to 2022 were selected as the training set. The data is selected from the People's Bank of China, which calculates the monthly data of money supply M1 and M2 from 2008 to 2022. The increase rate of M1 and M2 can be calculated through calculation, and the increase rate of their difference can be calculated by subtraction. In any data analysis task, the first step is to map the data. Because charts can visualize many features of data, including patterns, abnormal observations, time changes, and relationships between variables. R Studio is used to draw the increase rate of M1 and M2 as well as their growth scissors difference, and the results are shown in Figures 1-3.
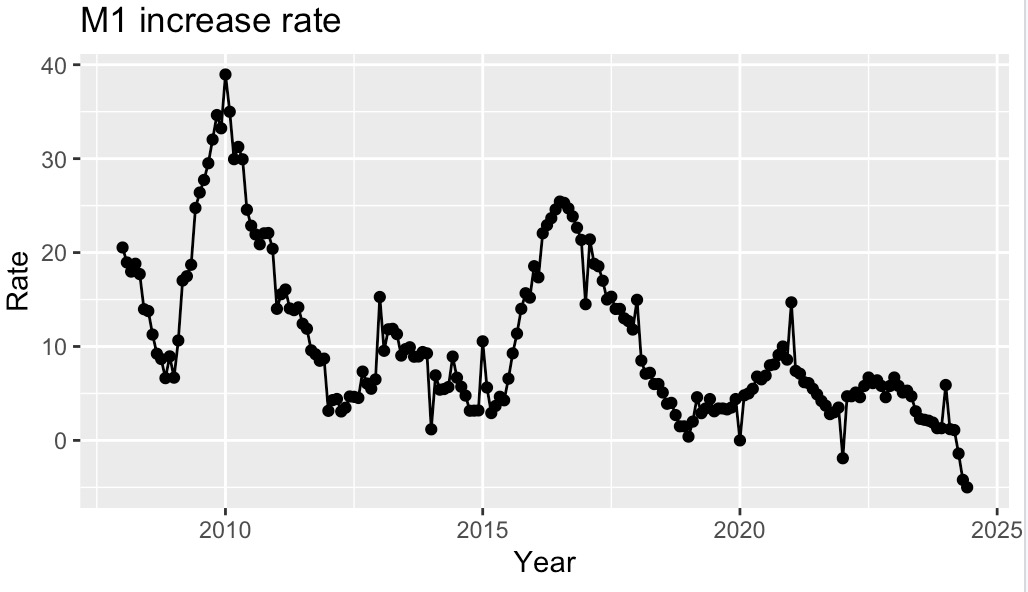
Figure 1: M1 increase rate.
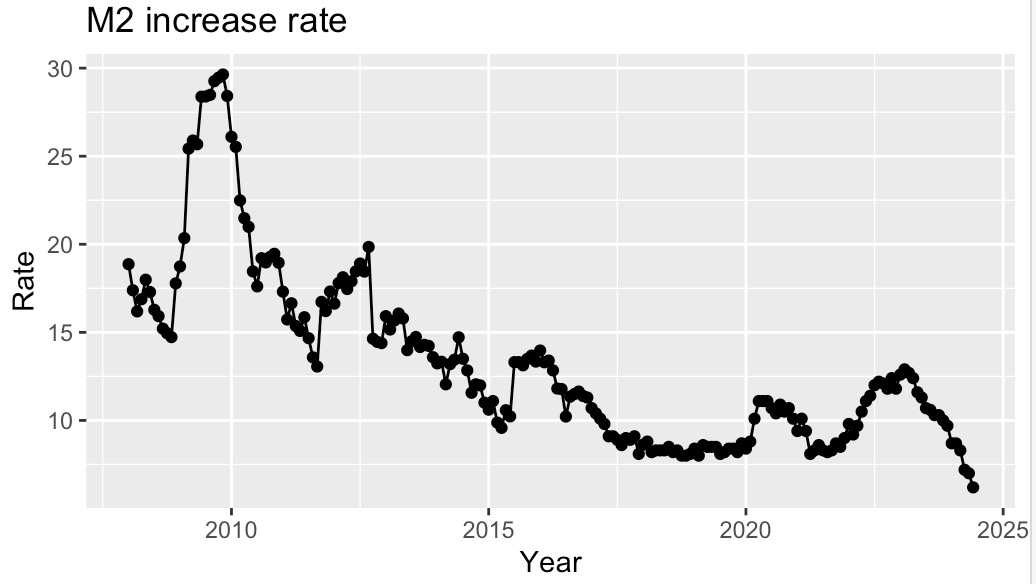
Figure 2: M2 increase rate.
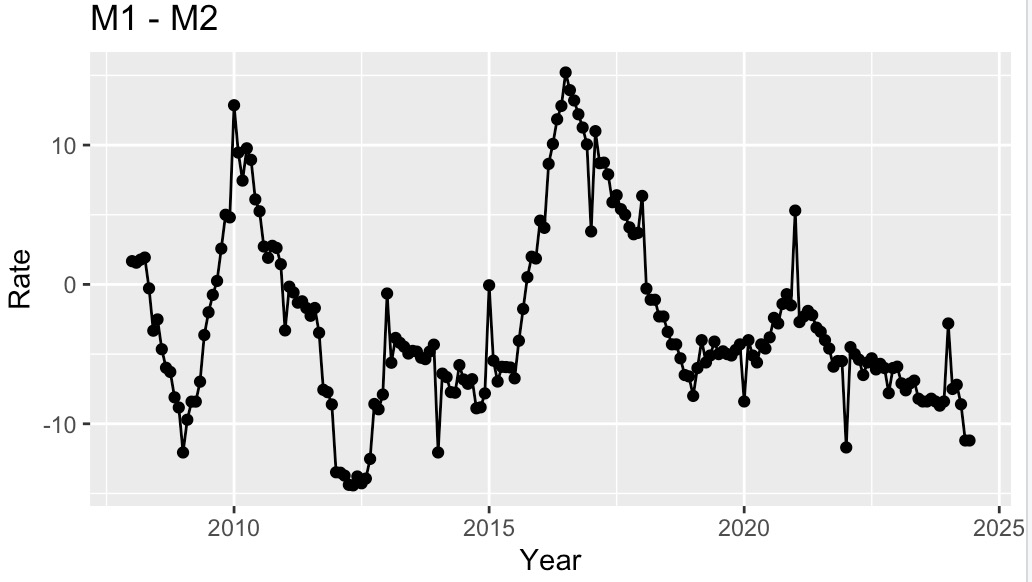
Figure 3: M1-M2 increase rate.
2.2. Stationary Test and White Noise Test
When the graph is finished, it is necessary to incorporate as many data features as possible into the forecast method that needs to be used. It can be seen from the diagram of M1-M2 increase rate that this picture is not stable enough, so what needs to be done is to make a non-stationary time series stationary and calculate the difference between the continuous observation data, which is to make the difference of the data. The result after difference is shown in Figure 4.
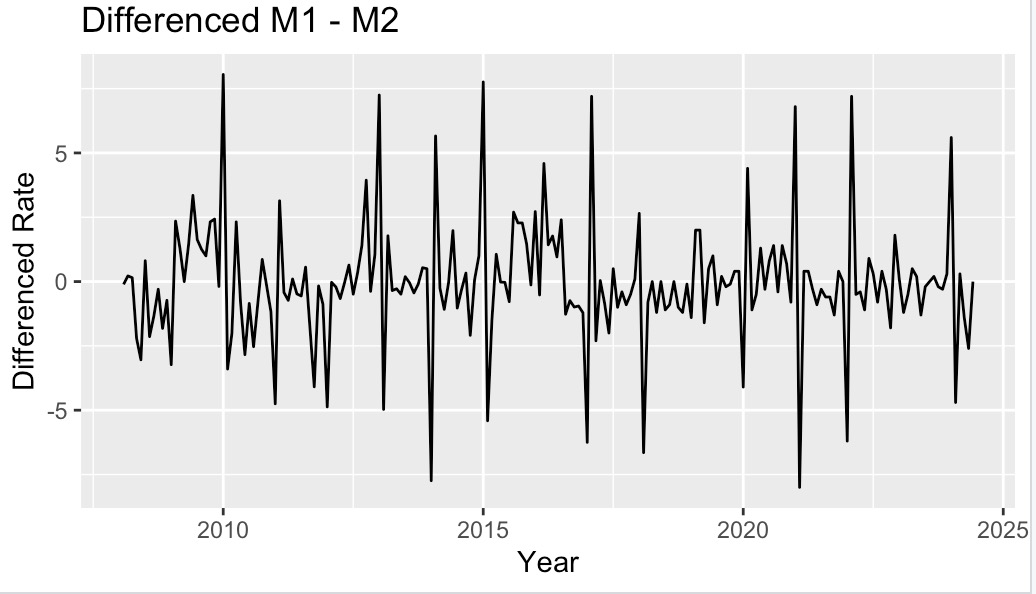
Figure 4: Differenced M1-M2.
After completing the difference, what needs to be done is to check the stationary of the result after the difference. Next, adf.test() is used to test whether the data is stationary, and the result is that the P-value is 0.009, which is much less than 0.05. So now the data is very stationary, although the data in the chart looks very volatile. Another test that needs to be performed is the white noise test. A time series without autocorrelation is called white noise. Therefore, when the time series is white noise, it means that the time series cannot be forecast, so the white noise test is particularly critical. Ljung-Box test is used to test the white noise of the time series, and the result obtained is also that the P-value is much less than 0.05, so it can be seen that M1-M2 after difference is not white noise and can be forecast.
2.3. Exponential Smoothing Model
Exponential smoothing models are used to describe trends and seasonality in data and are one of the most widely used methods in time series. Exponential smoothing was developed in the late 1950s and underpins some of the most successful forecasting methods. The calculation using the applied exponential smoothing method is a weighted average of past observations. In other words, the closer the observation time, the higher its weight. In industrial applications, creating reliable forecasts quickly and using complex time series is a huge advantage. In this study, the exponential smoothing method can well forecast a trend of future MA and AD. The next step is to apply Error Trend Seasonality (ETS) equation to select a suitable model, and then choose Damped Holt's method after comparing with Akaike's Information Criterion (AIC). Most estimates based on Holt's linear method have some development. Empirical evidence suggests that these methods are often too predictable, especially when they are most widely used [8]. To sum up, Damped Holt's method is the most suitable method for forecasting MA and total demand. The final forecast results are shown in Figure 5.
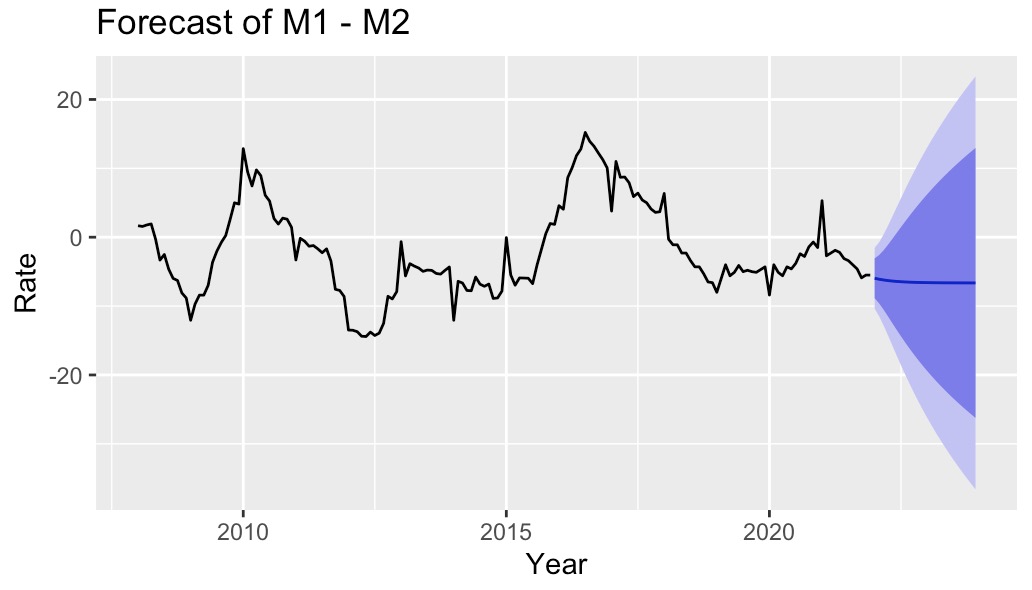
Figure 5: Forecast of M1-M2.
To sum up, it can be seen from the forecast chart that in the next two years, the increase rate of M1-M2 will be less than 0, which indicates that in the following period of time, consumers' willingness to consume will decline, enterprises and consumers will be more inclined to save, and MA and AD will also be reduced to a certain extent.
3. Discussion
M1-M2 growth rate scissors difference is less than 0, indicating that the money supply is lower than the money demand. Comprehensive industry analysis, affected by multiple factors such as deposit "moving" and weak financing demand dragging down deposits, the increase rate of M1M2 slowed down [9]. This may reflect some structural problem in the economy or a misfit in monetary policy. First, economic growth is weak and the demand for money exceeds the actual supply. This situation may be due to slow economic growth and low confidence among businesses and consumers, resulting in insufficient demand for money. Second, the inflexibility of monetary policy. The central bank may not adjust the money supply in time to respond to changes in the economy, resulting in a shortage of money in the market. Third, insufficient money supply can lead to deflation, or a decline in the price level. This phenomenon increases the real debt burden, discourages consumption and investment, and further exacerbates economic weakness. Fourth, insufficient money supply can also lead to instability in financial markets. Due to the lack of liquidity, the market may break the capital chain, thus exacerbating financial risks. For the future development, there are also the following suggestions: First, the central bank should adjust monetary policy flexibly according to economic conditions. Second, the government should introduce proactive fiscal policies, such as increasing infrastructure investment, cutting taxes or issuing consumer vouchers, to stimulate economic growth. Third, in order to deal with the financial risks caused by insufficient money supply, financial supervision should be strengthened to ensure the stability of financial institutions. At the same time, central banks can provide temporary liquidity support to prevent sharp market fluctuations [10].
4. Conclusion
This study presents the forecast of MA and AD in China through a time series model. The results show that China's MA and AD will most likely decline in the next two years. This paper is innovative in data selection. The data given by the People's Bank of China is only the monthly total data of M1 and M2, and further calculations are needed to obtain the data needed for the research. At the same time, this paper also has some shortcomings. On the one hand, the analysis of the relationship between M1 and M2 growth scissors difference and macro-economy is not comprehensive enough. On the other hand, exponential smoothing is poor when dealing with time series data with obvious trends or seasonality, and it is usually only suitable for stable time series data without obvious trends and seasonal fluctuations. When there are long-term trends or periodic fluctuations in the time series, simple exponential smoothing methods may not accurately capture these patterns, thus affecting the accuracy of the forecast results. In addition, future policy changes are highly likely to affect the trend of data, so the uncontrollability of policy changes will lead to inaccurate forecast results. There are the following ways to improve the above shortcomings: Firstly, learn more macro-economy-related content and have a deeper understanding of the relationship between M1 and M2 growth scissors difference and macro-economy. Secondly, in terms of forecast, learning and trying to use more methods may find a method that is more suitable for this study.
References
[1]. Liu Chang. (2011). Prediction and Analysis of narrow money supply M1 in China: Based on ARIMA model and regression model. China Securities and Futures, (12):162-163.
[2]. Hu Junhua. (2010). China's M2 regression model and forecast. Journal of monetary market in China, (7): 5.
[3]. Li Zenglai, Fang Wei. (2019). The scissors difference between financial innovation, economic growth and monetary growth. Regional Finance Research, (02):25-31.
[4]. Ren Biyun. (2010). Analysis of Inverse Widening of the Scissors Difference of M2 and M1 growth rate in China after reform and opening up. Finance and Trade Economics, (01): 23-28+120.
[5]. He Hui, Liu Hongyue, Liu Xibo. (2012). Analysis and prediction of China's money supply M1 based on ARIMA model Seminar on Statistical Education and Applied Statistics Chinese Society of Applied Statistics.
[6]. Shi Xinyi. (2014). The Relationship between the scissors difference of monetary Growth rate and Macro-economy. Dongbei University of Finance and Economics.
[7]. Liu Yacong. (2014). Empirical and applied analysis of the correlation between M1, M2 scissors difference and inflation in China. Qingdao University of Science and Technology.
[8]. Hyndman, R.J., & Athanasopoulos, G. (2021) Forecasting: principles and practice, 3rd edition, OTexts: Melbourne, Australia. OTexts.com/fpp3.
[9]. Qi Ning. (2024). M2 and M1 growth rate scissors are still at a high level in the third quarter there is room for interest rate cuts. China Business News, A07.
[10]. Liu Zhixiong, Liu Yanrong. (2023). Will the adjustment of money supply affect stock price changes in China? Evidence from 2000-2021 quarterly data. Gansu Finance, (08):44-53.
Cite this article
Pang,B. (2024). Forecasting Market Activity and Aggregate Demand in China Using Time Series Models. Advances in Economics, Management and Political Sciences,123,157-163.
Data availability
The datasets used and/or analyzed during the current study will be available from the authors upon reasonable request.
Disclaimer/Publisher's Note
The statements, opinions and data contained in all publications are solely those of the individual author(s) and contributor(s) and not of EWA Publishing and/or the editor(s). EWA Publishing and/or the editor(s) disclaim responsibility for any injury to people or property resulting from any ideas, methods, instructions or products referred to in the content.
About volume
Volume title: Proceedings of ICEMGD 2024 Workshop: Policies to Enhance Sustainable Development through the Green Economy
© 2024 by the author(s). Licensee EWA Publishing, Oxford, UK. This article is an open access article distributed under the terms and
conditions of the Creative Commons Attribution (CC BY) license. Authors who
publish this series agree to the following terms:
1. Authors retain copyright and grant the series right of first publication with the work simultaneously licensed under a Creative Commons
Attribution License that allows others to share the work with an acknowledgment of the work's authorship and initial publication in this
series.
2. Authors are able to enter into separate, additional contractual arrangements for the non-exclusive distribution of the series's published
version of the work (e.g., post it to an institutional repository or publish it in a book), with an acknowledgment of its initial
publication in this series.
3. Authors are permitted and encouraged to post their work online (e.g., in institutional repositories or on their website) prior to and
during the submission process, as it can lead to productive exchanges, as well as earlier and greater citation of published work (See
Open access policy for details).
References
[1]. Liu Chang. (2011). Prediction and Analysis of narrow money supply M1 in China: Based on ARIMA model and regression model. China Securities and Futures, (12):162-163.
[2]. Hu Junhua. (2010). China's M2 regression model and forecast. Journal of monetary market in China, (7): 5.
[3]. Li Zenglai, Fang Wei. (2019). The scissors difference between financial innovation, economic growth and monetary growth. Regional Finance Research, (02):25-31.
[4]. Ren Biyun. (2010). Analysis of Inverse Widening of the Scissors Difference of M2 and M1 growth rate in China after reform and opening up. Finance and Trade Economics, (01): 23-28+120.
[5]. He Hui, Liu Hongyue, Liu Xibo. (2012). Analysis and prediction of China's money supply M1 based on ARIMA model Seminar on Statistical Education and Applied Statistics Chinese Society of Applied Statistics.
[6]. Shi Xinyi. (2014). The Relationship between the scissors difference of monetary Growth rate and Macro-economy. Dongbei University of Finance and Economics.
[7]. Liu Yacong. (2014). Empirical and applied analysis of the correlation between M1, M2 scissors difference and inflation in China. Qingdao University of Science and Technology.
[8]. Hyndman, R.J., & Athanasopoulos, G. (2021) Forecasting: principles and practice, 3rd edition, OTexts: Melbourne, Australia. OTexts.com/fpp3.
[9]. Qi Ning. (2024). M2 and M1 growth rate scissors are still at a high level in the third quarter there is room for interest rate cuts. China Business News, A07.
[10]. Liu Zhixiong, Liu Yanrong. (2023). Will the adjustment of money supply affect stock price changes in China? Evidence from 2000-2021 quarterly data. Gansu Finance, (08):44-53.