


1. Introduction
Since the reform and opening-up, China’s rapid economic growth has come at the cost of environmental degradation, with resource depletion, ecosystem damage, and severe pollution constraining sustainable development. To address these challenges, a shift toward a green transformation is essential to foster a more balanced and sustainable economy. Green innovation plays a vital role in this transformation, as its dynamic interaction with economic growth directly impacts macroeconomic policy formulation and supports the long-term development goals of the country.
2. Literature Review
2.1. Current research status of green innovation
The existing literature primarily explores the influencing factors of green innovation. Firstly, government plays a significant role. Some researchers found that the environmental protection target responsibility system promotes the increase in green patent applications but has a negative impact on the quality of green innovation, with a delayed effect: it has no immediate impact on patent quantity or quality but, in the long term, increases patent numbers while reducing quality[1]. Chen indicated that after the new environmental protection law, stronger local environmental regulations encourage manufacturing enterprises to engage in green innovation, with financial subsidies and development levels acting as moderating variables to enhance this effect[2]. Other researchers, using a green innovation game model, showed that government regulatory costs and regulation proportion negatively impact green innovation diffusion, while regulation of foreign-funded enterprises and adjustments in intellectual property fees further influence diffusion[3]. Secondly, firm characteristics also impact green innovation. Amore and others argued that corporate governance levels affect green innovation efficiency, with lower governance firms producing less green innovation[4]. Another researcher suggested that stronger profitability enhances a firm’s capital capacity, increasing the likelihood of green innovation[5].
2.2. The impact of green innovation on economic growth
Most scholars agree on a correlation between green technology innovation and industrial economic growth. Wang argues that while green technology innovation promotes sustainable economic growth, rising emissions and environmental governance costs hinder its development and industrial sustainability[6]. Some researchers examined green innovation in terms of energy, environment, and innovation, finding a long-term cointegration with economic growth: external shocks to green innovation components cause varying impacts on growth[7]. Total energy consumption and industrial emissions negatively correlate with growth, while patent grants show a positive correlation; industrial emissions exert the strongest influence on growth fluctuations, followed by patent grants and energy use, with both energy consumption and emissions showing a delayed negative impact.
2.3. The impact of economic growth on green innovation
Most scholars acknowledge a relationship between economic growth and green innovation, though the direction remains debated. Some argue for a positive impact: Researchers identified a long-term cointegration between economic growth and green invention and utility model patents, finding a “diffusion effect” where economic growth stimulates both patent types, enhancing green innovation. Daniel B. and some researchers similarly support economic growth’s positive role in promoting green innovation. However, others question this effect’s universality[8]; Banelien found that R&D investment’s impact on growth varies by economic development level[9], while Horváthová suggest that green innovation’s benefits on firm performance rely on specific conditions[10], indicating that economic growth’s positive effect on green innovation may not extend to less developed regions.
2.4. Research Hypotheses
Many researchers found a positive relationship between green technology innovation and economic growth and a negative relationship with carbon emissions. Innovations that reduce energy or material use per output unit enhance firm competitiveness, boosting economic growth[7]. Maiulyt-niukien and Sekhniashvili also observed positive effects of eco-innovation on growth and environmental performance[11]. Moreover, while manufacturing firms see gains in economic and environmental performance, service firms benefit socially, suggesting a potential GDP boost as the service sector grows[12]. Thus, we propose:
H1A: Green innovation positively affects economic growth.
However, due to the early stage and high costs of green technologies like solar, wind, and electric vehicles, the economic return can be minimal or even negative[9]. Studies in Europe and China, report negative impacts of innovation on growth, indicating that green innovation could also hamper growth[13][14]. Hence, we propose:
H1B: Green innovation negatively affects economic growth.
Economic growth may foster green innovation. Some found that profitability promotes green product innovation[10], while others confirm a positive link between GDP growth and green innovation[8]. Additionally, Banelien and Strazdas show that higher GDP per capita can drive green innovation[9]. Thus, we propose:
H2A: Economic Growth positively affects green innovation.
Nonetheless, Banelien notes that R&D impact varies with development levels[9], and green innovation’s positive effects often depend on favorable conditions[10]. Given China’s varied development, green innovation may face regional constraints. Therefore, we propose:
H2B: Economic Growth negatively affects green innovation.
3. Empirical Model and Data
This study employs a Panel Vector Autoregression (VAR) model with data from 31 provincial-level units in mainland China, spanning 1992–2021, to analyze the dynamic relationship between economic growth and green innovation. The panel VAR model integrates time series and panel data advantages, capturing multi-level dynamics in economic growth and green innovation.
3.1. Empirical model
The panel VAR model is specified as:
\( {Y_{i.t}}=\sum _{j=1}^{p}{A_{j}}{Y_{i,t-j}}+{f_{i}}+{d_{c,t}}+{ε_{i,t}} \) (1)
Where \( {Y_{i.t}} \) is a vector containing proxies for economic growth and green innovation, \( {A_{j}} \) is the coefficient vector, \( {f_{i}} \) denotes individual fixed effects, \( {d_{c,t}} \) represents time effects, and \( {ε_{i,t}} \) denotes idiosyncratic errors, with E(εi,t) = 0, E(ε’i,t εi,t ) = Σ, and E(ε’i,t εi,j ) = 0 for t > j.
To ensure unbiased coefficients, forward mean-differencing is applied to eliminate fixed effects while preserving orthogonality between transformed variables and lagged regressors. We also use within-group mean-differencing to remove time effects. The coefficients are then estimated via the Generalized Method of Moments (GMM).
3.2. Data
3.2.1. Data source
This study utilizes annual panel data from 31 provincial units in China from 1992 to 2021. Economic growth (lnGDP) is represented by the log of GDP from the CSMAR Database, while green innovation proxies (lnpa, lnmpa) are sourced from the CNRDS Database.
3.2.2. Variable definitions and descriptive statistics
Using the number of green invention and utility model patents as indicators for green innovation, with GDP as the measure of economic growth. For clarity, variable definitions and data sources are outlined in Table 1, and descriptive statistics are summarized in Table 2.
Table 1: Variable definitions
Variables | Definition | Source |
lnGDP | GDP in log form | CSMAR Database |
lnpa | Number of green invention patents in log form | CNRDS Database |
lnmpa | Number of green utility model patents in log form |
Table 2: Descriptive statistics
Variables | Mean | SD | Min | Max | Median | N |
gdp | 28161 | 28835 | 1018 | 180000 | 17455 | 930 |
pa | 287.1 | 764.1 | 0 | 7943 | 22 | 930 |
mpa | 1194 | 3209 | 0 | 39030 | 115 | 930 |
lnGDP | 9.690 | 1.140 | 6.930 | 12.12 | 9.770 | 930 |
lnpa | 3.360 | 2.350 | 0 | 8.980 | 3.140 | 930 |
lnmpa | 5.010 | 2.230 | 0 | 10.57 | 4.750 | 930 |
4. Empirical results
To validate our model, we first conduct cross-sectional dependence and panel unit root tests in Subsection 4.1, followed by optimal lag order selection and GMM-based panel VAR estimations in Subsection 4.2. Subsections 4.3 and 4.4 present the impulse-response analysis and Granger causality test results. We further analyze variance decomposition to assess green innovation’s economic impact in Subsection 4.5, concluding with a stability check of the third-order PVAR model in Subsection 4.6.
4.1. Cross-sectional dependence and panel data stationarity test
We first test for cross-sectional dependence, rejecting the null of independence at the 1% level for all series (Table 3). Next, we confirm stationarity using the CIPS panel unit root test, which accommodates cross-sectional dependence[15]. The results (Table 4) show all variables are stationary at the 1% significance level, confirming model suitability.
Table 3: Cross-sectional dependence test
Variables | Breusch-Pagan LM | Pesaran scaled LM | Bias-corrected scaled LM | Pesaran CD | Free’s test |
LnGDP | 3600.39*** | 65.747*** | 212.86*** | 66.270*** | 0.592*** |
Lnpa | 400.11*** | 26.722*** | 233.04*** | 25.933*** | 0.362*** |
Lnmpa | 1276.53*** | 62.285*** | 114.37*** | 65.857*** | 0.558*** |
Notes: Standard errors in parentheses; *** p<0.01, ** p<0.05, * p<0.1
Table 4: CIPS panel unit root tests
Variables | Level | First difference | ||
Intercept | Intercept & trend | Intercept | Intercept & trend | |
LnGDP | -2.464*** | -2.747*** | -3.782*** | -4.078*** |
Lnpa | -4.051*** | -4.175*** | -6.042*** | -6.251*** |
Lnmpa | -3.277*** | -3.300*** | -5.769*** | -5.937*** |
Notes: The maximum lag is set as 4 and the BG lag is set as 8.
Standard errors in parentheses; *** p<0.01, ** p<0.05, * p<0.1.
4.2. Determination of the optimal lag for the three models and Results of panel VAR model
To estimate the VAR model, we first determined the optimal lag (𝑝) by applying AIC, BIC, and HQIC criteria (Table 5). Based on these, we selected a lag of 𝑝=3 as the best fit.
Table 5: Determination of the optimal lag
lag | AIC | BIC | HQIC |
1 | 0.165759 | 0.725841 | 0.380085 |
2 | -1.34628 | -0.71902* | -1.10583 |
3 | -1.39362* | -0.69504 | -1.12535* |
4 | -1.25146 | -0.47699 | -0.9535 |
5 | -0.61446 | 0.240999 | -0.28471 |
6 | 3.02018 | 3.96228 | 3.38405 |
Using Stata 17, we estimated the model via system GMM. The findings are summarized in Table 6.
Table 6: Results of panel VAR model
Variables | (1) h_lnGDP | (2) h_lnpa | (3) h_lnmpa |
L.h_lnGDP | 1.656*** | 2.642*** | 1.089*** |
(0.0574) | (0.532) | (0.365) | |
L.h_lnpa | 0.00163 | 0.436*** | 0.0358 |
(0.00491) | (0.0562) | (0.0358) | |
L.h_lnmpa | -0.0181** | -0.116 | 0.203*** |
(0.00785) | (0.0833) | (0.0583) | |
L2.h_lnGDP | -0.612*** | -3.651*** | -0.0881 |
(0.0825) | (0.692) | (0.486) | |
L2.h_lnpa | 0.00888* | 0.187*** | -0.0110 |
(0.00460) | (0.0484) | (0.0353) | |
L2.h_lnmpa | -0.0472*** | -0.114* | 0.0310 |
(0.00609) | (0.0623) | (0.0463) | |
L3.h_lnGDP | 0.0443 | 2.020*** | 0.0985 |
(0.0406) | (0.352) | (0.261) | |
L3.h_lnpa | -0.0174*** | 0.0711* | -0.0460 |
(0.00392) | (0.0423) | (0.0310) | |
L3.h_lnmpa | 0.0138** | -0.0536 | 0.179*** |
(0.00597) | (0.0714) | (0.0434) | |
Observations | 806 | 806 | 806 |
Standard errors in parentheses
*** p<0.01, ** p<0.05, * p<0.1
In Model (1), GDP exhibits a significant self-enhancing effect at lag 1, which diminishes over time, possibly due to macro constraints. Lnpa has a slight positive effect on GDP at lags 1 and 2, with a significant negative impact at lag 3, suggesting a delayed effect possibly influenced by external factors. Lnmpa shows short-term negative effects on GDP, which lessen over time. Then, in Model (2), Lnpa shows positive self-influence across lags 1, 2, and 3, suggesting a short-term feedback mechanism. GDP initially has a positive effect on lnpa at lag 1, turning negative at lag 2, indicating a shift in short-term impact. Lnmpa’s influence on lnpa is significant and negative at lag 2, showing a delayed negative effect. And in Model 3, GDP positively affects lnmpa at lag 1. Lnmpa shows positive self-dependence at both lags 1 and 3, suggesting that recent achievements may drive short-term growth, with effects diminishing over time.
4.3. Impulse response functions
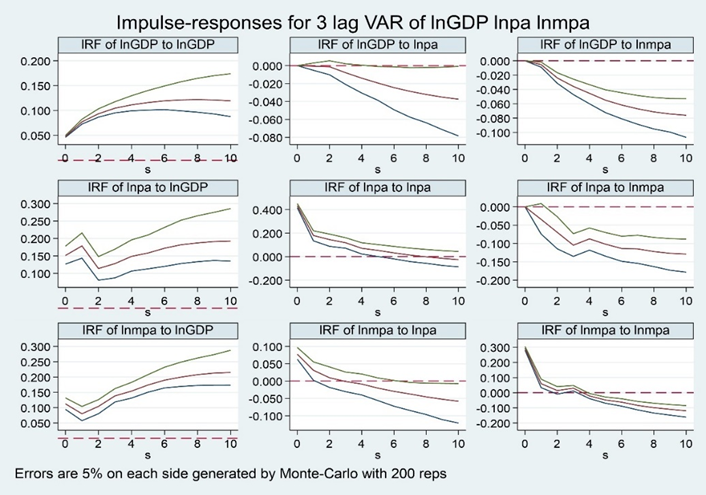
Figure 1: Impulse response functions.
To analyze dynamic interactions between green innovation and economic growth, we employ impulse response functions, capturing the effects of one standard deviation shock across time. Figure 1 displays impulse responses over ten periods, generated by 200 Monte Carlo simulations. The horizontal axis shows the time periods, while the vertical axis represents response magnitudes, with 95% confidence intervals. Key findings are as follows:
[1, 1] represents the impulse response of lnGDP to itself. GDP’s self-response is positive, peaking in period 8 and then tapering while remaining positive.
[1, 2] represents the impulse response of lnGDP to lnpa. A shock to green invention patents results in a delayed negative impact on GDP after three periods, reflecting a slight short-term negative effect on growth likely due to increased environmental regulation and the developmental stage of green innovation.
[1, 3] represents the impulse response of lnGDP to lnmpa. A shock to green utility model patents shows an immediate slight negative impact on GDP, which stabilizes, indicating a more significant short-term negative effect than green invention patents.
[2, 1] represents the impulse response of lnpa to lnGDP. GDP shocks positively impact green invention patents initially, with fluctuations that stabilize into sustained growth support over time.
[2, 2] represents the impulse response of lnpa to itself. Green invention patents show an immediate positive self-response that diminishes, turning negative by period 8, underscoring the need for careful planning to maximize benefits.
[2, 3] represents the impulse response of lnpa to lnmpa. A shock to green utility patents initially has a negative effect on green invention patents, stabilizing after period 3.
[3, 1] represents the impulse response of lnmpa to lnGDP. GDP shocks produce a steadily increasing positive effect on green utility model patents, indicating economic growth significantly supports green utility patent authorization.
Therefore, regions should adjust their green innovation policies and development plans according to their own development levels.
[3, 2] represents the impulse response of lnpa to lnmpa. A shock to green utility patents generates an immediate positive response that turns negative by period 3, reflecting possible adaptation and substitution effects.
[3, 3] represents the impulse response of lnmpa to itself. Green utility patents show an initial positive self-response, weakening with time and turning negative by period 3, indicating that initial gains may be offset by costs, policy changes, and technological updates.
4.4. Granger causality tests
Table 7: Granger causality test
Equation | Excluded | chi2 | df | Prob > chi2 |
h_lnGDP | h_lnpa | 20.446 | 3 | 0.000*** |
h_lnGDP | h_lnmpa | 93.168 | 3 | 0.000*** |
h_lnGDP | ALL | 161.53 | 6 | 0.000*** |
h_lnpa | h_lnGDP | 58.653 | 3 | 0.000*** |
h_lnpa | h_lnmpa | 24.292 | 3 | 0.000*** |
h_lnpa | ALL | 98.886 | 6 | 0.000*** |
h_lnmpa | h_lnGDP | 115.34 | 3 | 0.000*** |
h_lnmpa | h_lnpa | 3.5242 | 3 | 0.318 |
h_lnmpa | ALL | 252.4 | 6 | 0.000*** |
Notes: Standard errors in parentheses
*** p<0.01, ** p<0.05, * p<0.1
The Granger causality test, as shown in the Table 7, assesses whether changes in the information of one variable in the previous period can cause changes in the information of another variable in the previous period. As indicated in the Table 7, the p-values in the first and second rows are less than 0.01, rejecting the null hypothesis at a 1% significance level. This implies that lnpa and lnmpa are Granger causes of lnGDP. Similarly, the p-values in the fourth and seventh rows are also less than 0.01, rejecting the null hypothesis at a 1% significance level, indicating that lnGDP is a Granger cause of lnpa and lnmpa. In other words, green innovation patents and economic growth are Granger causes of each other, and green utility model patents and economic growth are also Granger causes of each other.
4.5. Variance decomposition analysis
The impulse response functions can illustrate the dynamic effects between variables, while variance decomposition involves allocating the variance of variables to their respective disturbance terms. To analyze the relationship more accurately between green innovation and economic growth, this subsection uses variance decomposition to determine the contribution of each variable to another variable in response to each shock. The results are as follows: Firstly, the Figure 2 below is the variance decomposition chart for lnGDP. In the fluctuations of lnGDP, the initial self-explanation for lnGDP is 100%, but as the number of periods in- creases, its proportion decreases. At thirtieth period, it accounts for 65.8%. The contributions of lnpa and lnmpa to lnGDP grow from an initial 0 to 7.9% and 26.3% at thirtieth period, respectively. The contribution of lnGDP to itself consistently outweighs the other two variables. This indicates that economic growth is influenced by the other two variables related to green innovation, but its fluctuations are primarily driven by itself, suggesting the presence of a self-enhancing mechanism in economic growth.
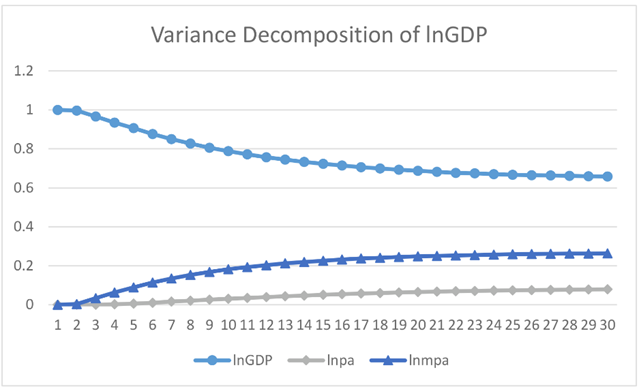
Figure 2: Variance decomposition of lnGDP
The variance decomposition chart for lnpa (Figure 3) shows that at first period, lnpa’s self-explanation accounted for 89.1%, while lnGDP’s proportion accounts for 10.9%. Subsequently, lnpa’s self-explanation gradually decreases, while lnGDP’s proportion continues to strengthen. After the tenth period, lnGDP’s proportion surpasses that of lnpa, reaching its maximum proportion of 51.1% at the thirtieth period. In contrast, lnpa’s explanatory proportion continues to decrease slowly after the twenty-fourth period, stabilizing at its minimum proportion of 24.6% at the thirtieth period. This suggests that with an increase in the number of periods, the fluctuations in green innovation patents increasingly depend on economic growth, with economic growth becoming the main source after the tenth period.
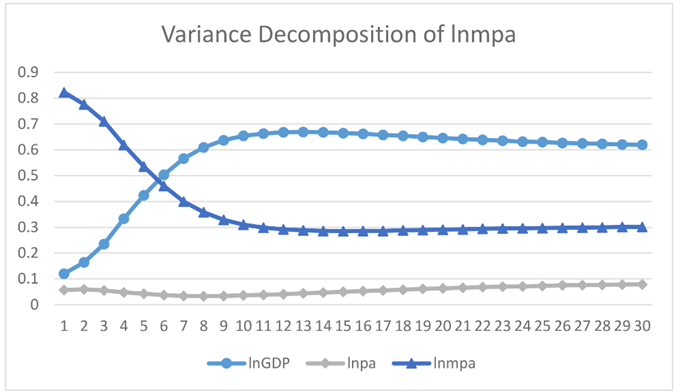
Figure 3: Variance decomposition of lnpa
The variance decomposition chart for lnmpa (Figure 4) shows that at first period, lnmpa’s self-explanation proportion is 82.3%, while lnGDP’s proportion of lnmpa is 12%. With an increase in the number of periods, lnGDP’s proportion of lnmpa steadily rises, while lnmpa’s self-explanation steadily decreases. After the sixth period, lnGDP’s proportion surpasses that of lnmpa. lnGDP reaches its maximum proportion of 66.9% at the thirteenth period, followed by a slight decline to 62% at the thirtieth period. On the other hand, lnmpa’s proportion decreases to its minimum of 28.5% at the fifteenth period and then slightly increases to 30.1% at the thirtieth period. This suggests that with an increase in the number of periods, the fluctuations in green utility model patents increasingly depend on economic growth, with economic growth becoming the primary source after the sixth period.
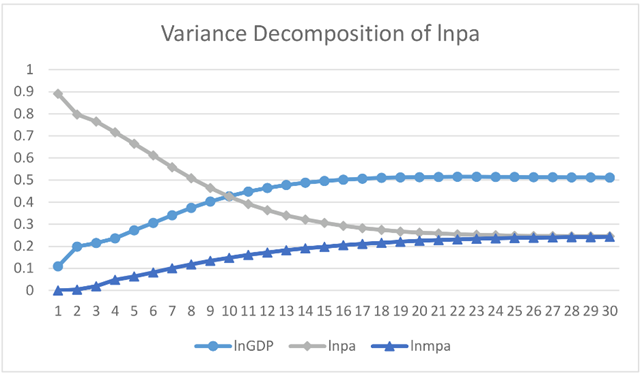
Figure 4: Variance decomposition of lnmpa
4.6. Robustness test
To ensure unbiased results, we re-ordered variables, conducted variance decomposition, and performed Monte Carlo simulations of impulse responses. The findings remained consistent with the main empirical results, with impulse response function (IRF) analysis and Granger causality tests aligning well. This supports the robustness and accuracy of the model in reflecting the economic relationships between variables. The GMM estimation, impulse responses, and variance decomposition collectively confirm the reliability of the results.
5. Conclusion
Empirical analysis shows that a standard deviation shock to green innovation patents has a delayed and gradually increasing negative effect on economic growth, while green utility model patents also exhibit a slight negative GDP impact. Conversely, GDP shocks positively influence green innovation patents, with a sustained increase, indicating that economic growth supports green innovation over time. However, the impact of green innovation patents peaks initially and then declines after the eighth period, highlighting the need to capture early benefits while managing longer-term environmental challenges. Additionally, GDP shocks positively affect green utility model patents with a growing effect over time, suggesting the importance of adapting green innovation policies to regional development stages. Although green utility model patent shocks initially bring positive effects, these diminish over time due to cost and adaptation challenges.
5.1. Contribution
This study uniquely applies a Panel VAR model with a system-GMM approach to analyze the dynamic relationship between green innovation and economic growth. Notably, we utilize a comprehensive panel of all 31 provincial-level units in mainland China from 1992 to 2021—a scope previously limited to specific regions. Our findings offer critical policy insights for China’s path toward green economic growth.
5.2. Policy Implication
Our results provide a scientific basis for national and business-level strategic planning, emphasizing the need to adapt economic growth paths toward green development. Although green innovation currently shows a slight negative effect on growth, empirical results suggest that further economic growth may be constrained by immature green innovation. Thus, fostering green innovation is essential not only for mitigating climate change but also as a strategic approach to enhance competitiveness and long-term economic growth.
References
[1]. Tao Feng, Zhao Jinyu, Zhou Hao (2021). Has Environmental Regulation Achieved "Incremental Improvement" in Green Technological Innovation? — Evidence from the Environmental Protection Target Responsibility System. China Industrial Economics [online]. 136-154. ISSN: 1006-480X. DOI: 10.19581/j.cnki.ciejournal.2021.02.016.
[2]. Chen Qing (2023). How Does Environmental Regulation Affect Corporate Green Innovation? — Empirical Evidence from Listed Manufacturing Companies. China Development [online]. 23, 82-90. ISSN: 1671-2404.
[3]. Yang Chaojun, Liu Bing, Bi Kexin (2019). Evolutionary Game Study on the Diffusion of Green Innovation Between Domestic and Foreign Enterprises Under Government Regulation. Soft Science [online]. 33, 86-91. ISSN: 1001-8409. DOI: 10.13956/j.ss.1001-8409.2019.12.14.
[4]. Amore, M. D. and Bennedsen, M. (2016). Corporate governance and green innovation. Journal of Environ- mental Economics and Management [online]. 75, pp. 54–72. ISSN: 0095-0696.
[5]. Li, D., Zheng, M., Cao, C., Chen, X., et al. (2017). The impact of legitimacy pressure and corporate prof- itability on green innovation: Evidence from China top 100. Journal of Cleaner Production [online]. 141, pp. 41–49. ISSN:0959-6526.
[6]. Wang Jianqiu (2020). Study on the Impact of Green Technological Innovation on Industrial Economic Growth — A Case Study of Hubei Province. Special Zone Economy. 36-38. ISSN: 1004-0714.
[7]. Zhang Zhengang, Bai Zhenghui, Chen Zhiming (2014). Study on the Multivariate Cointegration Relationship Between Green Innovation and Economic Growth — Based on Data from Guangdong Province from 1989 to 2011. Science & Technology Progress and Policy. 31, 24-30. ISSN: 1001-7348.
[8]. Balsalobre-Lorente, D., Shahbaz, M., Roubaud, D., and Farhani, S. (2018). How economic growth, renewable electricity and natural resources contribute to CO2 emissions? Energy Policy [online]. 113, pp. 356–367. ISSN: 0301-4215
[9]. Baneliene, R. and Strazdas, R. (2023). Green Innovation for Competitiveness: Impact on GDP Growth in the European Union. Contemporary Economics [online]. 17, pp. 92–108. DOI: 10.5709/ce.1897- 9254.501.
[10]. Horváthová, E. (2012). The impact of environmental performance on firm performance: Short-term costs and long-term benefits? Ecological Economics [online]. 84. The Economics of Degrowth, pp. 91–97. ISSN: 0921-8009.
[11]. Maiulyt-niukien, A. and Sekhniashvili, D. (2021). The eco-innovation impact on economic and environmen- tal performance of EU Member States. Journal Business, Management and Economics Engineering [online].
[12]. Zheng, L. and Iatridis, K. (2022). Friends or foes? A systematic literature review and metaanalysis of the relationship between ecoinnovation and firm performance. Business Strategy and the Environment [online].
[13]. Bilas, V., Bonjak, M., and izmi, T. (2016). RELATIONSHIP BETWEEN RESEARCH AND DEVELOPMENT AND ECONOMIC GROWTH IN THE EU COUNTRIES. Economic and Social Development: Book of Proceedings [online].
[14]. Pala, A. (2019). Innovation and Economic Growth in Developing Countries: Empirical Implication of Swamy’s Random Coefficient Model (RCM). Procedia Computer Science [online]. 158, pp. 1122–1130. ISSN: 1877-0509.
[15]. Pesaran, M. H. (2007). A simple panel unit root test in the presence of cross-section dependence. Journal of Applied Econometrics [online]. 22.2, pp. 265–312.
Cite this article
Wang,M.;Wang,A.;Li,D.;Wang,R.;Li,X. (2025). On the Dynamic Nexus of Economic Growth and Green Innovation in China: New Perspective from a GMM Panel VAR Approach. Advances in Economics, Management and Political Sciences,159,29-38.
Data availability
The datasets used and/or analyzed during the current study will be available from the authors upon reasonable request.
Disclaimer/Publisher's Note
The statements, opinions and data contained in all publications are solely those of the individual author(s) and contributor(s) and not of EWA Publishing and/or the editor(s). EWA Publishing and/or the editor(s) disclaim responsibility for any injury to people or property resulting from any ideas, methods, instructions or products referred to in the content.
About volume
Volume title: Proceedings of the 4th International Conference on Business and Policy Studies
© 2024 by the author(s). Licensee EWA Publishing, Oxford, UK. This article is an open access article distributed under the terms and
conditions of the Creative Commons Attribution (CC BY) license. Authors who
publish this series agree to the following terms:
1. Authors retain copyright and grant the series right of first publication with the work simultaneously licensed under a Creative Commons
Attribution License that allows others to share the work with an acknowledgment of the work's authorship and initial publication in this
series.
2. Authors are able to enter into separate, additional contractual arrangements for the non-exclusive distribution of the series's published
version of the work (e.g., post it to an institutional repository or publish it in a book), with an acknowledgment of its initial
publication in this series.
3. Authors are permitted and encouraged to post their work online (e.g., in institutional repositories or on their website) prior to and
during the submission process, as it can lead to productive exchanges, as well as earlier and greater citation of published work (See
Open access policy for details).
References
[1]. Tao Feng, Zhao Jinyu, Zhou Hao (2021). Has Environmental Regulation Achieved "Incremental Improvement" in Green Technological Innovation? — Evidence from the Environmental Protection Target Responsibility System. China Industrial Economics [online]. 136-154. ISSN: 1006-480X. DOI: 10.19581/j.cnki.ciejournal.2021.02.016.
[2]. Chen Qing (2023). How Does Environmental Regulation Affect Corporate Green Innovation? — Empirical Evidence from Listed Manufacturing Companies. China Development [online]. 23, 82-90. ISSN: 1671-2404.
[3]. Yang Chaojun, Liu Bing, Bi Kexin (2019). Evolutionary Game Study on the Diffusion of Green Innovation Between Domestic and Foreign Enterprises Under Government Regulation. Soft Science [online]. 33, 86-91. ISSN: 1001-8409. DOI: 10.13956/j.ss.1001-8409.2019.12.14.
[4]. Amore, M. D. and Bennedsen, M. (2016). Corporate governance and green innovation. Journal of Environ- mental Economics and Management [online]. 75, pp. 54–72. ISSN: 0095-0696.
[5]. Li, D., Zheng, M., Cao, C., Chen, X., et al. (2017). The impact of legitimacy pressure and corporate prof- itability on green innovation: Evidence from China top 100. Journal of Cleaner Production [online]. 141, pp. 41–49. ISSN:0959-6526.
[6]. Wang Jianqiu (2020). Study on the Impact of Green Technological Innovation on Industrial Economic Growth — A Case Study of Hubei Province. Special Zone Economy. 36-38. ISSN: 1004-0714.
[7]. Zhang Zhengang, Bai Zhenghui, Chen Zhiming (2014). Study on the Multivariate Cointegration Relationship Between Green Innovation and Economic Growth — Based on Data from Guangdong Province from 1989 to 2011. Science & Technology Progress and Policy. 31, 24-30. ISSN: 1001-7348.
[8]. Balsalobre-Lorente, D., Shahbaz, M., Roubaud, D., and Farhani, S. (2018). How economic growth, renewable electricity and natural resources contribute to CO2 emissions? Energy Policy [online]. 113, pp. 356–367. ISSN: 0301-4215
[9]. Baneliene, R. and Strazdas, R. (2023). Green Innovation for Competitiveness: Impact on GDP Growth in the European Union. Contemporary Economics [online]. 17, pp. 92–108. DOI: 10.5709/ce.1897- 9254.501.
[10]. Horváthová, E. (2012). The impact of environmental performance on firm performance: Short-term costs and long-term benefits? Ecological Economics [online]. 84. The Economics of Degrowth, pp. 91–97. ISSN: 0921-8009.
[11]. Maiulyt-niukien, A. and Sekhniashvili, D. (2021). The eco-innovation impact on economic and environmen- tal performance of EU Member States. Journal Business, Management and Economics Engineering [online].
[12]. Zheng, L. and Iatridis, K. (2022). Friends or foes? A systematic literature review and metaanalysis of the relationship between ecoinnovation and firm performance. Business Strategy and the Environment [online].
[13]. Bilas, V., Bonjak, M., and izmi, T. (2016). RELATIONSHIP BETWEEN RESEARCH AND DEVELOPMENT AND ECONOMIC GROWTH IN THE EU COUNTRIES. Economic and Social Development: Book of Proceedings [online].
[14]. Pala, A. (2019). Innovation and Economic Growth in Developing Countries: Empirical Implication of Swamy’s Random Coefficient Model (RCM). Procedia Computer Science [online]. 158, pp. 1122–1130. ISSN: 1877-0509.
[15]. Pesaran, M. H. (2007). A simple panel unit root test in the presence of cross-section dependence. Journal of Applied Econometrics [online]. 22.2, pp. 265–312.