


1. Introduction
To balance economic growth and environmental protection, countries worldwide aim to achieve carbon consumption and balance goals. Under the United Nations Framework Convention on Climate Change, over 130 nations have set climate targets. China actively participates in global climate governance, establishing a "dual carbon" target. Agriculture contributes about 15% of China's total greenhouse gas emissions. Thus, promoting agricultural carbon reduction is crucial for achieving the "dual carbon" goal and addressing climate change.
The academic community has extensively discussed agricultural carbon emissions, mainly categorized into two research areas: measuring emissions, intensity, efficiency, and compensation rates; and exploring potential influencing factors like farmland transfer, specialization, green production technology, rural energy poverty alleviation, and urban-rural integration. Additionally, numerous studies have investigated the impact of agriculture-related policies, including policy-based insurance, sustainable development pilot zones, and credit subsidies, on carbon emissions.
The existing academic studies offer robust support for addressing this issue and provide valuable references for the evaluation system and research methods employed in this paper. However, these studies have scarcely examined the potential future impact of high-standard farmland construction policies. Farmland is a crucial carbon emission source and absorption center, and the implementation of such policies presents a significant opportunity to achieve agricultural low-carbon emission reduction targets. Since the official launch of the high-standard farmland construction policy after the "12th Five-Year Plan" in 2011, China has successfully constructed 1 billion mu of high-standard farmland, ensuring stable protection of over 1.3 trillion kilograms of grain production. This construction has notably improved agricultural land quality, expanded land size, and enhanced the level of agricultural labor division. These improvements help reduce the use of agricultural chemicals, effectively decrease non-point source pollution, and lower agricultural carbon emissions. However, enhanced agricultural machinery operational adaptability due to high-standard farmland construction may increase carbon emissions from improved mechanization levels, posing a significant unknown factor for agricultural carbon reduction. Hence, this paper aims to address two core questions: whether high-standard farmland construction promotes agricultural carbon reduction and the mechanism through which it affects agricultural carbon emissions. Using provincial panel data from 2007 to 2017 and a continuous DID assessment model, this study conducted a quasi-natural experimental analysis to investigate the policy's differential impact on agricultural carbon emissions, analyze the underlying mechanisms, and rigorously verify and validate relevant research findings.
The marginal contributions of this paper include: analyzing the agricultural carbon reduction effect of high-standard farmland policy using the continuous differential method, exploring its operational mechanism via an intermediary model, and discussing heterogeneous policy impacts on carbon reduction to guide future improvements and targeted methods.
2. Theoretical analysis
Regulating rural land integrates use, enhances function, and offers ecological benefits. Economically, scale economies optimize resource allocation, cutting costs and boosting output. High-standard farmland consolidates fragmented fields, optimizing management scale without altering area. Moderate-scale production cuts carbon emissions by efficiently using factors and reducing capital. Ecologically, farmland remediation balances ecosystem services, enhancing soil retention and carbon storage. Leveling land, reducing erosion, and improving irrigation conditions (a key aspect) also lower agricultural carbon emissions.
The logic behind promoting agricultural carbon emission reduction through high-standard farmland construction policies lies in reducing the intensity of agricultural chemical use. High-standard farmland policies centralized land allocation, avoiding fragmentation and optimizing production factor distribution, thus reducing chemical dependency. Land leveling facilitates machinery use for fertilizer application and drone-based pesticide spraying, enhancing chemical use efficiency and preventing overuse. Additionally, optimized spatial allocation and centralized crop planting foster horizontal division of labor, promoting low-carbon technology adoption, improving factor utilization, and reducing chemical input intensity. Furthermore, land transfer and scale expansion, encouraged by these policies, enhance chemical utilization and further reduce input intensity.
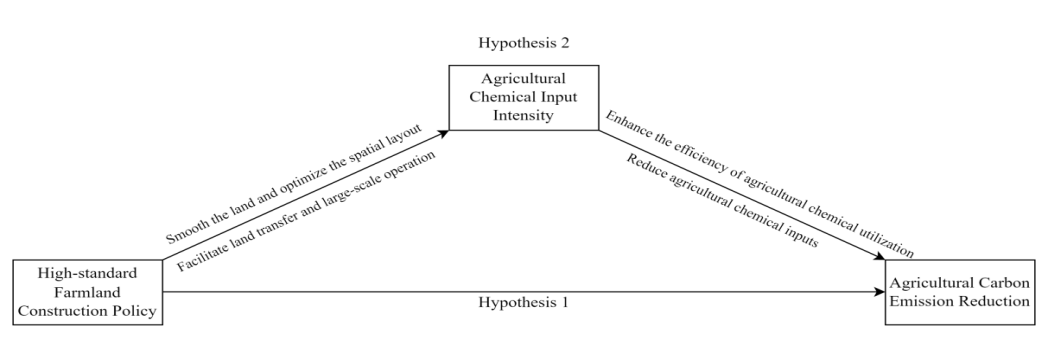
Figure 1: Theoretical framework of influence mechanism
3. Variable selection and model setting
3.1. Variable declaration
1.Explained variable: Agricultural carbon emissions(Carbon). Given data availability and research depth, this paper focuses on narrow agriculture (plantation industry) and measures its carbon emissions. Based on [1], emissions include pesticides, fertilizers, films, diesel, land ploughing, and irrigation. Its carbon emission coefficient was set at \( 4.93kg∙{kg^{-1}} \) 、 \( 0.89kg∙{kg^{-1}} \) 、 \( 5.18kg∙{kg^{-1}} \) 、 \( 0.59kg∙{kg^{-1}} \) 、 \( 312.60kg∙{km^{-2}} \) 、 \( 266.48kg∙{hm^{-2}} \) by referring to the studies of [2], [3], [4] and [5] respectively.Carbon emissions are calculated as shown in equation (1) :
\( {C_{t}}=\sum _{k=1}^{n}{c_{kt}}=\sum _{k=1}^{n}{θ_{k}}{ω_{k}}\ \ \ (1) \)
Where, \( {C_{t}} \) represents the total agricultural carbon emission; k and t represent the type and time of carbon emission sources respectively. \( {c_{kt}} \) represents the carbon emissions of each carbon emission source. \( {θ_{k}} \) and \( {ω_{k}} \) represent the carbon emission coefficient and corresponding carbon emission of each carbon emission source, respectively.
2.Explanatory variables.
(1) Core explanatory variable: High-standard farmland construction policy. This paper refers to the studies of [6] and [7], and utilizes the interaction term \( {HFC_{i}}×T_{t}^{2011} \) between the proportion of land consolidation area and the dummy variables at the time of policy implementation for characterization. The proportion of land regulation area refers to the percentage of low-yield and high-standard farmland area in the total cultivated land area. Since the high-standard farmland construction policy started to be standardized in 2011, \( T_{t}^{2011} \) is 1 when \( t≥2011 \) . Otherwise, 0 is adopted.
(2) Mediating variable: Agricultural chemical input intensity (ACII). In this paper, referring to the study of [8], the ratio of the total amount of fertilizer, pesticide and agricultural film used to the sown area of crops was used to measure the input intensity of agricultural chemicals.
(3) Control variables: Control variables selected in this paper include total agricultural output value (Agr), economic development level (Eco, represented by per capita GDP), land management scale (Sca, represented by the ratio of crop sown area to agricultural labor force), and urbanization level (Urb, represented by the proportion of urban population), social consumption level (consume), and investment in environmental pollution control (environment, represented by the ratio of investment in environmental pollution control to GDP)
3.The methods of obtaining data and describing data. This paper examines the impact of high-standard farmland construction policy on agricultural carbon emission reduction using panel data from 31 mainland provinces (2007-2017) as a quasi-natural experiment. The data in this paper are mainly from the "China Rural Statistical Yearbook", "China Fiscal Yearbook", "China Statistical Yearbook", "China Population and Employment Statistical Yearbook", "China Agricultural Machinery Industry Yearbook" and "China Rural Operation and Management Statistical Annual Report".
3.2. Model construction
1.Continuous difference-in-differences model:
Given provincial differences in land, water, pollution, and agricultural needs, leading to policy heterogeneity, this paper uses a continuous DID model to evaluate the impact of high-standard farmland construction on agricultural carbon emissions. Unlike traditional DID, it employs a continuous variable ("proportion of land reclamation area") to distinguish experimental (larger area) from control groups (smaller area). The continuous DID model retains DID's strengths, better captures data trends, shows wider sample differences, and avoids subjective grouping biases ([9][10]).
In view of this, in order to identify the impact of high-standard farmland construction policies on agricultural carbon emissions, this paper constructs a continuous DID model as follows:
\( {Carbon_{it}}={β_{0}}+{β_{1}}×{HFC_{i}}×T_{t}^{2011}+{β_{2}}×{Control_{it}}+{δ_{i}}+{μ_{t}}+{ε_{it}}\ \ \ (2) \)
In the formula, \( {Carbon_{it}} \) is the explained variable, that is, the agricultural carbon emissions of province i in period t, and the subscripts i and t represent the province and year respectively. \( {β_{0}} \) is the constant term; \( {HFC_{i}} \) is the proportion of land improvement area in province i; \( T_{t}^{2011} \) is the virtual variable of point t when the policy is implemented; \( {β_{1}} \) and \( {β_{2}} \) are the parameters to be estimated; \( {Control_{it}} \) is a series of control variables; \( {δ_{i}} \) is the province fixed effect; \( {μ_{t}} \) is the year fixed effect; \( {ε_{it}} \) is the random error term.
2.Intermediary effect model:
This study uses a two-stage method to examine the influence of high-standard farmland policy on agricultural carbon emissions. Stage one focuses on policy effects on agricultural chemical input intensity; stage two explores the impact of this intensity on carbon emissions. In this paper, the following mediation effect model is set up for mechanism verification:
\( {ACII_{it}}={β_{0}}+{β_{1}}×{HFC_{i}}×T_{t}^{2011}+{β_{2}}×{Control_{it}}+{δ_{i}}+{μ_{t}}+{ε_{it}}\ \ \ (3) \)
\( {Carbon_{it}}={β_{0}}+{β_{1}}×{HFC_{i}}×T_{t}^{2011}+γ×{ACII_{it}}+{β_{2}}×{Control_{it}}+{δ_{i}}+{μ_{t}}+{ε_{it}}\ \ \ (4) \)
Where, \( {ACII_{it}} \) represents the intermediate variable agricultural chemical input intensity; \( γ \) is the parameter to be estimated; Other variables and parameters are set as in formula (2).
4. Empirical result analysis
4.1. Baseline regression result
This section analyzes the impact of high-standard farmland policies on agricultural carbon emissions (Table 1). Regression results show significant negative correlations at 5% and 1% levels, indicating policy implementation promotes carbon reduction. Considering other variables, the negative impact is significant at 1% with an estimated reduction of 18.7% per unit. This confirms the policy's practical value and significant effects.
Additionally, agricultural carbon emissions were influenced by total agricultural output, economic development, environmental governance investment, and social consumption. Higher economic growth and output increased fertilizer and pesticide use, boosting emissions. While environmental investment grew, agricultural complexity might limit its effectiveness, and some measures could inadvertently raise emissions. Notably, higher social consumption drove demand for eco-friendly products, promoting agricultural transformation and reducing emissions.
Table 1: Baseline regression results
(1) | (2) | (3) | (4) | |
VARIABLES | carbon | Standard errors | carbon | Standard errors |
did | -0.143** | (0.059) | -0.187*** | (0.056) |
time | 0.245*** | (0.023) | 0.068 | (0.058) |
HFC | -0.213** | (0.085) | -0.192** | (0.081) |
Agr | 0.037*** | (0.013) | ||
Eco | 0.267*** | (0.087) | ||
Sca | -0.010 | (0.029) | ||
Urb | -0.084 | (0.355) | ||
consume | -0.301*** | (0.112) | ||
environment | 0.088*** | (0.013) | ||
Constant | 3.571*** | (0.034) | 0.562 | (0.865) |
year FE | Yes | Yes | ||
province FE | Yes | Yes | ||
Observations | 341 | 341 |
Standard errors in parentheses
*** p<0.01, ** p<0.05, * p<0.1
4.2. Parallel trend test and policy dynamic effect
Parallel trend detection is vital for DID model validity, ensuring pre-policy differences are insignificant. Using 2011, the year of high-standard farmland construction policy implementation as a reference, Figure 2 shows estimated coefficient changes within a 95% confident interval. Pre-policy, coefficients mostly include 0, indicating no significant differences. Post-policy, the CI mostly falls below 0, confirming significant differences and supporting policy effectiveness in controlling agricultural carbon emissions sustainably.
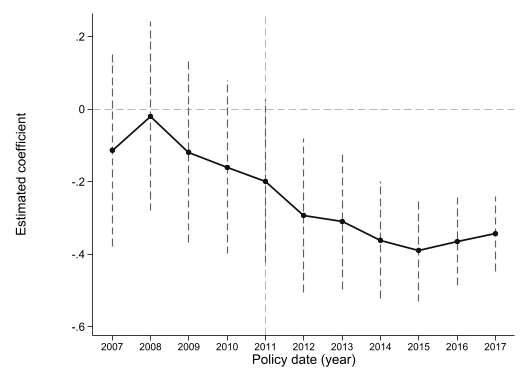
Figure 2: Parallel trend test
Table 2 shows dynamic impact of high-standard farmland policies on agricultural carbon emissions. Before 2011, the core variable's coefficient was insignificant. In 2011, it became significant at 10%, strengthening post-2011, indicating cumulative effects. Initial effectiveness was limited by equipment investment. With policy optimization and funding, impact emerged. Before the implementation, the coefficient was stable, showing a lag but gradual enhancement.
Table 2: Estimation of the dynamic impact
(1) | (2) | |
VARIABLES | carbon | Standard errors |
HFC×2007 | -0.113 | (0.135) |
HFC×2008 | -0.020 | (0.132) |
HFC×2009 | -0.118 | (0.126) |
HFC×2010 | -0.160 | (0.121) |
HFC×2011 | -0.199* | (0.114) |
HFC×2012 | -0.293*** | (0.108) |
HFC×2013 | -0.310*** | (0.095) |
HFC×2014 | -0.361*** | (0.082) |
HFC×2015 | -0.389*** | (0.072) |
HFC×2016 | -0.365*** | (0.061) |
HFC×2017 | -0.344*** | (0.052) |
Constant | 0.257 | (0.884) |
Control | Yes | |
year FE | Yes | |
province FE | Yes | |
Observations | 341 | |
R-squared | 0.997 |
Standard errors in parentheses
*** p<0.01, ** p<0.05, * p<0.1
4.3. Robustness test
Figure 3 displays the kernel density of P-values and estimated coefficients in the placebo test (dashed line at 0.1 significance). The placebo test, after virtual treatment and 500 samples, mostly yielded P-values > 0.1, failing the 10% significance test, confirming robustness of the original variable. Most virtual policy coefficients clustered near 0, normally distributed, further validating ineffectiveness of virtual treatment and robustness of the original policy in model interpretation.
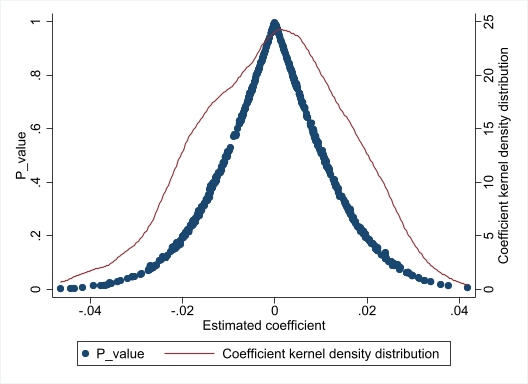
Figure 3: Placebo test: P-value and coefficient combination plot
After that, this paper also tries to conduct robustness test by replacing the core explained variable and excluding other policy interference, and the verification results are shown in Table 3.
Table 3: Robustness test
(1) | (2) | (3) | (4) | |
VARIABLES | replace the core explained variable | Standard errors | exclude other policy interference | Standard errors |
did | -0.093*** | (0.028) | -0.177*** | (0.057) |
time | 0.034 | (0.029) | 0.079** | (0.034) |
HFC | -0.096** | (0.040) | -0.255** | (0.103) |
Agr | 0.019*** | (0.006) | 0.025 | (0.016) |
Eco | 0.133*** | (0.043) | 0.487*** | (0.107) |
Sca | -0.005 | (0.014) | -0.062* | (0.036) |
Urb | -0.042 | (0.177) | -0.673 | (0.434) |
environment | 0.044*** | (0.007) | 0.081*** | (0.018) |
consume | -0.150*** | (0.056) | -0.298** | (0.146) |
Constant | 0.281 | (0.432) | -1.043 | (1.004) |
year FE | Yes | Yes | ||
province FE | Yes | Yes | ||
Observations | 341 | 279 |
Standard errors in parentheses
*** p<0.01, ** p<0.05, * p<0.1
1. Replace core explained variable with agricultural carbon emission intensity (Carbon_1), correlated with the original. Table 3(1) shows coefficient -0.093, significant at 1%, supporting policy's effect on reducing emissions.
2. Eliminate other policy distractions. Following the "new development concept" in 2015, "green" became a key concept in agricultural ecology and complementary policies may significantly impact agricultural carbon emissions. This paper re-analyzes post-2015 samples via regression, detailed in Table 3(3). The high-standard farmland policy's impact coefficient on carbon emissions was remarkable, confirming the baseline results' reliability despite other policies.
4.4. Analysis on the mechanism of agricultural carbon emission reduction
Based on theoretical discussions, the high-standard farmland policy may reduce agricultural carbon emissions by decreasing chemical input. Table 4 shows: (1) Significant reduction in chemical use due to the policy. (2) Positive correlation between chemical input intensity and carbon emissions at the 5% level, with the policy coefficient dropping from 0.187 to 0.149.
Table 4: Mechanism test results of agricultural carbon emission reduction
(1) | (2) | (3) | (4) | |
VARIABLES | ACII | Standard errors | carbon_1 | Standard errors |
did | -0.361*** | (0.063) | -0.149** | (0.059) |
ACII | 0.104** | (0.052) | ||
time | -0.094 | (0.064) | 0.078 | (0.058) |
HFC | 0.487*** | (0.090) | -0.243*** | (0.085) |
Agr | 0.057*** | (0.014) | 0.032** | (0.013) |
Eco | 0.142 | (0.097) | 0.252*** | (0.087) |
Sca | 0.004 | (0.032) | -0.010 | (0.029) |
Urb | -0.676* | (0.395) | -0.013 | (0.355) |
environment | -0.003 | (0.015) | 0.089*** | (0.013) |
consume | 0.226* | (0.125) | -0.324*** | (0.112) |
Constant | -0.651 | (0.963) | 0.630 | (0.861) |
year FE | Yes | Yes | ||
province FE | Yes | Yes | ||
Observations | 341 | 341 |
Standard errors in parentheses
*** p<0.01, ** p<0.05, * p<0.1
4.5. Heterogeneity analysis
In this paper, the Zou test was used to assess group differences. The p-values for group coefficient differences, comparing agricultural function area and land circulation standards, were <0.001, significant at the 1% level. Thus, significant inter-group coefficient variations justify subsequent heterogeneity analysis.
1. Distribution heterogeneity of agricultural functional areas. Considering cultivated land area and tillage intensity, high-standard farmland policy effects on carbon emissions differ between major and non-major grain-producing areas. Table 5 (1) (2) shows: In non-major areas, the policy significantly reduces agricultural carbon emissions at the 5% level, possibly due to dispersed farmland, lower ecological quality, and rigorous policy implementation. Conversely, in major areas, the policy's impact is insignificant, perhaps due to a focus on production over ecology, limiting low-carbon development and reducing marginal benefits of support.
2. Heterogeneity of land circulation degree. Table 5(3)(4) indicates that high-standard farmland policy significantly reduces agricultural carbon emissions in provinces with high land transfer (1% level), promoting low-carbon development. In low land transfer provinces, the policy impact is insignificant. Land transfer influences agricultural structure and resource use, aiding carbon reduction. High-standard farmland construction boosts farmer efficiency, reduces risks, and fosters technology adoption, enabling large-scale management and green tech progress, further enhancing carbon reduction.
Table 5: Heterogeneity regression result
(1) | (2) | (3) | (4) | ||
VARIABLES | Major grain producing areas | Non-major grain producing areas | high land transfer degree | low land transfer degree | |
did | -0.199 | -0.135** | -0.300*** | -0.107 | |
(0.139) | (0.059) | (0.064) | (0.072) | ||
Constant | 9.968*** | -0.284 | 0.811 | 0.832 | |
(1.439) | (1.063) | (1.200) | (1.412) | ||
Controls | Yes | Yes | Yes | Yes | |
year FE | Yes | Yes | Yes | Yes | |
province FE | Yes | Yes | Yes | Yes | |
Observations | 143 | 198 | 188 | 153 | |
Coefficient difference p-value | \( \lt 0.001 \) | \( \lt 0.001 \) | |||
Note: The inter-group difference test of coefficients for heterogeneity analysis was calculated according to the Chow test estimate of the interaction term model.
Standard errors in parentheses
*** p<0.01, ** p<0.05, * p<0.1
5. Conclusions and policy implications
5.1. Conclusions
Climate change poses a global challenge, with carbon reduction efforts gaining worldwide attention. Agricultural carbon emissions, a significant source, are crucial for achieving "dual carbon" goals. Using panel data from 31 Chinese provinces (2007-2017), combined with continuous DID and intermediary effect models, this paper explores the role of high-standard farmland construction policies in reducing agricultural carbon emissions. Key findings include: (1) High-standard farmland policies significantly reduce emissions by 18.7% on average, with credibility confirmed by variable substitution and policy factor exclusion. (2) Reduced agricultural chemical input intensity mediates the policy's emission reduction process. (3) Heterogeneity analysis shows significant emission reductions in provinces with high land transfer and non-major grain producing areas, but less so in others.
5.2. Policy implications
The research implies: Firstly, high-standard farmland construction reduces carbon emissions, warranting further implementation. Local governments should prioritize this, optimize management, and promote collaborative, low-carbon, sustainable agriculture. Secondly, government departments should emphasize scientific use of agricultural chemicals, adopting acid and pollution control, and "soil testing formula" to maintain balance and repair contamination. Increasing organic fertilizers and straw returning can improve soil and reduce waste. Governments should tailor implementations to local conditions, supporting low-transfer areas for efficient land use. Local governments should ensure fair, transparent transfer platforms. Major grain areas should adopt intensive management, improve resource use, and promote green technologies, aligning with sustainable agriculture and ecological protection.
References
[1]. DING B G, ZHAO Y, DENG J H. Calculation, Decoupling Effects and Driving Factors of Carbon Emission From Planting Industry in China[J]. Chinese Journal of Agricultural Resources and Regional Planning, 2022,43(05):1-11.
[2]. MA T. Current Evaluation of Agricultural Carbon Sources and Carbon Sinks and Potential Analysis of Enhancing Carbon Sinks in Shanghai[J]. Journal of Agricultural Resources and Environment, 2011,28(05):38-41.
[3]. WANG B Y, ZHANG W G. A Research of Agricultural Eco-efficiency measure in China and Space-time Differences[J]. China Population,Resources and Environment, 2016,26(06):11-19.
[4]. LI B, ZHANG J B, LI H P. Research on Spatial-temporal Characteristics and Affecting Factors Decomposition of Agricultural Carbon Emission in China[J]. China Population,Resources and Environment, 2011,21(08):80-86.
[5]. DUAN H P, ZHANG Y, ZHAO J B, BIAN X M. Carbon Footprint Analysis of Farmland Ecosystem in China[J]. Journal of Soil and Water Conservation, 2011,25(05):203-208.
[6]. LIANG Z H, ZHANG L, ZHANG J B. Land Consolidation and Fertilizer Reduction: Quasi-natural Experimental Evidence from China’s Well-facilitated Capital Farmland Construction[J]. Chinese Rural Economy, 2021,(04):123-144.
[7]. XIONG F X, ZHAO X L, GUO Z Y, ZHU S B. Research on the effects of rural land consolidation on agricultural carbon emissions: aquasi-natural experiment based on the high-standard farmland construction policy[J]. Chinese Journal of Eco-Agriculture, 2023,31(12): 2022−2032
[8]. JI X Q, LI Z Q, ZHANG Y S. Influence of Rural Land Transfer on Agricultural Carbon Emissions and its Spatial Characteristics[J]. Resources Science, 2023,45(01):77-90.
[9]. Nancy ,Q. Missing Women and the Price of Tea in China: The Effect of Sex-specific Earnings on Sex Imbalance[J].The Quarterly Journal of Economics,2008(3):1251-1285
[10]. FAN Z Y, ZHANG H, CHEN J. The Spillover Effects of Public Transportation on Housing Market: A Case Study of Subway[J]. China Industrial Economics, 2018,(05):99-117.
Cite this article
Guan,X. (2025). Assessment of Agricultural Carbon Emission Reduction Effect of Land Consolidation: A Quasi-natural Experiment Based on a High-standard Farmland Construction Policy. Advances in Economics, Management and Political Sciences,159,39-47.
Data availability
The datasets used and/or analyzed during the current study will be available from the authors upon reasonable request.
Disclaimer/Publisher's Note
The statements, opinions and data contained in all publications are solely those of the individual author(s) and contributor(s) and not of EWA Publishing and/or the editor(s). EWA Publishing and/or the editor(s) disclaim responsibility for any injury to people or property resulting from any ideas, methods, instructions or products referred to in the content.
About volume
Volume title: Proceedings of the 4th International Conference on Business and Policy Studies
© 2024 by the author(s). Licensee EWA Publishing, Oxford, UK. This article is an open access article distributed under the terms and
conditions of the Creative Commons Attribution (CC BY) license. Authors who
publish this series agree to the following terms:
1. Authors retain copyright and grant the series right of first publication with the work simultaneously licensed under a Creative Commons
Attribution License that allows others to share the work with an acknowledgment of the work's authorship and initial publication in this
series.
2. Authors are able to enter into separate, additional contractual arrangements for the non-exclusive distribution of the series's published
version of the work (e.g., post it to an institutional repository or publish it in a book), with an acknowledgment of its initial
publication in this series.
3. Authors are permitted and encouraged to post their work online (e.g., in institutional repositories or on their website) prior to and
during the submission process, as it can lead to productive exchanges, as well as earlier and greater citation of published work (See
Open access policy for details).
References
[1]. DING B G, ZHAO Y, DENG J H. Calculation, Decoupling Effects and Driving Factors of Carbon Emission From Planting Industry in China[J]. Chinese Journal of Agricultural Resources and Regional Planning, 2022,43(05):1-11.
[2]. MA T. Current Evaluation of Agricultural Carbon Sources and Carbon Sinks and Potential Analysis of Enhancing Carbon Sinks in Shanghai[J]. Journal of Agricultural Resources and Environment, 2011,28(05):38-41.
[3]. WANG B Y, ZHANG W G. A Research of Agricultural Eco-efficiency measure in China and Space-time Differences[J]. China Population,Resources and Environment, 2016,26(06):11-19.
[4]. LI B, ZHANG J B, LI H P. Research on Spatial-temporal Characteristics and Affecting Factors Decomposition of Agricultural Carbon Emission in China[J]. China Population,Resources and Environment, 2011,21(08):80-86.
[5]. DUAN H P, ZHANG Y, ZHAO J B, BIAN X M. Carbon Footprint Analysis of Farmland Ecosystem in China[J]. Journal of Soil and Water Conservation, 2011,25(05):203-208.
[6]. LIANG Z H, ZHANG L, ZHANG J B. Land Consolidation and Fertilizer Reduction: Quasi-natural Experimental Evidence from China’s Well-facilitated Capital Farmland Construction[J]. Chinese Rural Economy, 2021,(04):123-144.
[7]. XIONG F X, ZHAO X L, GUO Z Y, ZHU S B. Research on the effects of rural land consolidation on agricultural carbon emissions: aquasi-natural experiment based on the high-standard farmland construction policy[J]. Chinese Journal of Eco-Agriculture, 2023,31(12): 2022−2032
[8]. JI X Q, LI Z Q, ZHANG Y S. Influence of Rural Land Transfer on Agricultural Carbon Emissions and its Spatial Characteristics[J]. Resources Science, 2023,45(01):77-90.
[9]. Nancy ,Q. Missing Women and the Price of Tea in China: The Effect of Sex-specific Earnings on Sex Imbalance[J].The Quarterly Journal of Economics,2008(3):1251-1285
[10]. FAN Z Y, ZHANG H, CHEN J. The Spillover Effects of Public Transportation on Housing Market: A Case Study of Subway[J]. China Industrial Economics, 2018,(05):99-117.