


1. Introduction
Environmental, Social, and Governance (ESG) performance has become a cornerstone in evaluating corporate sustainability and its financial implications. As ESG factors gain traction among investors, businesses, and policymakers, their role in shaping corporate strategies and market dynamics continues to expand. ESG is no longer just a measure of ethical or sustainable practices but is increasingly recognized as a critical determinant of long-term financial performance, influencing risk management, valuation, and investment decisions.
The existing literature highlights a diverse range of perspectives on the financial impact of ESG. Stakeholder theory suggests that companies with robust ESG practices foster stronger relationships with stakeholders, which in turn enhances trust and stability in financial outcomes. On the other hand, slack resources theory posits that financial success provides firms with the means to invest in ESG initiatives, creating a virtuous cycle of improvement. Empirical studies have supported both perspectives, demonstrating that companies with high ESG scores often enjoy reduced risks, higher valuations, and improved profitability. However, the relationship is not without complexity, as sectoral and geographical variability, as well as trade-offs between financial and sustainability objectives, remain critical considerations.
Despite the growing interest, significant gaps persist in understanding the nuanced interactions between ESG factors and financial performance. Existing studies often lack comprehensive methodologies to capture nonlinear effects and dynamic relationships, particularly in developed markets where ESG practices are more mature. Furthermore, while traditional statistical models have been extensively employed, advanced machine learning techniques remain underutilized in this domain, limiting the ability to uncover hidden patterns and interactions.
To address these gaps, this study adopts a multidisciplinary approach, integrating statistical and machine learning methods such as Generalized Additive Models (GAM), Support Vector Regression (SVR), Random Forest, and XGBoost. By utilizing a dataset from Bloomberg that includes detailed ESG disclosures, financial indicators, and market performance metrics, this research aims to provide a robust and context-specific analysis of ESG's financial impact. The study not only evaluates the predictive power of these advanced models but also investigates the relative importance of key ESG variables in shaping financial outcomes.
This research contributes to the broader discourse on ESG integration by offering actionable insights for policymakers, investors, and corporate strategists. It underscores the need for a balanced approach that aligns sustainability goals with financial performance, particularly in developed markets where ESG practices are deeply embedded in corporate governance frameworks. By exploring the interplay between ESG factors and financial outcomes, this study seeks to inform strategies that enhance both economic and societal value.
2. Literature Review
The relationship between Environmental, Social, and Governance (ESG) performance and financial outcomes has been extensively studied, reflecting its growing importance in both academic and industry contexts. ESG factors are increasingly recognized as critical determinants of corporate sustainability and financial performance, influencing a range of outcomes from investment decisions to risk management and market valuation.
A key focus of recent literature has been the effect of ESG on financial performance, often explored through stakeholder theory and slack resources theory. Stakeholder theory posits that companies engaging in ESG practices enhance their relationships with stakeholders, building trust and improving long-term financial stability [1][2]. Slack resources theory, by contrast, suggests that financial performance enables firms to invest in ESG initiatives, as surplus resources provide the means for such engagement [3]. Empirical studies have provided evidence for both theories. For example, Giese et al. [4] demonstrated that companies with high ESG scores enjoy reduced risks, better valuations, and improved profitability, mediated through mechanisms such as the cash-flow channel, idiosyncratic risk channel, and valuation channel.
Despite these findings, the impact of ESG on financial performance is far from unequivocal. Studies in emerging markets, such as Yu et al.'s [5] investigation of BRICS countries, suggest that ESG commitments often lead to trade-offs. While firms with strong ESG performance prioritize income-driven projects, they may reduce investments in environmental initiatives, highlighting the complexity of aligning ESG goals with traditional financial objectives. Similarly, Xu et al. [3] found that ESG investments in China enhance green innovation but may also impose short-term financial burdens.
The role of ESG in risk mitigation has also received substantial attention. Governance and environmental performance are particularly impactful in reducing financial risks, as shown in studies on European firms [6]. These studies indicate that ESG disclosure improves transparency and reduces information asymmetry, fostering investor confidence. However, the costs of ESG compliance may offset these benefits, as reflected in lower financial returns for highly transparent firms [7].
The relationship between ESG ratings and portfolio performance is another area of active research. Esparcia and Gubareva [8] used wavelet analysis to examine the bidirectional relationships between ESG ratings and equity portfolio returns. They found strong positive correlations over long-term investment horizons, particularly for governance factors, but also identified transient negative effects for environmental ratings, reflecting the nuanced and context-dependent nature of ESG's financial impact.
The sectoral and geographical variability of ESG's effects further complicates its analysis. While governance factors are often the most significant across sectors, environmental performance plays a more prominent role in resource-intensive industries [9]. Emerging markets, with their unique regulatory environments and economic structures, offer additional challenges. In these contexts, ESG performance is not only a driver of financial stability but also a critical factor in shaping corporate governance and innovation strategies [3].
Innovation is increasingly recognized as a mediator of ESG's impact on financial performance. ESG factors amplify the effects of R&D investments, fostering green innovation and long-term growth[3]. However, this relationship is complex and context-dependent, with sectoral and geographical differences significantly influencing outcomes.
While the literature underscores the multifaceted role of ESG in financial performance, it also highlights several gaps and areas for further research. The trade-offs associated with ESG compliance, the sectoral and geographical variability of its effects, and its dynamic interactions with other financial and operational variables all warrant closer examination. This study aims to address some of these gaps by applying a range of statistical and machine learning methodologies, including Generalized Additive Models (GAM), Support Vector Regression (SVR), Random Forest, and XGBoost. By leveraging these advanced techniques, the study seeks to provide a nuanced understanding of ESG's impact on financial performance, offering valuable insights for both policymakers and corporate strategists. The findings are expected to contribute to the ongoing discourse on ESG integration, highlighting the need for context-specific strategies that balance financial and sustainability goals.
3. Data
The dataset used in this study was sourced from Bloomberg, providing a comprehensive and reliable basis for analyzing the relationship between ESG factors and financial performance. The dataset includes various financial and non-financial indicators, including returns, technical indicators, valuations, ESG disclosures, and other metrics that reflect a firm’s market performance and governance practices.
The returns data covers multiple time horizons, including year-to-date total return, one-month return, and one-year return, providing insights into both short-term and long-term market dynamics. Complementary technical indicators, such as the 14-day RSI, price deviations from 50-day and 200-day moving averages, and short interest days, capture momentum and trading behavior. Valuation measures, such as the price-to-earnings ratio, enterprise value-to-sales, and dividend yield, offer perspectives on firm valuation and investor expectations. ESG-specific variables, including the ESG Disclosure Score, greenhouse gas emissions (Scope 1 and 2), CEO duality, and board size, serve as the primary focus for assessing sustainability and governance practices. Additional metrics related to revenue growth, debt ratios, earnings estimates, and market capitalization provide further context for understanding firm performance.
To ensure the dataset’s reliability and suitability for analysis, a comprehensive cleaning process was undertaken. Columns with more than 50% missing values were excluded, and missing values in numerical variables were imputed using the median, ensuring data robustness. The resulting dataset was standardized to ensure comparability across variables and mitigate the effects of differing scales.
Principal Component Analysis (PCA) was employed to reduce the dimensionality of ESG-related variables, including the ESG Disclosure Score, greenhouse gas emissions, CEO duality, and board size. The PCA results revealed that the first principal component explained 33.68% of the variance, while the second component accounted for an additional 25.30%, resulting in a cumulative explained variance of 58.98%. The first principal component was selected as a composite ESG score, summarizing the multidimensional nature of ESG factors into a single interpretable index. The composite ESG score exhibited a range from -3.39 to 14.98, with a mean of 0.00 and a median of -0.21, suggesting a relatively symmetric distribution around the mean.
Higher-order features and interaction terms were constructed to capture potential nonlinear effects and synergistic relationships. Squared terms for key variables, such as the ESG score, greenhouse gas emissions, and board size, were created to explore quadratic influences. For example, the squared ESG score had a mean of 1.35, a median of 0.36, and a maximum of 224.39, reflecting significant variability in ESG performance across firms. Interaction terms, including ESG score × greenhouse gas emissions and ESG score × board size, were generated to investigate the joint effects of ESG factors and firm characteristics. The ESG score × greenhouse gas emissions term exhibited a wide range from -3,668,875 to \( 1.51×{10^{9}} \) , with a mean of 3,409,862, highlighting substantial heterogeneity in these interactions.
Descriptive statistics provide further insights into the constructed variables. For instance, the squared greenhouse gas emissions variable had a mean of \( 1.97×{10^{13}} \) and a median of \( 1.91×{10^{9}} \) , indicating significant disparities in emission levels among firms. The squared board size variable showed a mean of 90.13 and a median of 81.00, capturing variations in governance structures. Interaction terms, such as ESG score × board size, exhibited a mean of 1.74 and ranged from -21.70 to 179.76, suggesting notable but less pronounced effects compared to other interactions.
The final dataset, prepared after these preprocessing steps, contained no missing values and was fully standardized, providing a robust and structured foundation for subsequent analysis. The inclusion of the composite ESG score, higher-order features, and interaction terms enables a nuanced investigation into the complex relationships between ESG factors and financial performance, offering valuable insights into the role of sustainability and governance in developed financial markets.
4. Methodology
4.1. Generalized additive model
The Generalized Additive Model (GAM) was applied to explore the nonlinear relationships between ESG factors and financial performance, measured by Year-to-Date (YTD) Total Return. GAM is particularly suitable for this analysis due to its flexibility in modeling smooth, nonlinear relationships between predictors and the dependent variable while maintaining interpretability. By allowing the data to determine the shape of the relationship for each predictor, GAM avoids the restrictive assumptions of linearity.
The initial model incorporated 1,808 observations after merging and preprocessing. The response variable, YTD_Total_Return, was modeled as a function of ESG-related predictors, including ESG Score, GHG Emissions (Scope 1 and 2), Board Size, squared terms of ESG Score and GHG Emissions, and interaction terms such as ESG × GHG Emissions and ESG × Board Size. The model was specified as follows:
 (1)
(1)
where s () denotes a smooth function applied to each predictor to capture potential nonlinear effects.
Table 1: Summary of GAM
edf | Ref df | F Value | P Value | |
s(ESG_Score) s(GHG_Emissions_Scope1_2) s(Board_Size) s(ESG_Score_Squared) s(GHG_Squared) s(ESG_GHG_Interaction) s(ESG_Board_Interaction) | 2.837 1 1 1 1 1 1.932 | 3.865 1 1 1 1 1 2.441 | 0.013 0.009 0.013 0.005 1.495 0.754 1.557 | 1 0.923 0.909 0.944 0.222 0.385 0.267 |
\( {R^{2}}(adj) \) : 0.0317; Deviance explained = 3.69%; GCV = 14.133
Scale est. = 14.049 n = 1808
The summary of the full GAM model shown in Table 1 revealed that the intercept was highly significant (p<0.001), with an estimate of 1.148, indicating the baseline mean of YTD Total Return when the smooth effects of all predictors are zero. However, the majority of the smooth terms for the predictors failed to achieve statistical significance. ESG Score, for example, demonstrated some degree of nonlinearity, with an effective degrees of freedom (edf) of 2.837, but the associated ppp-value of 1.000 indicated no significant contribution to the model. Similarly, GHG Emissions, Board Size, and their squared and interaction terms displayed linear or near-linear behavior (edf ≈ 1) and were statistically insignificant, with ppp-values exceeding 0.05. These results suggest that, while nonlinear relationships were hypothesized, many predictors showed weak or no significant associations with financial performance.
The adjusted \( {R^{2}} \) of the full model was 0.0317, indicating that approximately 3.17% of the variance in YTD Total Return was explained by the predictors. The deviance explained was similarly low at 3.69%, highlighting the model's limited ability to account for variations in the response variable. These metrics suggest that the predictors, as modeled, only capture a small portion of the variability in financial performance.
Table 2: Summary of Simplified GAM
edf | Ref df | F Value | P Value | |
s(ESG_Score) s(GHG_Emissions_Scope1_2) | 5.114 1.243 | 6.299 1.368 | 8.959 0.188 | < \( 2{e^{-16}} \) 0.643 |
\( {R^{2}}(adj) \) : 0.0306 Deviance explained = 3.4% GCV = 14.123
Scale est. = 14.066 n = 1808
Given the limited significance of most predictors, a simplified GAM was constructed using only ESG Score and GHG Emissions as predictors. As shown in Table 2 the simplified model revealed that ESG Score had a significant and complex nonlinear effect on YTD Total Return (p<0.001), with an edf of 5.114, indicating a highly flexible smoothing function. In contrast, GHG Emissions remained insignificant (p=0.643), with an edf of 1.243, suggesting no meaningful contribution to financial performance. The adjusted \( {R^{2}} \) for the simplified model was 0.0306, with 3.4% of the deviance explained, reflecting only a marginal loss of explanatory power compared to the full model. These results reinforce the importance of ESG Score as a significant predictor and highlight the limited role of GHG Emissions in explaining YTD Total Return.
Figure 1 shows the visualizations of the GAM smoothing functions providing additional insights into the nature of the relationships between the predictors and the response variable. The smoothing function for ESG Score demonstrates a pronounced nonlinear effect, with fluctuations across its range suggesting varying contributions to financial performance. At low ESG Scores, the relationship appears weak or neutral, while higher ESG Scores exhibit increasing contributions to YTD Total Return. This nonlinear trend underscores the importance of incorporating flexibility into the model to capture such effects.
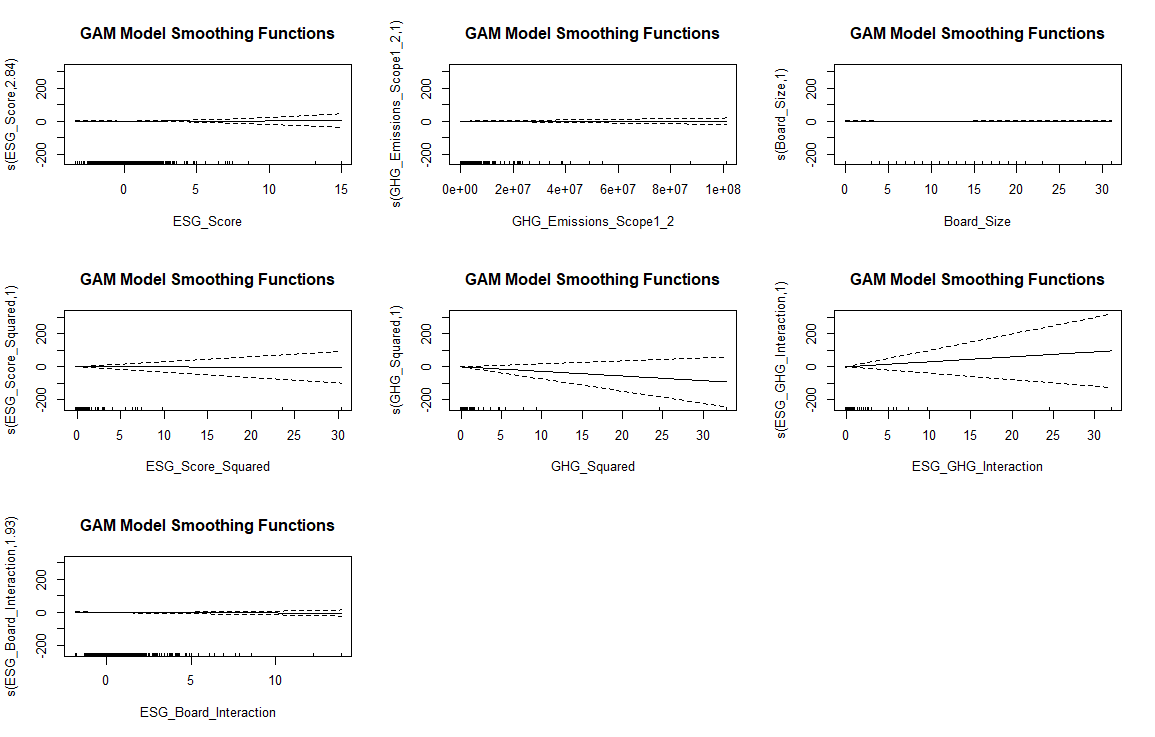
Figure 1: GAM Smoothing Functions.
In contrast, the smoothing function for GHG Emissions is nearly flat, indicating a lack of significant association with YTD Total Return. This flatness aligns with the statistical insignificance of the term in the model summary. The interaction terms, such as ESG × GHG Emissions, also exhibit weak and inconsistent trends, with smoothing functions that do not deviate meaningfully from zero. These visual patterns provide further evidence for excluding these terms in the simplified model.
The plot of actual versus predicted values for the full model reveals the model's limited predictive performance. Predicted values cluster around the mean, failing to capture the variability in observed returns. The red reference line (slope = 1) emphasizes the discrepancies between actual and predicted values, highlighting the model's inability to generalize effectively to the data.
In summary, the GAM analysis identified ESG Score as the most influential predictor of financial performance, with a significant and nonlinear relationship with YTD Total Return. Other predictors, including GHG Emissions and interaction terms, demonstrated limited explanatory power. The modest adjusted \( {R^{2}} \) values of both the full and simplified models suggest that ESG factors alone account for a small proportion of the variability in financial performance. These findings highlight the complexity of linking ESG metrics to financial outcomes and underscore the need for further investigation into additional drivers or alternative modeling approaches to better capture the observed variability.
4.2. Support Vector Regression
The application of the Support Vector Regression (SVR) model was motivated by the limitations observed in the Generalized Additive Model (GAM) results. While GAM provides interpretability and flexibility in modeling nonlinear relationships, its adjusted \( {R^{2}} \) of 0.0317 and deviance explained of 3.69% demonstrated that it struggled to effectively capture the variability in YTD Total Return. Furthermore, the GAM smoothing functions showed that ESG_Score had a nonlinear influence, but other predictors, such as GHG_Emissions_Scope1_2 and interaction terms, contributed minimally to the model. Given these findings, SVR was employed to address the potential complexity and nonlinearity in the relationships between ESG factors and financial performance that the GAM may have failed to capture.
SVR is particularly well-suited for this context as it uses a radial basis function (RBF) kernel to model complex, nonlinear relationships. The model balances bias and variance through hyperparameters such as the cost parameter (C) and epsilon (ϵ), making it robust to noise and capable of handling intricate data structures.
The dataset was divided into training (80%, 1,446 observations) and testing (20%, 362 observations) sets. Key predictors included ESG_Score, GHG_Emissions_Scope1_2, Market_Cap, and RSI_14_Days, selected for their relevance to financial and ESG performance. Standardization was performed on these features using the preProcess function to ensure that variables with different scales did not disproportionately influence the model.
The SVR model was trained with the following parameters:
• Kernel: Radial Basis Function (RBF), suitable for capturing complex nonlinearities.
• Cost (C): 1, controlling the trade-off between achieving a low error on the training set and minimizing model complexity.
• Epsilon (ϵ): 0.1, defining a margin within which predictions are considered acceptable even if they deviate slightly from the true values.
The model used 1,206 support vectors, which indicates that a significant portion of the training data contributed to defining the regression function. This reliance on support vectors reflects the data's complexity and the model's flexibility in capturing nuanced patterns.
The SVR model achieved a Mean Squared Error (MSE) of 17.124 and an R2R^2R2 of 0.164 on the test set, suggesting that it explained approximately 16.49% of the variance in YTD Total Return. While this \( {R^{2}} \) is modest, it is a significant improvement over the GAM's adjusted \( {R^{2}} \) of 0.0317. The lower MSE also indicates that the SVR model provided more accurate predictions compared to GAM.
The plot of actual versus predicted values for the SVR model reveals several important patterns. Predicted values are concentrated near the mean for lower values of YTD Total Return, indicating that the model performs well for observations within a certain range. However, as the actual values deviate further from the mean, the model's predictions increasingly diverge from the reference line (y=x), suggesting that the SVR model struggles with extreme values or outliers. This behavior is typical of SVR, where the reliance on support vectors limits the model's ability to generalize beyond the observed data distribution.
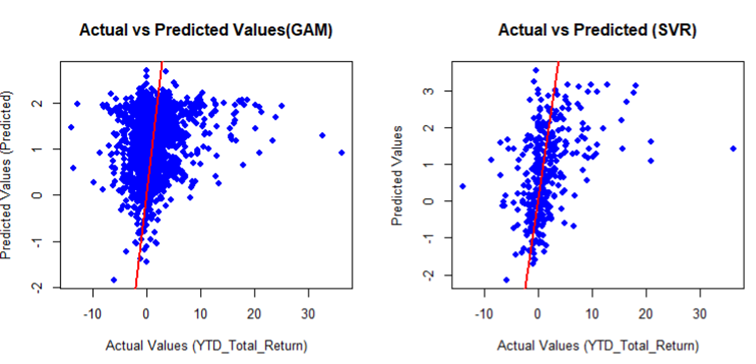
Figure 2: Prediction of GAM and SVR.
According to Figure 2, comparing the SVR plot to the GAM plot, the SVR model demonstrates better alignment with the reference line for most observations, particularly near the center of the distribution. In contrast, the GAM predictions exhibit a wider spread around the reference line, indicating lower predictive accuracy. However, the GAM smoothing functions provided greater insight into the relationships between individual predictors and YTD Total Return, showing, for instance, the nonlinear effect of ESG_Score.
The GAM smoothing functions highlighted that ESG_Score had a nonlinear impact on YTD Total Return, with its influence fluctuating across different score ranges. However, other predictors, such as GHG_Emissions_Scope1_2 and interaction terms, contributed minimally, as evidenced by their nearly flat smoothing functions. The SVR model, on the other hand, demonstrated improved predictive accuracy but did not provide explicit information about the relationships between predictors and the response variable. Instead, it modeled these relationships implicitly through the RBF kernel.
The actual versus predicted plots for the GAM and SVR models further illustrate these differences. In the GAM plot, the spread of predicted values around the reference line is more pronounced, reflecting the model's inability to accurately predict YTD Total Return for many observations. Conversely, the SVR plot shows tighter clustering of predicted values near the reference line for observations with lower YTD Total Return, indicating better predictive performance in this range. However, the SVR's reliance on support vectors leads to less accurate predictions for extreme values, as seen in the deviations from the reference line for higher and lower actual values.
The comparison between GAM and SVR highlights the trade-offs between interpretability and predictive power. The GAM model provided detailed insights into the nonlinear effects of ESG_Score but struggled to capture the overall variance in YTD Total Return, as indicated by its low adjusted \( {R^{2}} \) . In contrast, the SVR model achieved better predictive performance, with a higher \( {R^{2}} \) and lower MSE, but lacked the transparency of the GAM model regarding the specific contributions of individual predictors.
These results suggest that while SVR is better suited for prediction in this context, GAM remains valuable for exploratory analysis and hypothesis generation. Combining the strengths of these models, such as using GAM for variable selection and SVR for prediction, could provide a more comprehensive approach to analyzing the impact of ESG factors on financial performance.
4.3. Random Forest and XGBoost
The Random Forest and XGBoost models were employed to evaluate the importance of ESG factors and optimize predictive performance for YTD Total Return. These ensemble methods are particularly well-suited for handling nonlinear relationships and interactions among variables, offering insights into both predictive accuracy and the relative contribution of individual features.
The Random Forest model was constructed using 500 decision trees. Each tree was built on bootstrapped samples of the training data, with one variable randomly selected at each split to reduce correlation among trees. The model achieved a mean squared error (MSE) of 15.71 and an \( {R^{2}} \) value of 0.198, indicating that it explained 19.8% of the variance in YTD Total Return. These results demonstrate that Random Forest outperformed the previously applied GAM and SVR models in terms of predictive power. Feature importance was assessed using two metrics: the percentage increase in mean squared error (%IncMSE) and the total reduction in node impurity (IncNodePurity). Both metrics indicated that RSI_14_Days was the most influential predictor, with %IncMSE of 42.33% and an IncNodePurity of 6,138.39. ESG_Score ranked second in importance, followed by Market_Cap and GHG_Emissions_Scope1_2. These results underscore the significance of technical indicators and ESG performance in explaining financial returns.
The XGBoost model was trained using gradient boosting, a technique that iteratively minimizes the residual errors of prior trees. The model incorporated hyperparameters optimized for predictive accuracy, including a learning rate (eta) of 0.1, a maximum tree depth of 6, and subsampling and column sampling ratios of 0.8. The model was trained for 38 iterations, with early stopping applied based on test set performance. The final model achieved an MSE of 16.25 and an \( {R^{2}} \) value of 0.169, explaining 16.9% of the variance in YTD Total Return. Feature importance in XGBoost was evaluated based on Gain, which measures the improvement in accuracy attributed to each feature. RSI_14_Days emerged as the most important predictor with a Gain of 45.65%, followed by ESG_Score (24.05%), Market_Cap (20.87%), and GHG_Emissions_Scope1_2 (9.44%). These results were consistent with the Random Forest analysis, reaffirming the dominant role of RSI_14_Days in predicting YTD Total Return.
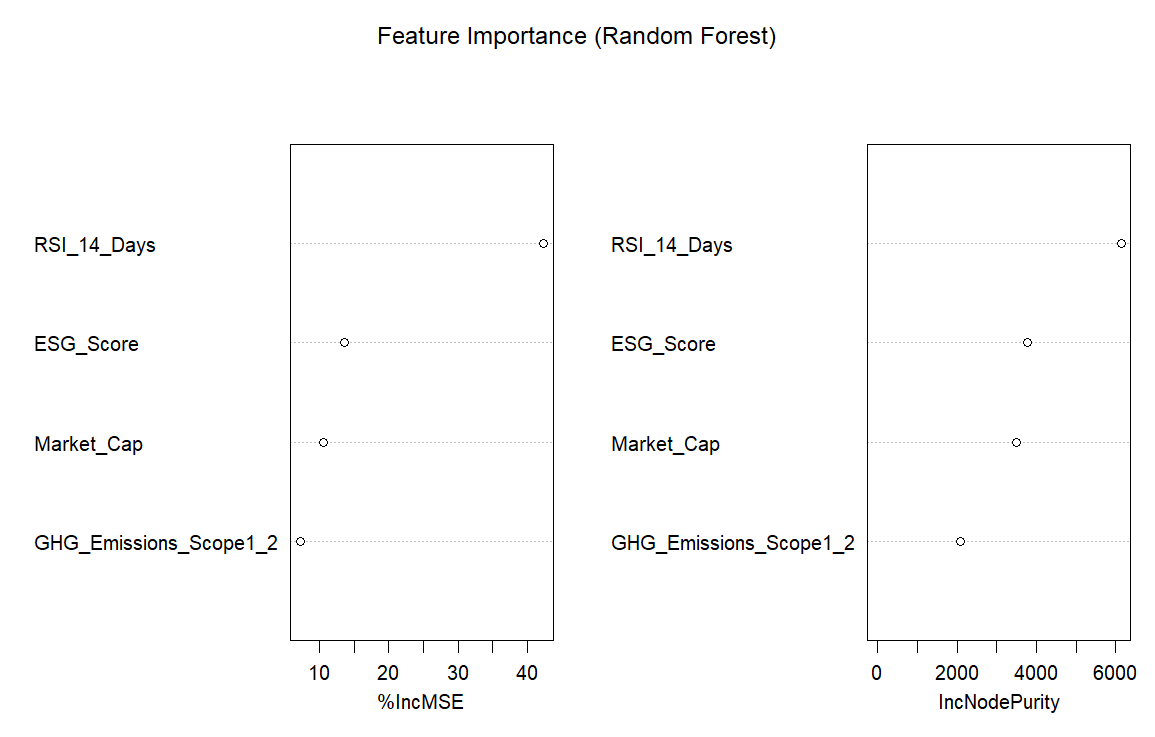
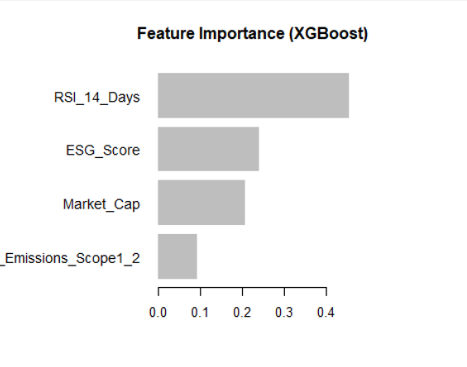
Figure 3: Feature Importance of Random Forest and XGBoost
As shown in Figure 3 , the feature importance visualizations from both models further highlight the consistency in their results. In the Random Forest model, RSI_14_Days showed the highest %IncMSE and IncNodePurity, indicating its strong influence on reducing prediction errors and improving model accuracy. Similarly, in the XGBoost model, RSI_14_Days exhibited the largest Gain, demonstrating its substantial contribution to improving predictive performance. ESG_Score ranked second in importance across both models, emphasizing the relevance of ESG performance in explaining financial returns. Market_Cap also contributed meaningfully to the models, while GHG_Emissions_Scope1_2 showed relatively low importance, suggesting that greenhouse gas emissions have a limited direct impact on YTD Total Return in this dataset.
When comparing Random Forest and XGBoost to the previously applied GAM and SVR models, several differences emerge. The GAM model, while providing valuable insights into the nonlinear effects of ESG_Score, had limited predictive accuracy, with an adjusted \( {R^{2}} \) of 0.0317 and an MSE of 14.13. The smoothing functions in GAM revealed that ESG_Score exhibited a nonlinear influence on YTD Total Return, while other predictors contributed minimally. The SVR model improved upon GAM in terms of predictive accuracy, achieving an \( {R^{2}} \) of 0.164 and an MSE of 17.12, but it struggled to generalize for extreme values, as evident from the deviations in the actual versus predicted plot. In contrast, Random Forest and XGBoost demonstrated superior predictive performance, with Random Forest achieving the highest \( {R^{2}} \) value of 0.198 and the lowest MSE of 15.71. Both models also provided clear and interpretable metrics for feature importance, which were consistent across methods.
The feature importance analysis underscores the dominant role of RSI_14_Days, a technical indicator, in predicting YTD Total Return. ESG_Score consistently ranked as the second most important predictor, highlighting the relevance of ESG performance in financial markets. Market_Cap contributed moderately to the models, reflecting the influence of firm size on returns. However, GHG_Emissions_Scope1_2 showed limited importance, suggesting that carbon emissions have a weaker association with financial performance in this dataset.
Based on the results, the Random Forest model emerges as the most suitable for predicting financial performance, offering the best balance between predictive accuracy and interpretability. With its \( {R^{2}} \) of 0.198 and MSE of 15.71, it outperforms XGBoost while requiring less parameter tuning and computational resources. Although XGBoost offers competitive performance, its marginally lower \( {R^{2}} \) and higher MSE, combined with its sensitivity to hyperparameters, make it less practical in this context. GAM remains valuable for exploratory analysis and understanding nonlinear effects, while SVR provides moderate predictive performance but lacks transparency. Overall, Random Forest is recommended for its robustness, ease of use, and ability to capture complex relationships between ESG factors and financial returns.
5. Conclusion
This study provides a comprehensive analysis of the relationship between Environmental, Social, and Governance (ESG) performance and financial outcomes in developed markets, utilizing advanced statistical and machine learning techniques. By leveraging models such as Generalized Additive Models (GAM), Support Vector Regression (SVR), Random Forest, and XGBoost, the research explores the complexities and nuances of ESG factors and their impact on Year-to-Date (YTD) Total Return.
The findings indicate that ESG factors, particularly the composite ESG Score, play a significant role in influencing financial performance. The GAM results reveal a pronounced nonlinear relationship between ESG Score and YTD Total Return, highlighting that firms with higher ESG Scores tend to achieve better financial outcomes. However, the explanatory power of ESG factors alone is limited, as evidenced by the modest adjusted \( {R^{2}} \) values and the low percentage of variance explained in the GAM models. GHG emissions, board size, and interaction terms, while hypothesized to contribute meaningfully, showed minimal significance, further emphasizing the context-dependent nature of ESG impacts.
Machine learning models, particularly Random Forest and XGBoost, outperform traditional statistical approaches in terms of predictive accuracy. Random Forest, with its ensemble-based approach and ability to capture complex relationships, achieves the highest \( {R^{2}} \) (0.198) and the lowest Mean Squared Error (MSE) (15.71), making it the most robust model in this analysis. XGBoost offers competitive performance, with an \( {R^{2}} \) of 0.169, but its sensitivity to hyperparameters and slightly lower predictive power render it less optimal compared to Random Forest. SVR provides moderate improvement over GAM but struggles with extreme values and lacks the transparency necessary for interpretability.
Feature importance analysis underscores the pivotal role of technical indicators, such as RSI_14_Days, in driving financial outcomes, with ESG Score consistently ranked as the second most influential predictor across models. This finding suggests that while ESG considerations are important, other market-driven factors remain dominant in shaping financial performance. The limited significance of GHG emissions in this study points to sectoral differences and the possibility that carbon emissions may have a more pronounced impact in resource-intensive or emerging markets.
The comparative evaluation of models highlights the trade-offs between interpretability and predictive performance. While GAM provides detailed insights into the nature of nonlinear relationships, its limited predictive power restricts its practical application. Random Forest strikes an ideal balance by offering both interpretability through feature importance metrics and superior predictive accuracy. This makes it a valuable tool for policymakers, investors, and corporate strategists seeking to integrate ESG factors into decision-making processes.
These results contribute to the ongoing discourse on the financial implications of ESG performance, emphasizing the need for context-specific approaches that align sustainability goals with financial objectives. Future research could expand upon these findings by incorporating additional variables, such as sector-specific ESG factors or regional economic conditions, to better capture the heterogeneity of ESG impacts. Furthermore, applying these methodologies to emerging markets could provide valuable insights into the unique challenges and opportunities presented by ESG integration in these contexts.
In conclusion, this study reaffirms the importance of ESG performance in shaping financial outcomes while acknowledging the limitations and complexities inherent in its analysis. By demonstrating the utility of advanced modeling techniques, it offers a robust framework for understanding and leveraging the financial implications of ESG factors in developed markets.
References
[1]. Freeman, R. E. (2010). Strategic management: A stakeholder approach. Cambridge University Press.
[2]. Waddock, S. A., & Graves, S. B. (1997). The corporate social performance–financial performance link. Strategic Management Journal, 18(4), 303–319.
[3]. Xu, J., Liu, F., & Shang, Y. (2021). R&D investment, ESG performance, and green innovation performance: Evidence from China. Kybernetes, 50(3), 737–756.
[4]. Giese, G., Lee, L.-E., Melas, D., Nagy, Z., & Nishikawa, L. (2019). Foundations of ESG investing: How ESG affects equity valuation, risk, and performance. The Journal of Portfolio Management, 45(5), 69–87.
[5]. Yu, Z., Farooq, U., Alam, M. M., & Dai, J. (2024). How does environmental, social, and governance (ESG) performance determine investment mix? Borsa Istanbul Review, 24(4), 520–529.
[6]. Chouaibi, J., Benmansour, H., Ben Fatma, H., & Zouari-Hadiji, R. (2024). Does ESG performance affect financial risk disclosure? Competitiveness Review, 34(6), 1057–1076.
[7]. Mandas, M., Lahmar, O., Piras, L., & De Lisa, R. (2024). ESG reputational risk and market valuation: Evidence from the European banking industry. Research in International Business and Finance, 69, 102286.
[8]. Esparcia, C., & Gubareva, M. (2024). ESG rating changes and portfolio returns: A wavelet analysis across market caps. Finance Research Letters, 63(1), 105306.
[9]. Tang, Y., Qiao, X., & Chen, H. (2024). ESG performance and investment expansion: Evidence from Chinese listed firms. Finance Research Letters, 69, 106072.
Cite this article
Li,Y. (2025). Evaluating the Financial Impact of ESG Performance in Developed Markets: Insights from Advanced Machine Learning and Statistical Models. Advances in Economics, Management and Political Sciences,166,90-100.
Data availability
The datasets used and/or analyzed during the current study will be available from the authors upon reasonable request.
Disclaimer/Publisher's Note
The statements, opinions and data contained in all publications are solely those of the individual author(s) and contributor(s) and not of EWA Publishing and/or the editor(s). EWA Publishing and/or the editor(s) disclaim responsibility for any injury to people or property resulting from any ideas, methods, instructions or products referred to in the content.
About volume
Volume title: Proceedings of the 4th International Conference on Business and Policy Studies
© 2024 by the author(s). Licensee EWA Publishing, Oxford, UK. This article is an open access article distributed under the terms and
conditions of the Creative Commons Attribution (CC BY) license. Authors who
publish this series agree to the following terms:
1. Authors retain copyright and grant the series right of first publication with the work simultaneously licensed under a Creative Commons
Attribution License that allows others to share the work with an acknowledgment of the work's authorship and initial publication in this
series.
2. Authors are able to enter into separate, additional contractual arrangements for the non-exclusive distribution of the series's published
version of the work (e.g., post it to an institutional repository or publish it in a book), with an acknowledgment of its initial
publication in this series.
3. Authors are permitted and encouraged to post their work online (e.g., in institutional repositories or on their website) prior to and
during the submission process, as it can lead to productive exchanges, as well as earlier and greater citation of published work (See
Open access policy for details).
References
[1]. Freeman, R. E. (2010). Strategic management: A stakeholder approach. Cambridge University Press.
[2]. Waddock, S. A., & Graves, S. B. (1997). The corporate social performance–financial performance link. Strategic Management Journal, 18(4), 303–319.
[3]. Xu, J., Liu, F., & Shang, Y. (2021). R&D investment, ESG performance, and green innovation performance: Evidence from China. Kybernetes, 50(3), 737–756.
[4]. Giese, G., Lee, L.-E., Melas, D., Nagy, Z., & Nishikawa, L. (2019). Foundations of ESG investing: How ESG affects equity valuation, risk, and performance. The Journal of Portfolio Management, 45(5), 69–87.
[5]. Yu, Z., Farooq, U., Alam, M. M., & Dai, J. (2024). How does environmental, social, and governance (ESG) performance determine investment mix? Borsa Istanbul Review, 24(4), 520–529.
[6]. Chouaibi, J., Benmansour, H., Ben Fatma, H., & Zouari-Hadiji, R. (2024). Does ESG performance affect financial risk disclosure? Competitiveness Review, 34(6), 1057–1076.
[7]. Mandas, M., Lahmar, O., Piras, L., & De Lisa, R. (2024). ESG reputational risk and market valuation: Evidence from the European banking industry. Research in International Business and Finance, 69, 102286.
[8]. Esparcia, C., & Gubareva, M. (2024). ESG rating changes and portfolio returns: A wavelet analysis across market caps. Finance Research Letters, 63(1), 105306.
[9]. Tang, Y., Qiao, X., & Chen, H. (2024). ESG performance and investment expansion: Evidence from Chinese listed firms. Finance Research Letters, 69, 106072.