


1. Introduction
For investors contemplating investments, many different getting-started techniques are included in the financial analysts' toolkit to analyze profitability and risks. This study explores the area germane to technology startups that encompasses a high growth rate coupled with the existence of elevated risks because of instability, exponential technological advancement, and consumer preference change. Precise financial prediction in this field is the key, but discussions regarding the most suitable model for the trial remain unresolved. Conventional appraisal technique, for example, Net Present Value (NPV), Internal Rate of Return (IRR), and Payback period, all have their pros and cons. Although NPV assumes that money has a time value, its reaffirmed relevance as such on technology-based startups is still lapsed.
Due to the fact that the market for travel and short-term rental properties is dynamic and competitive, leading companies like Airbnb and Booking.com have managed to become market leaders by creating and following novel business plans. Airbnb's model as a decentralized platform for short-term rentals and Booking.com as a more traditional travel agency demonstrates how financial mechanics may change even within the same sector. This paper makes use of the financial data of these companies to explore the degree to which various investment appraisal tools, both traditional and emerging, like NPV, are applicable to the high-growth technology-based businesses. A tool such as IRR or Payback Period gives invaluable information; unfortunately, if decisions are made only on these indicators, the investors might look with disappointment at their investments. Our study will involve testing NPV as a superior investment appraisal technique to others in predicting the financial success of technology startups. The main object will be introduced in the second pretext of this paper by a review of investment evaluation methods and the limitations of their use. Section 3 will emphasize on data collection, processing, and the method applied for analyzing. Section 4 talks about the NPV and other techniques of research and discussion of the results. Lastly, Section 5 presents the implications of the findings for technology startups with suggestions for subsequent investigations.
2. Literature review
2.1. NPV and IRR as investment tools
In this section, the NPV technique and IRR formula are discussed as they are used for appraising and making investment project choices. The NPV approach involves the discounting of future net cash flows to present values and then the finding of the difference between the two in order to make a NPV analysis of the project. If a project has a positive NPV, it is worthwhile to invest in it, while if it has a negative NPV, it is not [1]. At the IRR, a project's NPV is equal to zero, meaning the project's profit potential can be measured. The use of NPV and IRR formulas helps a company to make concrete investment decisions by combining them with market conditions, economic forecasts, and funds available. Emerging enterprises should strengthen risk management skills that will enable them to deal with the introduction of new technology. Apart from doing NPV in the traditional way, startups should take into consideration such risks of project implementation like market technical risks and users' risks [2]. These risk factors can be measured by the NPVR to provide a more comprehensive assessment of project value. NPVR can help company decision makers understand and manage project uncertainty and potential investment issues by assessing risks and potential returns in a high risk or uncertain investment environment. In addition to the risk-adjusted net value, the risks in the enterprise operating environment, including financial risk, operational risk and image risk, can be identified and assessed through EREV. NPVR and EREV have some relevance to traditional NPV, and these two assessment systems add deeper analytical tools to higher-risk and highly uncertain decision environments by adding risk-adjustment elements [3]. For example, in the wake of the 2008 financial crisis, uncertainty in the financial markets increased, making it more difficult for startups to develop and innovate in an environment of high financial uncertainty. Among the uncertainties for tech startups were: the freezing of the credit markets, where financial institutions significantly tightened lending standards due to liquidity constraints, making it difficult for startups to obtain funding; reduced investor confidence in startups, which resulted in the loss of some of their sources of access to capital; simultaneous and significant fluctuations in market demand; and disruptions in the supply chain of materials, leading to higher costs, as well as a partial paralysis of government. Problems with regulatory measures increase operating costs. For the npv model, cash flow forecasts can fluctuate significantly, leading to uncertainty in revenue forecasts, while rising costs make forecasting difficult. Rising risk premiums and fluctuating financing costs can also lead to changes in the discount rate, creating uncertainty. To cope with these high uncertainties, startups can conduct scenario analysis, stress testing, constructing multiple economic scenarios to help you, such as recession, slow recovery or rapid recovery to assess the performance of the npv, while simulating the impact of large adjustments in key variables on the npv under the stress test to assess the feasibility of the model, while dynamically adjusting the discount rate, applying different discount rates based on market analysis, and phasing in the discount rate. react to changes in the model. At the same time, risk management is introduced and ranpv is introduced to enhance the sensitivity of the model to uncertainty.
2.2. NPV/IRR model’s limitation
During our investigation, we discovered that some papers are trying to prove that NPV cannot be an important decision factor. In Nwogugu, Michael C. I., paper, “Anomalies in net present value, returns and polynomials, and regret theory in decision-making,” he demonstrates that some widely used theories and models such as the Fourier -Boudin's theorem, Cartesian law of symbols, Sturm's theorem, Vincent's theorem, and the Fundamental Theorem of Algebra, suffer from an over-reliance on inaccurate data. This reliance on inaccurate data can lead to misleading conclusions in complex financial modeling applications. When there is uncertainty in the data, the sensitivity of the model to the input data increases, leading to unstable and unreliable output results. For example, in practical applications, measurement errors, inaccurate estimation of data, and the volatility of the data itself can directly affect the model's calculations, which in turn affects the accuracy of decisions.
For example, although the NPV-IRR model has been widely used in theory for capital budgeting and investment appraisal, in practice it inherently suffers from several problems, such as framing effects, non-monotonic NPV, and compounding anomalies, which are essentially due to the model's overdependence on the input data, which seriously affects the accuracy and reliability of the model. Data uncertainty plays a magnifying role in these problems. Data uncertainty can be one of the most significant factors affecting the output of the NPV model, especially in tech, an industry where cash flows and discount rates are not definite. For instance, if during volatile periods in the market the cash flow prediction being sensitive, the NPV calculation would be sensitive to the model output, too, which may be volatile. This fact allows making conclusion that the NPV accounting is sensitivity analysis a must, so it might help us simulate project performance under different market conditions and thus define more realistic values. For example, input data such as cash flows and discount rates that are subject to measurement error or inaccurate estimation can directly lead to inconsistent NPV and IRR results. This uncertainty makes it possible for the same data to produce conflicting decision recommendations under different treatments, further undermining the utility of the model.
In his study, NPV and IRR results were often inconsistent. Despite the introduction of so-called “new” methods, such as MIRR, AROI, AIRR, etc., in an attempt to solve these problems, these methods are still unable to completely overcome the limitations of the original model under data uncertainty. This shows that the fundamental problem lies in the data uncertainty, not only in the optimization of the model structure [4]. Despite advances in financial theory and practice, finding a model that is both accurate and universally applicable remains a pressing challenge. Data uncertainty not only leads to inconsistencies in the results of existing models but also exacerbates the inherent flaws of the models themselves, making it difficult to fundamentally solve the problem even with the introduction of new methods.
Therefore, future research should pay more attention to the inherent flaws of these models, especially their high dependence on data accuracy, and explore more accurate and practical alternatives. Improving data quality, reducing data uncertainty, or developing models that can better cope with data uncertainty are all important topics that need to be urgently addressed in future research and practice.
3. Methodology
3.1. Data collection and preparation
In our study, we will combine case analysis with statistical methods to compare the advantages and disadvantages of NPV, IRR, and Payback Period. In the case analysis, we will mainly focus on Airbnb and Booking.com. For the follow-up regression study, we will select several technology startups as research subjects and expand the research period to ensure sufficient data coverage cycle [5]. We will use indicators of the growth of the startup such as the next revenue growth, profitability, and market capitalization as dependent variables while using NPV, IRR, and Payback Period as independent variables to assess the impact of investment evaluation metrics.
Our aim is to assess the impact of these investment evaluation metrics on a startup's financial success by analyzing the significance of the regression coefficients [6]. This will help determine which investment decision-making method can better aid investors in improving decision efficiency. Financial statements will be the source of historical equity cash flow (i.e. FCFF) and investments amounts of each company or professional financial databases such as Bloomberg and FactSet among others will be used to extract the details of companies.
In addition and to ensure robust results, we plan to perform sensitivity tests in order to find out how sensitivities of assumptions such as market premium and discount rates influence the NPV, IRR, and payback period computations. These analyses will ensure a comprehensive understanding of the most important risk factors seeking investors' attention when making financial investments in technology startups is concerned.
3.2. NPV model
3.2.1. NPV overview and other factors
Net Present Value (NPV): When we determine the net present value for a company, we use the discounted cash flow model. This entails discounting future cash flows to the present value, which helps in the evaluation of the investment project. Net present value is the sum of the cash inflow and outflow at the beginning of maturity. In the case of investment, net present value essentially refers to the use of the investment [7].
Dynamic NPV stands for the discounting of cash flows at periodically changing discount rates and is thus suitable for particularly agile and volatile markets, such as technology start-ups. This leads to a flexible discount rate that can be used to more correctly assess the NPV subject to any market variation and the uncertainty of the future cash flows from the project.
The net value obtained after deducting the present value of the initial investment funds from the discounted sum of all the benefits obtained during the implementation period. For the decision maker of the project scheme, when the project NPV is greater than or equal to 0, the scheme can be considered, and when the NPV is less than 0, that is, a negative number, it is theoretically recommended not to consider the scheme.
Additionally, NPV has the advantage of incorporating the time value of money, making it more reliable for long-term project evaluation. However, it is important to note that NPV calculations rely heavily on accurate forecasting of future cash flows and appropriate discount rates, which are subject to market volatility and uncertainties, particularly for technology startups operating in unpredictable markets.
The actual rate of return of the project: When the sum of cash flows at all stages of an investment project is 0 (that is, NPV is 0), the corresponding discount rate is called the internal reporting rate of the project. Implied rate of return is a relative number indicator, usually in the form of a percentage, when the IRR value is greater than or equal to the benchmark rate of return i, indicating that the project can be considered, its expected rate of return is greater than or just meet the benchmark rate of return, the project profitability is good [8].
1. Net Present Value (NPV): While NPV provides a clear picture of the value created by an investment, it relies heavily on accurate future cash flow projections and an appropriate discount rate. In volatile industries, these projections can be highly uncertain.
2. Internal Rate of Return (IRR): IRR can be misleading when used in isolation, as it assumes that interim cash flows are reinvested at the IRR itself, which may not be realistic. Additionally, multiple IRRs can exist for projects with alternating cash flows.
3. Payback Period: The payback period does not consider the time value of money or cash flows beyond the payback period, which can lead to suboptimal decision-making, particularly for long-term projects.
In the context of Airbnb and Booking.com, these limitations highlight the need for a combined approach using multiple metrics to capture different aspects of financial performance.
Internal rate of Return (IRR) : This refers to the discount rate when the internal rate of return of each company is calculated, even if the net present value is equal to zero. Internal rate of return (IRR), also known as internal rate of return, reflects investment
The actual rate of return of the project. When the sum of cash flows at all stages of an investment project is 0 (that is, NPV is 0), the corresponding discount rate is called the internal reporting rate of the project. Implied rate of return is a relative number indicator, usually in the form of a percentage, when the IRR value is greater than or equal to the benchmark rate of return i, indicating that the project can be considered, its expected rate of return is greater than or just meet the benchmark rate of return, the project profitability is good [9].
Other evaluation techniques: We mainly consider the payback period here to compare with the other indicators above. The payback period refers to the time required for the total income obtained after the investment project is put into operation to reach the total investment invested in the investment project. The payback period can be calculated in various ways. (2)According to the different starting time of investment recovery, there are two kinds of calculation from the date of project operation and from the date of investment use; According to the different subjects of investment recovery, there are social investment recovery period and enterprise investment recovery period; According to the income composition of recovery investment, there are profit recovery investment period and income recovery investment period. Let's consider the payback period of the project.
3.2.2. Model assumptions
In our calculations, several key assumptions were made to ensure a consistent and comparable analysis. These assumptions include:
1. Discount Rate: We assumed that the 10% discount rate was the most appropriate value, given the average long-term equity return for technology startups. This value depicts the risk-adjusted anticipated return demanded by the funders.
2. Growth Rate: Cash flows in the future are projected to increase at a 5% growth rate with a hopeful cautious perspective on both the potential for ventures that have just started and the associated uncertainties in new markets.
3. Market Risk Premium: The market risk premium was determined to be 6%, which was informed by historical data and industry standards in order to factor in the positive returns that investors expect in exchange for taking high risk.
The chosen input assumptions were based on the observations from the historical performance data of the industry, reports from the respective analysts, and professional opinions. These parameters were chosen as a result of the monitoring of the tech sector on average for five years, as the data was affected by fluctuations in this high-risk industry. It also implies that we can find the best possible risk-to-return ratio while assessing the projects. Besides, application of these assumptions to real business does not only consider their effects on overall economy and industry specifics but has to include the influences of technological forward and backward links in the value chains, as well as of regulations and policies, such as tariffs, subsidies, standards, and others. This also helps us form a realistic basis for our assessment. Moreover, we took into consideration the role of macroeconomic conditions and progress in tech development in this industry. The former, underappreciated as they are when it comes to valuation, can have an enormous impact in both the growth curve and the market value of pioneering technology firms [9]. Such circumstances, including economic recessions or rapid changes in the preferences of consumers in the technology sectors, could tremendously twist the anticipated cash flows and the additional risk charge investors would require. As for the calculation of the NPV for Airbnb and Booking.com, we were not limited to including financial metrics and also included other components, for instance, the effects of sharing economy regulations and the tourism sector on future cash flow projections. In this way, we are able to capture a much broader picture of the investment risk and yield scenario, especially in industries of innovating regulatory frameworks.
3.2.3. NPV calculation process
In this section, we will analyze the company further, employing investment assessment ratios like NPV, IRR, or Payback Period. We will look at the extent to which these ratios have impacted financial decision-making and business expansion. Major financial figures, such as past cash flow calculated as FCFF and investment activities, will be sourced from the company's own financial statement and from specific real-time financial databases, namely Bloomberg and FactSet. The "Net Increase/Decrease in Cash" (Net Increase/Decrease in Cash) and the NPV dynamically calculated in Table 2 rely on FCFF and capital expenditure line items reported in the company's financial statements. This kind of data stems from the online quotes systems of big firms, like Bloomberg or FactSet. While calculating net cash as the annual assessing of cash inflows and outflows, Dynamic NPV, as the present value of future cash inflows discounted by a rate, will be completed. With an aim to show the application and feasibility of each investment appraisal tool in the real world, we are going to assess Airbnb's financial performance and its investment decisions. Not only will the study reveal how tools can be used effectively during practical cases, but it also provides insights into how rules might work in the latter. Aside from financial figures, we will also reflect on the risk that Airbnb's business model - decentralization - exposes it to variance amid market conditions and customer behaviors [10]. Likewise, it will be shown that this is a potential risk Booking.com faces, stemming from its dependence upon professional accommodation providers, and whether it will have an edge over Airbnb in its strategic positioning. Our goal, by incorporating qualitative variables in our analysis, is to present a greater insight into the applicability of NPV, IRR, and Payback Period within fast-changing and complex industries.
3.2.4. AIRBNB
We first get the Required rate of return on Airbnb Inc.
|
Assumptions |
||
|
Rate of return on LT Treasury Composite |
R(F) |
4.54% |
|
Expected rate of return on market portfolio |
E[R(M)] |
13.72% |
|
Systematic risk of Airbnb Inc. common stock |
β(ABNB) |
1.24 |
|
Required rate of return on Airbnb Inc. common stock |
r(ABNB) |
15.97% |
rABNB = RF + βABNB [E(RM) – RF]
= 4.54% + 1.24 [13.72% – 4.54%]
= 15.97%
We can then get the ROC of the company
|
Dec31,2023 |
Dec31,2022 |
Dec31,2021 |
Dec31,2020 |
|
|
Selected Financial Data (US$ in millions) |
||||
|
Net operating profit after tax (NOPAT) |
1,681 |
2,070 |
465 |
(4675) |
|
Invested capital |
5,829 |
6,849 |
5,836 |
4,764 |
|
Performance Ratio |
||||
|
ROIC |
28.83% |
30.22% |
7.96% |
-98.14% |
|
ROIC, Competitors |
||||
|
Booking, Holding INC |
32.92% |
21.73% |
4.47% |
4.60% |
|
Chipote Mexican Grill Inc |
23.36% |
19.01% |
14.35% |
12.43% |
|
McDonald’s Crop |
18.51% |
15.69% |
17.77% |
13.16% |
|
Starbucks Corp |
20.76% |
18.24% |
19.35% |
6.42% |
Airbnb's Net Present Value (NPV) shows an extremely volatile trend year by year from given data of 2000-2023. In 2006, the NPV peaked at 343.2360 and then plummeted to -1671.3860 in 2015. The periods of negative NPV that happened during these years specify the unfavorable investment conditions and inefficiently capital manage by the firm. During the years like 2015, it is better for the investors and managers not to make large capital investments. It can be said that, from an investor's standpoint, the success of NPV in the long run is the guideline for assessing the financial situation of the company and its steady growth of profitability. The next step is a deeper investigation of Airbnb's financial data, which is 'the ROIC swings' through years. To take an instance, since the ROIC was -98.14% in 2020, it pointed to a high degree of capital returns' loss during the year. Nevertheless, with a recovery in the market, which resulted in 7.96% of ROIC being reported in 2021 and rising further to 28.83% in 2023. The variation indicates that the capital return power of the Airbnb is not stable and its performance goes down during particular economic downturns, so it is a good practice for investors to pick the right moment to invest and avoid capital mismanagement consequences. Moreover, we can notice huge differences in cash flow of Airbnb during the years of 2009 to 2014. To demonstrate this, in 2009, cash was down to 162.4090. In 2010, the cash was up to 156.8260, thus in 2014 it was up to 1858.6570. Such large variability is not only centered at the company's present operational ability but also affects future capital planning. By integrating the cash flow factors with the analysis of Airbnb's NPV and ROIC, an investor is able to obtain a generalized knowledge about capital and cash flow processes of the company, which ensures them to make more reasonable investments.
|
FY Dec |
NetIncrease(Decrease)inCashandEquivalent-47.3590 |
dynamicnpv-41.6672 |
|
2000A |
-47.3590 |
-41.6672 |
|
2001A |
22.9190 |
177.4168 |
|
2002A |
-32.7610 |
219.8532 |
|
2003A |
26.5500 |
210.4011 |
|
2004A |
7.5380 |
140.4347 |
|
2005A |
-22.5930 |
277.1476 |
|
2006A |
343.2360 |
80.5838 |
|
2007A |
-38.2180 |
653.2086 |
|
2008A |
-20.8090 |
634.2659 |
|
2009A |
-162.4090 |
1978.8694 |
|
2010A |
156.8260 |
1139.7295 |
|
2011A |
273.8690 |
1341.0419 |
|
2012A |
903.5130 |
778.3625 |
|
2013A |
-246.3550 |
1225.3089 |
|
2014A |
1858.6570 |
1379.7039 |
|
2015A |
-1671.3860 |
5938.7047 |
|
2016A |
603.9360 |
6460.8834 |
|
2017A |
481.3340 |
7504.8386 |
|
2018A |
82.0000 |
8469.9410 |
|
2019A |
3687.0000 |
3496.2902 |
|
2020A |
4250.0000 |
-3179.9410 |
|
2021A |
570.0000 |
-2374.3795 |
|
2022A |
1099.0000 |
145.6142 |
|
2023A |
-116.0000 |
14416.2794 |
(Note: The "A" in the fiscal year column represents "Arrears," indicating that the data refers to the end of the fiscal year or represents outstanding balances.)
Here is an example of how to perform that calculation by explaining the data in Table 2 more vividly. Applying the first entry (−$41,600), this value can be interpreted as the dynamic net present value of Airbnb (NPV) – adjusted to 2000. The calculation process is as follows: we first extract the net cash reduction for that year (−473.59K) and then discount it to its current value at a discount rate of 10%. The procedure for obtaining the dynamic NPV is to use the formula: NPV=FCFF/(1+r)t, where FCFF is the company's free cash flow, r is the discount rate, and t is the number of time periods. From here, we obtain a dynamic NPV of -41.6672 as of this year.
The period from 2000 to 2023 shows significant annual fluctuations in NPV, showing a significant increase of 342.2360 in 2006 and decreasing to -1671.3860 in 2015. Years with a negative net present value represent an unfavorable investment climate and poor capital management by the company. In a year like 2015, investors and management should consider avoiding major capital investments. From a long-term perspective, the performance of net present value can be used as an indicator to evaluate the financial health and sustainable profitability of a company.
We can see that in 2000,2020 and 2021, npv of AIRBNB is negative.
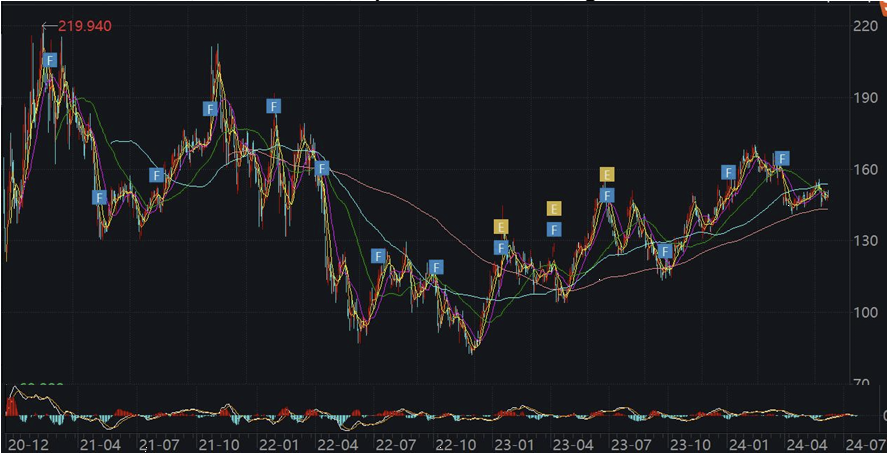
The chart further supports these conclusions, showing a sharp decline in Airbnb’s stock price between 2020 and 2021, which aligns with the periods of negative NPV. By utilizing the NPV method, investors can identify these potential risk periods and avoid investing during times when NPV is negative. While we have stated that a company's negative NPV signals a potential stock price decline, however, it should be put clear that a decrease in NPV is sometimes independent of the share price. Thus, if we do have a situation where the declines in NPV and the stock price occur at the same moment, an investor will not be able to hedge their risk without delay or in an orderly way. Hence, we conjecture the negative value of NPV is the sign that the market trends first, other investors will react to this ahead of time then hedge effectively against the down fall of share price.
|
date |
Net Increase (Decrease)in Cash and Equivalent dynamic npv |
irr |
roic |
|
|
2018-12-31 |
82.0000 |
8469.9410 |
-5% |
-62% |
|
2019-12-31 |
387.0000 |
3496.2902 |
-22% |
-2625% |
|
2020-12-31 |
4250.0000 |
-3179.9410 |
7% |
-12840% |
|
2021-12-31 |
570.0000 |
-2374.3795 |
57% |
ˉ614% |
|
2022-12-31 |
1099.0000 |
145.6142 |
39% |
2647% |
|
2023-12-31 |
-116.0000 |
14416.2794 |
38% |
5414% |
Based on the data from the chart, further insights can be added as follows:
From 2018 to 2023, Airbnb’s net cash flow and dynamic Net Present Value (NPV) show significant fluctuations. In 2019, net cash flow increased substantially to 3687.0000, with a corresponding dynamic NPV of 3496.2902, indicating a strong financial performance for that year. Although the Internal Rate of Return (IRR) dropped to -22%, it improved from the -5% recorded in 2018. However, the Return on Invested Capital (ROIC) remained at -2625%, showing inefficiencies in capital utilization. In 2020, while net cash flow further increased to 4250.0000, the dynamic NPV dropped sharply to -3179.9410, suggesting that despite cash flow growth, the long-term value was negatively impacted. This aligns with the IRR rising to 7%, yet the ROIC deteriorated further to -12840%, indicating significant challenges in capital management.
In 2021, net cash flow decreased significantly to 570.0000, but IRR surged to 57%, indicating a notable improvement in investment returns. However, the ROIC remained negative at -614%, highlighting ongoing issues with capital efficiency. By 2022, net cash flow recovered to 1099.0000, and dynamic NPV improved to 145.6142. During this year, the IRR reached 39%, while ROIC climbed to 2647%, suggesting a marked improvement in Airbnb’s capital returns. In 2023, despite a negative net cash flow of -116.0000, dynamic NPV soared to 14416.2794, indicating strong long-term investment value. The IRR held steady at 38%, and ROIC surged to 5414%, demonstrating a significant enhancement in capital management efficiency. 38% IRR implies that the investors obtained a potent income through Airbnb in 2023 notwithstanding the negative cash flows. It indicates that the return on the capital is still high over time in spite of the current poor cash flow performance, which confirms the long-term potential of the earning capacity of the business.
These data suggest that although Airbnb faced cash flow challenges in certain years, its dynamic NPV and IRR remained robust, especially in 2021 and 2023, showing that there could be substantial return potential for investors in those years. By analyzing financial indicators such as net cash flow, dynamic NPV, IRR, and ROIC, investors can better identify potential risks and opportunities, enabling them to make more informed investment decisions.
|
FY Dec |
date |
MV |
|
2020A |
2020-12-31 |
87,962.1196 |
|
2021A |
2021-12-31 |
107,007.1188 |
|
2022A |
2022-12-31 |
54,136.6491 |
|
2023A |
2023-12-31 |
88,278.3574 |
|
2024E |
2024-07-24 |
95,801.5175 |
The table above shows the market value of Airbnb from 2020 to 2024 (with 2024 being an estimate). We can observe that the market value increased significantly in 2021, reaching 107,007.1188, before dropping sharply in 2022 to 54,136.6491. By 2023, the market value rebounded to 88,278.3574, with an estimated value of 95,801.5175 projected for 2024.
It is clear that investment in 2021 should be approached with caution due to the sharp increase in market value, but relying solely on IRR for decision-making may lead to errors in judgment during this period.
3.2.5. Booking
Booking Holdings very much operates in an environment where it is battling a continuously evolving and highly competitive travel-and-hospitality field. Thus, it becomes necessary to assess its effectiveness in terms of financial indicators, which are cash flow, NPV, IRR, and ROIC in particular. These parameters shed light on the investor's performance on their investment returns and show how well they manage investment risks while growing their business in a fluctuating market. Measuring Booking's performance in terms of investments, this IRR will be compared to the IRR of the S&P 500. This means that we are able to recognize how well Booking performs compared to the market flus and whether or not it yields competitive returns. In contrast, the internal rate of return is the IRR obtained by a company through its financial model, while the S&P 500 return is the realized market return during a period. They are different, and there are different calculations for them also. In addition, their role in investment strategy also has to be evaluated.
|
t |
Date |
R(BKNG, t) |
R(S&P 500, t) |
|
|
1 |
Feb 28, 2019 |
-7.41% |
2.97% |
|
|
2 |
Mar 31, 2019 |
2.82% |
1.79% |
|
|
3 |
Apr 30, 2019 |
6.31% |
3.93% |
|
|
4 |
May 31, 2019 |
-10.72% |
-6.58% |
|
|
5 |
Jun 30, 2019 |
13.19% |
6.89% |
|
|
6 |
Jul 31, 2019 |
0.63% |
1.31% |
|
|
7 |
Aug 31, 2019 |
4.23% |
-1.81% |
|
|
8 |
Sep 30, 2019 |
-0.19% |
1.72% |
|
|
9 |
Oct 31, 2019 |
4.39% |
2.04% |
|
|
10 |
Nov 30, 2019 |
-7.06% |
3.40% |
|
|
11 |
Dec 31, 2019 |
7.86% |
2.86% |
|
|
12 |
Jan 31, 2020 |
-10.87% |
-0.16% |
|
|
13 |
Feb 29, 2020 |
-7.37% |
-8.41% |
|
|
14 |
Mar 31, 2020 |
-20.66% |
-12.51% |
|
|
15 |
Apr 30, 2020 |
10.05% |
12.68% |
|
|
16 |
May 31, 2020 |
10.73% |
4.53% |
|
|
17 |
Jun 30, 2020 |
-2.87% |
1.84% |
|
|
18 |
Jul 31, 2020 |
4.38% |
5.51% |
|
|
19 |
Aug 31, 2020 |
14.94% |
7.01% |
|
|
20 |
Sep 30, 2020 |
-10.46% |
-3.92% |
|
|
21 |
Oct 31, 2020 |
-5.15% |
-2.77% |
|
|
22 |
Nov 30, 2020 |
25.02% |
10.75% |
|
|
23 |
Dec 31, 2020 |
9.80% |
3.71% |
|
|
24 |
Jan 31, 2021 |
-12.70% |
-1.11% |
|
|
25 |
Feb 28, 2021 |
19.76% |
2.61% |
|
|
26 |
Mar 31, 2021 |
0.06% |
4.24% |
|
|
27 |
Apr 30, 2021 |
5.85% |
5.24% |
|
|
28 |
May 31, 2021 |
-4.24% |
0.55% |
|
|
29 |
Jun 30, 2021 |
-7.35% |
2.22% |
|
|
30 |
Jul 31, 2021 |
-0.45% |
2.27% |
|
|
31 |
Aug 31, 2021 |
5.57% |
2.90% |
|
|
32 |
Sep 30, 2021 |
3.23% |
-4.76% |
|
|
33 |
Oct 31, 2021 |
1.98% |
6.91% |
|
|
34 |
Nov 30, 2021 |
-13.17% |
-0.83% |
|
|
35 |
Dec 31, 2021 |
14.15% |
4.36% |
|
|
36 |
Jan 31, 2022 |
2.37% |
-5.26% |
|
|
37 |
Feb 28, 2022 |
-11.56% |
-3.14% |
|
|
38 |
Mar 31, 2022 |
8.11% |
3.58% |
|
|
39 |
Apr 30, 2022 |
-5.88% |
-8.80% |
|
|
40 |
May 31, 2022 |
1.50% |
0.01% |
|
|
41 |
Jun 30, 2022 |
-22.04% |
-8.39% |
|
|
42 |
Jul 31, 2022 |
10.67% |
9.11% |
|
|
43 |
Aug 31, 2022 |
-3.09% |
-4.24% |
|
|
44 |
Sep 30, 2022 |
-12.40% |
-9.34% |
|
|
45 |
Oct 31, 2022 |
13.77% |
7.99% |
|
|
46 |
Nov 30, 2022 |
11.23% |
5.38% |
|
|
47 |
Dec 31, 2022 |
-3.09% |
-5.90% |
|
|
48 |
Jan 31, 2023 |
20.78% |
6.18% |
|
|
49 |
Feb 28, 2023 |
3.69% |
-2.61% |
|
|
50 |
Mar 31, 2023 |
5.09% |
3.51% |
|
|
51 |
Apr 30, 2023 |
1.28% |
1.46% |
|
|
52 |
May 31, 2023 |
-6.61% |
0.25% |
|
|
53 |
Jun 30, 2023 |
7.64% |
4.71% |
|
|
54 |
Jul 31, 2023 |
10.02% |
4.85% |
|
|
55 |
Aug 31, 2023 |
4.52% |
-1.77% |
|
|
56 |
Sep 30, 2023 |
-0.68% |
-4.87% |
|
|
57 |
Oct 31, 2023 |
-9.55% |
-2.20% |
|
|
58 |
Nov 30, 2023 |
12.05% |
8.92% |
|
|
59 |
Dec 31, 2023 |
13.49% |
4.42% |
|
|
Total (Σ): |
||||
(From the chart above, we depict the Internal Rate of Return (IRR) for Booking Holdings in parallel to the S&P 500 spanning from 2019 to 2023. By doing so, one becomes more familiar with the rate of return of Booking's investment with respect to the marketplace. )
Through the illustration of this comparison, it is obvious that periods where Booking performs significantly better than the market as a whole and those in which it falls in the market are observable. Through this, we can understand the following - Booking's IRR demonstrates severe negative fluctuations during the first months of 2020, reflecting the sharp recession initiated by the COVID-19 outbreak. Whereas IRR clarifies the returns associated with Booking's investments alone, a full financial picture of the company also includes an analysis of various underlying parameters, like cash flow, NPV, ROIC, and market price. To see whether Booking's IRR touches or surpass the benchmark rate of 15.6%, we utilize this as the investment's growth in travel and hospitality is similar. This can serve as a baserate for investors in the form of IRR which Booking's IRR is compared to the threshold thus determining the investment's desirability.
Also, we can get the npv as the following table:
|
date |
cash flow |
npv |
irr |
roic |
MV |
|
2017A |
151.021 |
186.8883 |
-0.0572 |
12.1465 |
84,748.7909 |
|
2018A |
504.933 |
509.315 |
0.0650 |
20.9219 |
79,493.6935 |
|
2019A |
97.275 |
62.31349 |
0.0786 |
30.4110 |
85,060.1590 |
|
2020A |
(667.103) |
-496.314 |
0.098 |
0.3750 |
91,227.9858 |
|
2021A |
2164.372 |
2425.353 |
0.1415 |
6.8507 |
99,124.9768 |
|
2022A |
3405.337 |
3706.093 |
-0.0309 |
18.8935 |
78,171.4778 |
|
2023A |
3839.000 |
4270.917 |
0.1349 |
32.1189 |
123,762.0553 |
(Note: This table contains a summary of Booking's financial data—specifically, cash flow, NPV, IRR, ROIC, and market value—between the years 2017 and 2023.)
This table exhibits the yearly alternations of this parameter, capturing the essence of the fiscal health and achievement of the company. For example, the statistics highlight a dramatic drop in almost every parameter for the year 2020, which had been greatly affected by the COVID-19 pandemic. The NPV is also accompanied with negative cash flow over this year and thus indicates that booking was under financial strain. On the contrary, 2023 is a year of revival that records the highest cash flow and NPV from this period, showing the company's power to recover. ROIC further strengthens from 0.3750 in 2020 to 32.1189 in 2023, which clearly indicates that the company had been using its capital more efficiently. The market value (MV) also moves in tandem, and through this, investors can gain an impression about how these financial changes are viewed by the market.
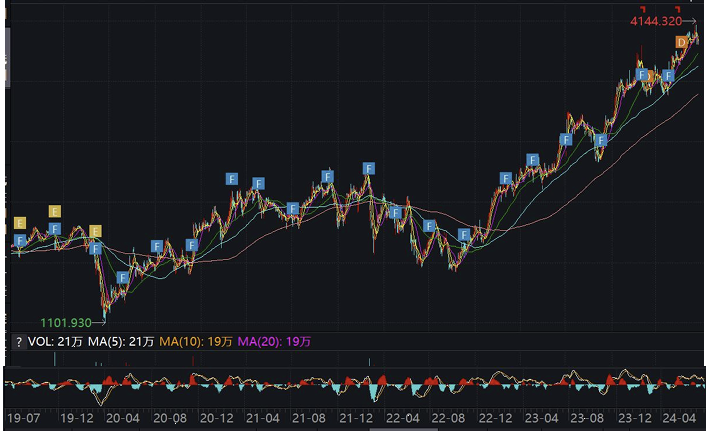
The chart shows Booking's stock price trend, which correlates with the changes in NPV.
(Note: ROIC (Return on Invested Capital) and market capitalization metrics serve a dual purpose as they reveal both the operational efficiency of the company and its market standing.)
The company's ROIC had been unstable during the investigating period, registering a 0.3750 low in 2020 and 32.1189 high in 2023, which shows its improvement. This improvement can be viewed as a story of compelling success because of the fact that it reflects a more effective allocation of capital in generating gains subsequent to the pandemic. The market value of the Booking also recorded a similar trend, which declined sharply in 2020 but picked up dramatically after that. It underlines the market's positive attitude to the recovery of Booking's growth prospects and its power to cope with such difficult periods. The study offers a picture of a business, which succeeded to weather a significant turbulence in the market, especially the COVID-19 pandemic, which occurred during its period (2017 - 2023). The comparison of Booking's IRR with the S&P 500 brings out the situation when the trading market hit a slump in early 2020, which made the company's IRR plunge as the whole travel-related industry had faced the most formidable challenges ever in its history. Meanwhile, the recovery phase has brought Booking's IRR a second wind, and sometimes it exceeds the market performance as well, thus representing resilience and dexterity in coping with the constantly changing environment. The consideration of the negative cash flow and NPV during the same period of time (year 2020 onwards) adds much credence to the above story, which suggests that 2023 will usher in positive financial indicators (stronger financial position and operational efficiency). ROIC cases confirm this recovery: the evidence shows that over the last few years Booking’s has greatly improved its capital usage. Using a 15.6% benchmark rate of IRR is a good example of years with investing not producing as much return or coming back, which helps brainstorm investment decisions. But then, the data showed me that despite the storms the company was facing at that time, it has been able to come back and set itself ready for growth, and perhaps even the future outcomes of some investors in the travel sector looking to make advantages of the long-term returns in the market.
3.3. Regression model
3.3.1. Variable selection
1. Dependent Variables: Revenue growth, profitability, and M/C, which indicates the state of the financial condition of the companies and the performance in the market.
2. Independent Variables: NPV (Net Present Value), IRR (Internal Rate of Return), and Payback Period, which are in the different regions with frequency and theoretical value for investment decision-making.
The model controls for exogenous variables such as market circumstances and industry trends so as to distinguish the effect of the evaluation metrics from financial performance. To ensure model reliability, industrial factors (e.g., labor cost, raw material prices) and macroeconomic parameters, such as Gross Domestic Product (GDP) growth rate and interest rate fluctuations, should be kept constant. Such variables are going to minimize the effect of market changes on a firm's market capitalization, so we will be able to measure the degree to which NPV, IRR, and ROIC of a company contribute to its performance. Doing so enables us to find out which of the independent variables are more likely to predict the success of the defined performance.
|
date |
cashflow |
npv |
irr |
roic |
MV |
|
2017A |
151.021 |
186.88825 |
-.0571923 |
12.1465 |
84748.791 |
|
2018A |
504.93338 |
509.31501 |
.065 |
20.9219 |
79493.694 |
|
2019A |
97.275 |
62.313488 |
.0786 |
30.411 |
85060.159 |
|
2020A |
-667.103 |
-496.31381 |
.098 |
.375 |
91227.986 |
|
2021A |
2164.372 |
2425.3528 |
.1415 |
6.8507 |
99124.977 |
|
2022A |
3405.337 |
3706.0926 |
-.0309 |
18.8935 |
78171.478 |
|
2023A |
3839 |
4270.9166 |
.1349 |
32.1189 |
123762.06 |
|
12/31/2020 |
4250 |
-3179.941 |
.06588421 |
-128.4025 |
87962.12 |
|
12/31/2021 |
570 |
-2374.3795 |
.56653381 |
-6.1354 |
107007.12 |
|
12/30/2022 |
1099 |
145.61418 |
.38907151 |
26.4658 |
54136.649 |
|
12/29/2023 |
-116 |
14416.279 |
.38289529 |
54.1377 |
88278.357 |
The descriptive statistic are listed as follows:
|
Variable |
Mean |
SD |
Min |
Max |
|
cashflow |
1391 |
1734 |
-667.1 |
4250 |
|
npv |
1788 |
4763 |
-3180 |
14416 |
|
irr |
0.170 |
0.190 |
-0.0600 |
0.570 |
|
roic |
6.160 |
47.63 |
-128.4 |
54.14 |
|
MV |
88998 |
17602 |
54137 |
123762 |
Our regression model aims to assess the impact of different investment evaluation metrics on the financial success of startups. We selected the following variables:
3.3.2. Regression model explanation and algorithm
|
. regress MV npv1 irr1 roic1 |
||||||
|
Source |
SS |
df |
ms |
Number of obs F (3,7) Prob > F R-squared Adj R-squared Root MSE |
= = = = = = |
11 1.18 0.3836 0.3360 0.0514 17144 |
|
Model Residual |
1.0410e+09 2.0574e+09 |
3 7 |
34700446529 3913644 |
|||
|
Total |
3.0984e+09 |
10 |
309840890 |
|||
|
MV |
Coefficient |
Std. err. |
t |
P>|t| |
[95% conf. interval] |
|
|
npv1 irr1 roic1 cons |
3.11e+07 -1.93e+11 3.40e+09 -2.72e+11 |
2.50e+07 4.27e+11 2.59e+09 2.64e+11 |
1.24 -0.45 1.31 -1.03 |
0.255 0.665 0.231 0.337 |
-2.81e+07 -1.20e+12 -2.73e+09 -8.97e+11 |
9.03e+07 8.16e+11 9.53e+09 3.53e+11 |
The purpose of this regression model is to leverage three determinant financial indicators (NPV, IRR, and ROIC) to explain the extent of variation in market value. Market value indicates equity (the capital raised from shareholders) of a company and demonstrates how the market thinks the company's future cash flow can be perceived. It can be achieved through that research what effect market value vary with the company's financial position and its market performance. MV = β0 + β1 × NPV + β2 × IRR + β3 × ROIC + ϵ In this equation, the constant term β0 is the baseline market value that refers to the scenarios when NPV, IRR, and ROIC equal zero. The employment of zero means that the equation then begins to “build” on it, which is a typical method of market value as no component can have a zero value in the real scenario. The net present value (NPV), which is the amount of money gained from a project after deducting the initial investment, is a key financial measure of projected performance. Through the relation of the regression coefficient β1, it tells us how NPV determines the market value. In most cases, it is generally true that the higher the NPV, the higher the market value will likely result in because the market estimates more potential future cash flow. At the end, ROI is the tool every company uses to advance its profitability and performance. The regression model implies the relationship between IRR and market value through the β2 coefficient as well. But a high IRR usually shapes a picture of high project returns and thus a high market value, however, sometimes very high IRR can be a sign of higher risk of the project, which hardly will lead to a significant increase in market value. Consistent with profitability of the company, ROIC points to its capital efficiency when it comes to creation of returns. It is them, β3, that indicates how the market value reacts to ROIC. Higher ROIC, as a result, is a strong indication that the firm is skillfully controlling the capital, which eventually increases the market value. The fluctuation in the market value whose determinants are not explicitly modeled, are encapsulated by the error term (ϵ). These unidentified factors include market sentiment and other issues affecting the overall economy which can also cause instability with the market value. Using this statistical model, we evaluate the effect of NPV, IRR, and ROIC on a firm’s market value. It is possible to make such links among this firm's financial metrics and how it reveals in the market that the product is valuable.
4. Results
4.1. Comparison between airbnb and booking
According to the analysis of airbnb and booking, the values of net present value (NPV), return on invested capital (ROIC) and cash flow (CF) fluctuated greatly between 2000 and 2023. Both 2015 and 2020 were loss-making, with negative CVA and ROIC scores. After a period of recovery, both companies showed positive values in 2021 and 2023, indicating that non-financial management was strengthened and the increase in long-term investment value allowed the company to return to profitability. From the results, we can see that Airbnb also showed better resistance to market fluctuations than Booking.com and achieved better financial returns by using dynamic net present value (NPV) and internal rate of return (IRR). These two rivals' paths may be different if the pandemic of 2020 faces the former. The scenarios we can simulate include a sharp market recovery, a slow recovery, an extended recession, etc. to determine IRR and NPV outcomes at different settings. In this case, it would be shown during the fast market recovery scenario, where Airbnb's NPV would recover more, committed to its ratio of centralized business view, while booking.com NPV is expected to recover more slowly because of centralized business model. Compared with the S&P 500, Booking. com's internal rate of return (IRR) shows that the two trends were different during market fluctuations. It is important to remember that constructing WACC together with NPV, IRR and ROIC gives investors a more accurate picture of the investment opportunities of both companies in an ambiguous market.
4.2. Regression results
Such a step is necessary for the proper contextualization of the regression model results related to the companies studied (Airbnb and Booking) as they differ in their operating areas and financial frameworks. Both are experiencing the same phenomenon in the field of tourism and hospitality industry, which is affected by reasons that cannot always be predicted, but may include the COVID-19 pandemic as well as changes in customer demand. This means that the financial analysis is done based on multidimensional indicators such as NPV, IRR and ROIC to determine their strengths, weaknesses and performance.
In the case of Airbnb, when the outbreak occurred, the number of bookings dropped sharply, which made the platform's cash flow decrease and the financial situation look bleak. Despite this, Airbnb's NPV may still be considered as having positive long-term growth potential for other companies due to the recovery of tourism demand. The NPV variable is represented by the coefficient number 3.11e+07, which means that the long-term cash flows attributed to Airbnb have the potential to stabilize or become more predictable, thus bringing a higher value to the business. One point that is important to emphasize is that Airbnb’s NPV reflects the company’s potential to generate cash flow in the longer term, even in the face of short-term market turmoil. While this may seem harmful, it is important because Airbnb’s business model relies on a decentralized network of hosts, so the long-term value of the platform depends on how quickly Airbnb can recover from these disasters.
In contrast, for Booking, which targets roughly the same type of customers as hotels and resorts, the findings reveal different, but still similar, issues and opportunities. The coefficient of IRR is -1.93e11, which means that high returns in the short term may not be sustainable when it comes to addressing the company’s long-term value. This may make Booking overly dependent on a full recovery in the travel industry and the risks associated with its large-scale partnerships. Having said that, the results of the internal review in the initial months during the pandemic may be temporary, as can be seen in the reduction of expenses and adjustments to the business. But in its long-term forecast, investors’ eyes may be focused on cash flow rather than short-term strategies, as they do not seem to be enough to affect market value.
The ROIC of both companies, while significant, did not show significant predictive power in the model, with a p-value of 0.231. However, for companies like Airbnb and Booking, ROIC still plays a role in understanding their capital efficiency. For Airbnb, which has invested heavily in platform development and marketing, higher ROIC over time could mean improved capital utilization, directly impacting investor confidence. Meanwhile, Booking’s ROIC will reflect its ability to manage operating costs while expanding its services globally. While ROIC does not emerge as the primary driver for this particular model, it is still an important factor in assessing a company’s long-term operating efficiency.
In summary, the results of the regression analysis process suggest that NPV is a crucial metric when determining the overwhelming market value of businesses like Airbnb and Booking. Focusing on the IRR is consistent with the long-term and cash flow nature of the industry, which is fundamental to understand when assessing a company’s sustainability, as current IRRs do not guarantee long-term success. In the coming months, we may observe an increasing importance of NPV and ROIC, as these parameters will play a key role in shaping investor expectations and the positioning of these companies in the market. Therefore, overall, investors must consider the approaches these companies take to capture their long-term success, rather than relying solely on direct economic metrics like IRR.
4.3. Comparison of NPV and regression models
Regression models are a more comprehensive and dynamic analysis method. In different regression models, the goal is to assign values to the relationship of variables and derive their impact on independent variables, such as market value. In evaluating the contribution of Airbnb and Booking's NPV to market value, regression models not only allow us to evaluate the role of other important indicators such as IRR (internal rate of return) and ROIC (return on invested capital) in the analysis, but also provide more detailed information on the specific contribution of NPV. Through regression models, we can get a comprehensive understanding of the company's financial efficiency through the interdependent factors of numerous variables. Hierarchical regression analysis is best suited for difficult investment fields because there are many projects and financials to consider. For a given company, especially Airbnb and Booking, in an unstable environment where there are many factors that affect market value, regression models really help to show their importance.
Another advantage of regression models is that they are adaptable. They analyze not only the financial sector, but also include macroeconomic variables, industry trends, and non-financial factors to provide a more comprehensive explanation of market value. However, when applying regression models, the limitations of their complexity must be considered. When using regression models, investors must understand the meaning of regression coefficients, the interdependence of variables in the perception of company success. The accuracy of predictive regression analysis is an inherent advantage that is susceptible to the quality of the input data used. Poor quality data and increased noise can in turn lead to biases in the model's output, reducing the reliability of the model. In practice, there are many cases where NPV and regression are used in combination. NPV uses intuitive financial calculations, simple, and personalized methods for project costing, making it suitable for investment decisions. Considering the discussion above regarding the application scenarios for the methods of NPV, IRR, and Payback Period, their functions can be summarized as such: NPV shows itself to be very useful in long-term projects, while IRR is more suitable for short-term projects. The Payback Period is a simple approach but not investor-friendly, as it does not account for the time value of money and therefore can lead to wrong calculates in high-risk industries. For instance, the feature of NPV in technology-driven startups is that it is more flexible to survive the uncertainty of the market, while IRR can exaggerate project Returns in the highly volatile situations of tech startups. In contrast, regression models conduct a deeper analysis by evaluating the impact of the interaction of financial indicators on the overall market performance. In complex companies like Airbnb and Booking, where financial performance is subject to a variety of other factors, regression models can better describe the various other influences on market value.
Therefore, investors and financial analysts can apply NPV to evaluate the basic financial feasibility of a project and, where applicable, apply regression models to further analyze non-financial factors that contribute to the company's market value, providing a broader basis for decision making. In other words, while NPV and regression models have their own characteristics in investment analysis, they both have their own advantages and limitations. First, NPV is established and does not go beyond its scope of financial analysis of a single project. It can be considered a more appropriate choice for long-term investments with regular and reliable cash flows. In contrast, regression models provide multiple levels of analysis, allowing investors to understand a company's performance from various perspectives; however, regression models require more complex work and more data and interpretation. In a complex market environment where many independent variables have an impact on the value of a business, such as Airbnb and Booking, both the NPV model and the regression model can be used to obtain answers.
5. Conclusion
The purpose of this paper is to assess the NPV, IRR, and payback period as investment appraisal methods. Consider two companies, Airbnb and Booking. Their relationship with the establishment of innovative business models is emphasized in the context of the analysis. While statistical techniques and case studies will be combined to furnish a theoretical framework, the bureaucratic simulation will help us to understand how such tools contribute to capital decisions and what discrepancies may arise in implementation of these instruments. The outcome of this research is, undoubtedly, quite crucial in the context of this vital sector in decision-making. Our analysis reveals NPV as a fair and commonly used predictor of performance that can provide insights for financial affairs in the long run. This value becomes particularly useful for evaluation of long-run projects as it goes beyond the time factor and reflects the value indeed created by executing the project. Moreover, apart from IRR and Payback Period (which are not free from risks), tickers that are quite informative also. Shadowing the IRR, it can be assumed that medium-term cash flows are reinvested at the IRR itself, which might not be the case, or projects with different cash flows can have multiple IRRs. Using multiple financial metrics along within an external surrounding such as the economic indicators, industry trends and market conditions will determine if the investor makes a good or bad decision. In short, an all-embracing view of all available data leads to sounder strategies with both increased profitability and less steadiness [10].
In our study, which emphasizes the strengths and weaknesses of various investment valuation methods, NPV is the most reliable predictor of financial performance among all research methods. In assessing attractiveness, IRR is useful, but too many assumptions, as well as multiple value possibilities, should be used in conjunction with NPV and not alone, and the payback period ignores the time value of money and long-term benefits and cannot be used as the sole basis [11]. In summary, investors should combine all three metrics to fully evaluate an investment, and should regularly use sensitivity analysis to understand how changes in key assumptions affect valuation results. This approach can be very helpful in identifying risks and managing them, but of course, some other possible factors need to be taken into account, such as market conditions, technological advances macroeconomic trends, and other external factors, as a way to improve the accuracy of investment decisions.
The ultimate goal of this research is to hopefully expand the application of these metrics to a wider range of areas, such as failed companies, or startups more generally. This expansion of scope will validate and refine the results of this study and provide a more comprehensive understanding of the effectiveness of different investment evaluation methods. In addition, combining real-time data with more advanced predictive analytics could further improve the accuracy and relevance of the study. Utilizing machine learning algorithms and big data analytics to predict the success of emerging companies based on a wide range of financial and non-financial factors can provide deeper insights and more robust investment strategies. Adopting these recommendations allows investors and financial analysts to improve their decision-making and achieve more successful outcomes in the high-risk environment of emerging technology companies.
The future research can conduct using financial models with a highly dynamic approach, such as machine learning-based cash flow forecasting models, so that it can further optimize the prediction of NPV and IRR numbers. Also, the adoption of the NPV models in biotechnology, green energy, and information technology (IT), among other high-risk industries, can be examined to check whether the models are widely applicable or not. Lastly, subsequent to that, data-driven analytics and real-time NPV calculation runtime adjustment have the potential to become one of the most significant financial decision-making trends of the future.
References
[1]. Braun, R. (2009). Risk of private equity fund-of fund investments—A detailed cash flow-based approach, SSRN Electronic Journal.
[2]. Charsios, G., Moutafidis, K., & Foroglou, G. (2016). Valuation model for Internet-of-Things (IoT) startups (Conference Paper).
[3]. Krishna, A., Agrawal, A., & Choudhary, A. (2016). Predicting the outcome of startups: Less failure, more success. Paper presented at IEEE 16th Interna- tional Conference on Data Mining workshops (ICDMW).
[4]. Visconti, R. M. (2020). The valuation of technological startups. In Springer eBooks (pp. 155–192). https://doi.org/10.1007/978-3-030-36918-7_6
[5]. Myers, S. C., & Majluf, N. S. (1984). Corporate financing and investment deci-sions when firms have information that investors do not have. Journal of Financial Economics, 13, 187–221.
[6]. Mellichamp, D. A. (2019). Profitability, risk, and investment in conceptual plant design: Optimizing key financial parameters rigorously using NPV. Computers & Chemical Engineering, 128, 450–467. https://doi.org/10.1016/j.compchemeng.2019.04.016
[7]. Nwogugu, M. C. I. (2016). Anomalies in net present value, returns and polynomials, and regret theory in decision-making. Palgrave Macmillan.
[8]. Nasser, S. (2016). Valuation for startups—9 methods explained. ICT Strategic Consulting.School of Business and Management ITB. (2022, June 15). SBM ITB. https://FINANCIAL% 20FEASIBILITY% 20OF%20 BUSINESS%20ON%20TOY%20STARTUP:%20A%20CASE%20STUDY%20OF%20CODY%20KIT%20Thomas%20Aquinas%20Ardi%20Jagatpati1,%20Atika%20Irawan2%20%201%20School%20of%20Business%20and%20Management,%202Bandung%20Institute%20of%20Technology%20%20thomas_aquinas@sbm-itb.ac.id/
[9]. Smith, C. W., & Warner, J. (1979). On financial contracting: An analysis of bond covenants. Journal of Financial Economics, 7 (2), 117–161.
[10]. Venture Valuation. (2019). Valuation methods. Available at https://www.venturevaluation.com/en/ methodology/valuation-methods.
[11]. Trichkova, R., & Kanaryan, N. (2015). Startups valuation: Approaches and meth-ods. Paper presented at 1st Balkan Valuation conference “Best valuation prac-tices”, pp. 19–21, Sofia, Bulgaria.
Cite this article
Lin,J.;Dong,J.;Zheng,Y. (2025). Net Present Value As a Decision Tool During Investment: Evaluating the Effectiveness of Net Present Value (NPV) Against Traditional Investment Appraisal Techniques in Predicting the Financial Success of Technology Startups. Advances in Economics, Management and Political Sciences,217,41-60.
Data availability
The datasets used and/or analyzed during the current study will be available from the authors upon reasonable request.
Disclaimer/Publisher's Note
The statements, opinions and data contained in all publications are solely those of the individual author(s) and contributor(s) and not of EWA Publishing and/or the editor(s). EWA Publishing and/or the editor(s) disclaim responsibility for any injury to people or property resulting from any ideas, methods, instructions or products referred to in the content.
About volume
Volume title: Proceedings of the 4th International Conference on Financial Technology and Business Analysis
© 2024 by the author(s). Licensee EWA Publishing, Oxford, UK. This article is an open access article distributed under the terms and
conditions of the Creative Commons Attribution (CC BY) license. Authors who
publish this series agree to the following terms:
1. Authors retain copyright and grant the series right of first publication with the work simultaneously licensed under a Creative Commons
Attribution License that allows others to share the work with an acknowledgment of the work's authorship and initial publication in this
series.
2. Authors are able to enter into separate, additional contractual arrangements for the non-exclusive distribution of the series's published
version of the work (e.g., post it to an institutional repository or publish it in a book), with an acknowledgment of its initial
publication in this series.
3. Authors are permitted and encouraged to post their work online (e.g., in institutional repositories or on their website) prior to and
during the submission process, as it can lead to productive exchanges, as well as earlier and greater citation of published work (See
Open access policy for details).
References
[1]. Braun, R. (2009). Risk of private equity fund-of fund investments—A detailed cash flow-based approach, SSRN Electronic Journal.
[2]. Charsios, G., Moutafidis, K., & Foroglou, G. (2016). Valuation model for Internet-of-Things (IoT) startups (Conference Paper).
[3]. Krishna, A., Agrawal, A., & Choudhary, A. (2016). Predicting the outcome of startups: Less failure, more success. Paper presented at IEEE 16th Interna- tional Conference on Data Mining workshops (ICDMW).
[4]. Visconti, R. M. (2020). The valuation of technological startups. In Springer eBooks (pp. 155–192). https://doi.org/10.1007/978-3-030-36918-7_6
[5]. Myers, S. C., & Majluf, N. S. (1984). Corporate financing and investment deci-sions when firms have information that investors do not have. Journal of Financial Economics, 13, 187–221.
[6]. Mellichamp, D. A. (2019). Profitability, risk, and investment in conceptual plant design: Optimizing key financial parameters rigorously using NPV. Computers & Chemical Engineering, 128, 450–467. https://doi.org/10.1016/j.compchemeng.2019.04.016
[7]. Nwogugu, M. C. I. (2016). Anomalies in net present value, returns and polynomials, and regret theory in decision-making. Palgrave Macmillan.
[8]. Nasser, S. (2016). Valuation for startups—9 methods explained. ICT Strategic Consulting.School of Business and Management ITB. (2022, June 15). SBM ITB. https://FINANCIAL% 20FEASIBILITY% 20OF%20 BUSINESS%20ON%20TOY%20STARTUP:%20A%20CASE%20STUDY%20OF%20CODY%20KIT%20Thomas%20Aquinas%20Ardi%20Jagatpati1,%20Atika%20Irawan2%20%201%20School%20of%20Business%20and%20Management,%202Bandung%20Institute%20of%20Technology%20%20thomas_aquinas@sbm-itb.ac.id/
[9]. Smith, C. W., & Warner, J. (1979). On financial contracting: An analysis of bond covenants. Journal of Financial Economics, 7 (2), 117–161.
[10]. Venture Valuation. (2019). Valuation methods. Available at https://www.venturevaluation.com/en/ methodology/valuation-methods.
[11]. Trichkova, R., & Kanaryan, N. (2015). Startups valuation: Approaches and meth-ods. Paper presented at 1st Balkan Valuation conference “Best valuation prac-tices”, pp. 19–21, Sofia, Bulgaria.