


1. Introduction
Volatility indices play an important role in investment decision-making. For instance, Implied Volatility (IV) and Historical Volatility (HV) are two indicators commonly used in options trading. Volatility indices can affect the price of options, and they can also be used to construct various trading strategies. In 2020, the paper titled *BVIN: The Bitcoin Volatility Index* [1] first proposed the concept of the Bitcoin Volatility Index (BVIN) and its calculation method. As a key index of the Bitcoin market, BVIN provides investors with valuable market insights into Bitcoin market trends. This study aims to explore whether the BVIN algorithm can be applied to other financial products and generate equally effective market performance indices.
In the context of other financial products, such as corporate stock options, multiple traditional volatility calculation methods already exist. However, there is no specific algorithm for the volatility of VIX options. Traditional volatility algorithms have been widely used and recognized in the financial field due to their long-standing presence. Additionally, data limitations make it challenging to apply the BVIN algorithm to all financial products. The index derived from the BVIN algorithm can serve as a powerful supplement to traditional volatility algorithms.
In our study, we selected data from Apple stock options and VIX options for the year 2022 as samples, calculated the corresponding volatility indices, and then conducted a comprehensive analysis. The goal of this approach is to verify the feasibility of applying the BVIN algorithm to other financial products to calculate their volatilities. The contribution of this study lies in providing investors with deeper insights into VIX options and extending the existing volatility algorithms, thereby helping investors make better investment decisions in volatile markets.
2. Literature review
Volatility is incorporated into financial markets and has profound influences on the investment processes and on the resultant strategies for managing risks. The most widely internationally recognized index of volatility is the VIX, created by the Chicago Board Options Exchange [2]. It takes the moving average of the market’s expectations about up-to-30 days ahead of over-close volatility derived from S&P 500 option prices, and it has substantially been investigated for its effectiveness in forecasting market swings as well as the effectiveness of its usage in hedging portfolios during financial crises [2].
The fluctuations that are associated with Bitcoin have thus drawn much focus due to the hedge-like facility it possesses. In other words, they pointed out that the fluctuation of the price of Bitcoin is higher than that of established assets like equities. Alexander and Imeraj [1] have developed the hint Bitcoin Volatility Index, comparable to the VIX, which uses options prices to define implied volatility. They argue that both opportunities indicate that the implied volatility within Bitcoin can rise in the course of downtrends as well as uptrends, suggesting that adoption of elevated investor sentiment operating with uncertainty both in a bear and bull market environment, as mentioned by Alexander and Imeraj [1].
Similarly, there has been also a lot of research carried out concerning the relations between Bitcoin and traditional financial systems. Wang et al. [3], analysed the relationship between Bitcoin and the indices of the stock market, with a special reference to S&P500 and Dow Jones on the price of Bitcoins. Their studies show that while Bitcoin has some impact on the behaviour of the stock market, the opposite is also largely true due to stock market fluctuations having a great impact on cost fluctuations in Bitcoin. This correlation presents evidence that often, despite the advocates’ arguments that it is an altogether different kind of asset, Bitcoin moves in tandem with variations in main financial markets [3].
It has also been found useful in transmitting volatility across different sectors in understanding the financial contagion. In this line of research, Alamaren et al. [4] dissect the spill-over between cryptocurrencies and energy firms with the major US technology indices for the 2017 to 2022 period. By applying the analysis techniques developed by Diebold & Yilmaz, their work revealed that Apple and Microsoft were net volatility transmitters; Amazon and Tether were the net volatility receivers. This shows the correlation between Cryptocurrency and the technology sectors, especially during this unprecedented breakage such as the COVID-19 outbreak [4].
Additionally, the impact which large-scale geo-political events such as the Russo-Ukrainian War supports the idea that changes in the global financial markets have various considerations. According to Izzeldin et al. [5], the conflict has, to some extent, affected global financial markets in comparison to the financial crisis in 2008 and the COVID-19 pandemic. Combined, and most notably concerning wheat and nickel, which are essential exports for the belligerent countries, indicated substantial variability, thus demonstrating how supply-chain and geostrategic factors can amplify volatility transmission across sectors and global markets [5].
3. Method and data
The datasets for our analysis are the daily historical option trading data for Apple (AAPL), Bitcoin (BTC), and the VIX options throughout 2022, sourced from OptionsDX. The year 2022 was carefully chosen because, this year, numerous market events triggered heightened volatility, including the Terra Luna collapse, the ongoing impacts of the COVID-19 pandemic, and the outbreak of the Russia-Ukraine war. These events collectively contributed to significant fluctuations in the options market, making 2022 an ideal period for examining volatility dynamics.
To construct 30-day volatility indexes throughout 2022, we used the methodology for a single date introduced in the paper BVIN: The Bitcoin Volatility Index. The calculation process was achieved through Python coding. Although the methodology is primarily designed for Bitcoin, we innovated by additionally applying this method to AAPL and VIX options.
The algorithm used can be split into two parts, including Data Filtering and Volatility Index Calculation.
3.1. Data filtering
①Firstly, for each trading day, we identified two nearest options expiry dates that are closest to 30 days—one that’s just under 30 days, which we call Short Maturity (T1), and another that’s just over 30 days, called Long Maturity (T2).
②Then, we selected only Out-of-the-Money options with a strike price within the strike price range.
③After that, we performed a volume check to ensure the options we were working with were actively traded. For options with zero trading volume at the extreme ends of the strike price range, we simply excluded them. For options with missing or zero-volume entries within the selected range, we used linear interpolation to create a synthetic price from nearby strikes to maintain data continuity.
④Finally, we removed any outliers, which helped avoid skewed results caused by prices that deviate too much from the norm.
3.2. Volatility index calculation
① After data filtering, we calculated the Implied Variance for both maturities (T1 and T2) using
where
②Then, we interpolated between these two variances to obtain the 30-day Implied Variance using
Where the interpolation coefficient is
③Lastly, we converted this implied variance to the Volatility Index by annualizing it using
Through this methodology, we constructed the 30-day volatility index of three options for the entire year of 2022 and plotted the results into line graphs. Afterwards, we analysed the market events that occurred during periods of high index values and finally drew our conclusions.
4. Results and analysis
Using data on Bitcoin options, Apple stock options, and Vix options from OptionsDX and the BVIN algorithm, we obtained the BVIN, Apple stock volatility index, and VIX volatility index throughout 2022 and plotted them to conduct further analysis to see whether they effectively reflect market performance.
4.1. BVIN analysis
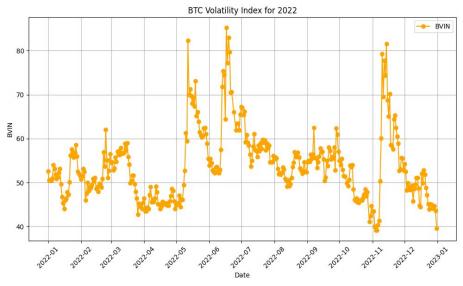
As shown in Figure 1, in 2022, the BVIN and Bitcoin prices exhibited strong volatility, largely driven by significant market events. The Russia-Ukraine conflict in February caused Bitcoin’s price to drop by over 12%, from $39,000 to $34,300, and BVIN surged by more than 15%, reflecting panic among investors. This period highlighted Bitcoin's failure to act as a safe-haven asset, instead moving in tandem with equity markets.
In May, the collapse of the Terra (LUNA) ecosystem further exacerbated this volatility. The Terra blockchain's crash, which resulted in a $50 billion market wipeout, led to a sharp decline in Bitcoin's price and heightened fear in the market, pushing BVIN higher [6]. This fear was compounded by the insolvency of the Celsius Network in June, which magnified the liquidity crisis within the cryptocurrency market.
By September, the Federal Reserve's 0.75% interest rate hike tightened liquidity and strengthened the U.S. dollar, leading to an increase in BVIN to around 60 as high-risk assets like Bitcoin faced pressure. This was a prelude to the collapse of the FTX exchange in November, which sent the BVIN soaring above 80, reflecting widespread panic selling. The downfall of FTX highlighted the fragility of centralized digital finance platforms, echoing the effects of earlier collapses like Terra [7].
These events underscore how geopolitical tensions, specific market shocks, and regulatory tightening shaped Bitcoin's volatility throughout the year.
4.2. Apple volatility index and VIX volatility index analysis
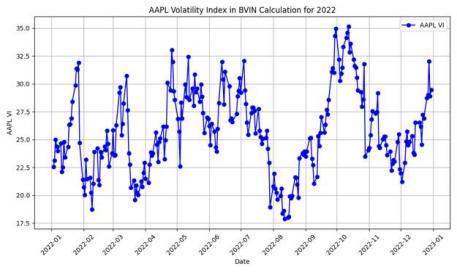
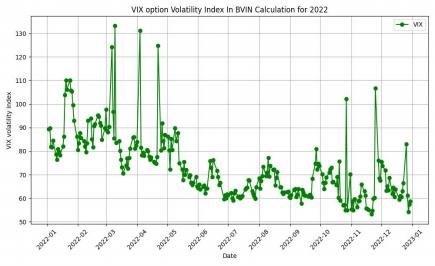
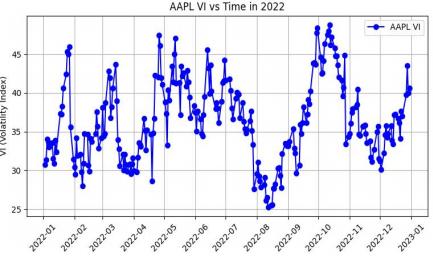
As shown in Figures 2 and 3, in early 2022, geopolitical tensions, including the Russia-Ukraine conflict, triggered widespread market volatility. The VIX index rose from 28 to 37.5, while Apple's stock price dropped from $165 to $150, primarily due to concerns over supply chain disruptions [8,9]. Apple's volatility was closely linked to macroeconomic factors, but the company demonstrated resilience by recovering in March, driven by strong cash flow and its dominant market position [8].
In May and June, both Apple and the VIX experienced significant volatility spikes due to inflation concerns and aggressive monetary tightening by the Federal Reserve. The 75-basis-point rate hike and supply chain issues in China led to a sharp rise in Apple's implied volatility [9,10]. Despite these challenges, Apple's volatility remained more company-specific, reflecting its dependence on China for manufacturing [8].
From September to December, the Apple Volatility Index spiked again due to further interest rate hikes and rising bond yields. Market expectations surrounding Apple's product launch in September caused additional volatility when performance did not meet expectations. In October, the company's earnings report revealed that iPhone sales had missed targets, leading to fluctuations in Apple's stock price, which fell from $170 to $130 [8].
4.3. Comparative analysis between the VIX volatility index and the VIX price
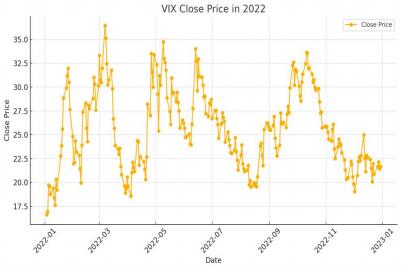
The reactivity and sensitivity of the VIX options market are closely tied to the actual behaviour of the VIX price itself(as shown in Figure 4). During 2022, the VIX exhibited noticeable volatility, largely driven by macroeconomic factors. In periods like February-March and October-November, the VIX price showed increased sensitivity to market events, leading to spikes in the BVIN-calculated volatility index. During periods of less dramatic VIX price movements, such as in May and June, there was relatively lower fluctuation in the VIX option volatility index.
4.4. Comparative analysis between the AAPL volatility indexes in two different methodologies
When comparing the AAPL volatility index in BVIN methodology to its traditional volatility index(as shown in Figure 5), the average value is slightly lower but with the same trend, this indicates that the BVIN methodology efficiently captures market uncertainty, despite not reflecting broader fluctuations as strongly.
Besides, during market stress, both indices show an increase in volatility, but BVIN reacts more specifically to downside risks due to its focus on out-of-the-money puts. Although BVIN tends to show lower overall volatility, it still captures investor fear related to potential price drops.
5. Conclusions
To conclude, by applying the BVIN methodology to Bitcoin as well as AAPL stock options and VIX options, we explored its broader applicability outside the cryptocurrency market. Our results demonstrated all three volatility indexes—BVIN, Apple stock Volatility and VIX Volatility—were influenced by significant macroeconomic factors like the Russia-Ukraine war, Federal Reserve interest rate hikes, and the collapse of major cryptocurrency platforms. In particular, the only use of OTM options in the BVIN method enables us to capture market fear and expectations of extreme price movements more acutely, compared to traditional volatility indices that rely on a broader spectrum of options, including both at-the-money (ATM) and in-the-money (ITM) options.
Consequently, Despite the distinct nature of each market, BVIN proved to be a versatile tool for assessing Volatility in Technology and Broader Market.
Acknowledgement
Jingyi Ma, Xinyi Wang, and Yuchen Hu contributed equally to this work and should be considered co-first authors.
References
[1]. Alexander, C. and Imeraj, A. (n.d.).BVIN: The Bitcoin Volatility Index. https: //www.cryptocompare.com/media/37621858/the-bitcoin-volatility-index-bvin-whitepaper.pdf?v3.
[2]. Moran, M.T. and Liu, B. (2020). The VIX Index and Volatility-Based Global Indexes and Trading Instruments - A Guide to Investment and Trading Features. SSRN Electronic Journal. doi: https: //doi.org/10.2139/ssrn.3668983.
[3]. Wang, X., Chen, X. and Zhao, P. (2020). The relationship between Bitcoin and stock market. International Journal of Operations Research and Information Systems, 11(2), pp. 22-35. doi: 10.4018/IJORIS.2020040102.
[4]. Amro Saleem Alamaren, Gokmenoglu, K.K. and Nigar Taspinar (2024). Volatility spillovers among leading cryptocurrencies and US energy and technology companies. Financial Innovation, 10(1). doi: https: //doi.org/10.1186/s40854-024-00626-2.
[5]. Liu, J., Makarov, I., & Schoar, A. (2023). Anatomy of a Run: The Terra Luna Crash. NBER Working Paper 31160. National Bureau of Economic Research. https: //doi.org/10.3386/w31160& #8203; : contentReference [oaicite: 1]{index=1}
[6]. Bkedowska-Sójka, B., & Castrovilli, P. (2023). FTX’s downfall and Binance’s consolidation: the fragility of Centralized Digital Finance. arXiv Preprint arXiv: 2302.11371. https: //doi.org/10.48550/arXiv.2302.11371& #8203; : contentReference [oaicite: 2]{index=2}
[7]. CBOE. (2022). CBOE Global Indices: VXAPL Index Dashboard. Cboe Global Markets. Retrieved from https: //www.cboe.com/products/volatility-indexes/vxapl
[8]. Cleveland Fed. (2022). The Impacts of Supply Chain Disruptions on Inflation. Federal Reserve Bank of Cleveland. Retrieved from https: //www.clevelandfed.org
[9]. FRED. (2022). CBOE Equity VIX on Apple (VXAPLCLS). Federal Reserve Bank of St. Louis. Retrieved from https: //fred.stlouisfed.org/series/VXAPLCLS
Cite this article
Ma,J.;Wang,X.;Hu,Y. (2025). Whether It Is Reasonable to Assess Volatility Index in Technology and Broader Market Using the BVIN Methodology. Advances in Economics, Management and Political Sciences,217,61-68.
Data availability
The datasets used and/or analyzed during the current study will be available from the authors upon reasonable request.
Disclaimer/Publisher's Note
The statements, opinions and data contained in all publications are solely those of the individual author(s) and contributor(s) and not of EWA Publishing and/or the editor(s). EWA Publishing and/or the editor(s) disclaim responsibility for any injury to people or property resulting from any ideas, methods, instructions or products referred to in the content.
About volume
Volume title: Proceedings of the 4th International Conference on Financial Technology and Business Analysis
© 2024 by the author(s). Licensee EWA Publishing, Oxford, UK. This article is an open access article distributed under the terms and
conditions of the Creative Commons Attribution (CC BY) license. Authors who
publish this series agree to the following terms:
1. Authors retain copyright and grant the series right of first publication with the work simultaneously licensed under a Creative Commons
Attribution License that allows others to share the work with an acknowledgment of the work's authorship and initial publication in this
series.
2. Authors are able to enter into separate, additional contractual arrangements for the non-exclusive distribution of the series's published
version of the work (e.g., post it to an institutional repository or publish it in a book), with an acknowledgment of its initial
publication in this series.
3. Authors are permitted and encouraged to post their work online (e.g., in institutional repositories or on their website) prior to and
during the submission process, as it can lead to productive exchanges, as well as earlier and greater citation of published work (See
Open access policy for details).
References
[1]. Alexander, C. and Imeraj, A. (n.d.).BVIN: The Bitcoin Volatility Index. https: //www.cryptocompare.com/media/37621858/the-bitcoin-volatility-index-bvin-whitepaper.pdf?v3.
[2]. Moran, M.T. and Liu, B. (2020). The VIX Index and Volatility-Based Global Indexes and Trading Instruments - A Guide to Investment and Trading Features. SSRN Electronic Journal. doi: https: //doi.org/10.2139/ssrn.3668983.
[3]. Wang, X., Chen, X. and Zhao, P. (2020). The relationship between Bitcoin and stock market. International Journal of Operations Research and Information Systems, 11(2), pp. 22-35. doi: 10.4018/IJORIS.2020040102.
[4]. Amro Saleem Alamaren, Gokmenoglu, K.K. and Nigar Taspinar (2024). Volatility spillovers among leading cryptocurrencies and US energy and technology companies. Financial Innovation, 10(1). doi: https: //doi.org/10.1186/s40854-024-00626-2.
[5]. Liu, J., Makarov, I., & Schoar, A. (2023). Anatomy of a Run: The Terra Luna Crash. NBER Working Paper 31160. National Bureau of Economic Research. https: //doi.org/10.3386/w31160& #8203; : contentReference [oaicite: 1]{index=1}
[6]. Bkedowska-Sójka, B., & Castrovilli, P. (2023). FTX’s downfall and Binance’s consolidation: the fragility of Centralized Digital Finance. arXiv Preprint arXiv: 2302.11371. https: //doi.org/10.48550/arXiv.2302.11371& #8203; : contentReference [oaicite: 2]{index=2}
[7]. CBOE. (2022). CBOE Global Indices: VXAPL Index Dashboard. Cboe Global Markets. Retrieved from https: //www.cboe.com/products/volatility-indexes/vxapl
[8]. Cleveland Fed. (2022). The Impacts of Supply Chain Disruptions on Inflation. Federal Reserve Bank of Cleveland. Retrieved from https: //www.clevelandfed.org
[9]. FRED. (2022). CBOE Equity VIX on Apple (VXAPLCLS). Federal Reserve Bank of St. Louis. Retrieved from https: //fred.stlouisfed.org/series/VXAPLCLS