


1. Introduction
Due to climate change, energy security, and air quality issues, electric vehicles (EVs) have once again attracted attention as a sustainable means of mobility. Especially when integrated with clean energy such as wind, solar, and hydro power. In 2014, the sales of EVs across the world exceeded 17 million, which accounts for more than 20 % of new car sales in the world [1]. In terms of individual countries, top sellers are China: more than 11 million EVs were sold in 2014, accounting for nearly half of the passenger car sales in China [1]. In contrast, the United States accounted for approximately 10 % of worldwide deliveries of battery electric vehicles in [2].
Along with low prices (average EV price around US 34400 against US 55200 in the U.S), government support practices increase, including such measures as purchase subsidies, tax exemptions, non-financial incentives like license plate benefits, and a mandatory amount of produced zero-emission vehicles on top of returning infrastructure frequency. Yet China incentivizes electric vehicles more than arguably anywhere else in the world-with some primary regional differences, of course. EVs are responsible for close to 40% of new car sales in Tier-1 cities like Beijing, Shanghai, and Shenzhen (compared with figures lower than 15% for several Tier-3 cities). These five cities combined have more than 55% of electric vehicles in the country [3,4].
The uneven development of electric vehicles in China poses several substantive questions: First, why has the reality of EVs progress been inconsistent, even though there is a push towards an alternative to traditional automotive propulsion? Second, which causes act as a main driving force in the development of electric vehicles? This article uses electric vehicle market data from different provinces in China to answer the above two questions. By analyzing regional economic circumstances, population metrics, government policies, and charging infrastructure together, it permits a more holistic view of owning an EV. The research findings not only offer an insight into why the Chinese electric vehicle market has been expanding, but also give useful policy suggestions towards better dispersing of electric vehicles across regions.
2. Literature review
As an emerging high-tech industry, the rapidly growing electric vehicle market has attracted increasing attention from scholars in different fields, and extensive research has been conducted on its determining factors. The existing research can be roughly divided into three categories: (1) economic, demographic, and policy factors; (2) Psychological and behavioral factors; (3) Method innovation and cross-border comparison.
2.1. Previous research
Economic, demographic, and policy factors mainly drive the spread of electric vehicles (EVs). For example, a state-level study in the U.S. (2003-2011) found that people are more likely to buy EVs when costs are lower and population density is higher. In other words, basic economic conditions and where people live really matter [5].
In China, a survey in Beijing shows something similar: gender, income level, and even whether someone has used an EV or an electric bicycle before can shape their willingness to buy an EV. Policies and Infrastructure-Subject of Equal Emphasis. The willingness to accept EVs can be promoted by subsidies, tax breaks, and the availability of charging infrastructure [6,7]. Only a few of the modeling studies (e.g., multi-criteria decision making or system dynamics models) note that government financial support and technological progress are important. However, many of these works mainly focus on a few variables so that they are not sufficient to explain the EV purchase behavior perfectly [8,9].
There are economic and policy reasons, but also psychological & behavioral ones. Research in conformity with the UTAUT-based genre shows that environmental consciousness, innovation acceptance, risk perceptions, and social influence also have non-negligible impacts on individuals' intention to purchase EVs regarding conventional vehicles [10]. In essence, in order to figure out how to get people into EVs, this paper cannot simply focus on economic and policy factors because this decision will be influenced by their disposition and everyday decisions.
New research also underscores the importance of how people study pipelines to EV adoption, and that different areas can be characterized by very different trends. County-level studies in the United States show that some tourism-dependent rural areas actually invest more heavily on charging infrastructure, for example. Therefore, their domestic EV sales increase faster than anywhere else [11-13]. More sophisticated techniques, like a synthetic population simulation, equilibrium modeling in bilateral markets and geographic information system (GIS)-based analysis further suggest that charging infrastructure availability at destination points together with workplace charging as well as frequent fast-charging opportunities are indispensable for EV uptake [10,11]. In addition, financial incentives and infrastructure are also found to drive the vehicle uptake in comparative studies across countries, although their effect may depend on each country’s way of institutional setting or culture [12].
In summary, this literature demonstrates that a complete picture of who is buying EVs will require the use of more varieties and sophisticated spatial-economic models sensitive to both geographic variation and behavioral effects.
2.2. Limitations and research gaps
Electric vehicle study is seriously deficient at the moment. First, the studies published in these journals are generally simple; they use only one or two useful factors. For example, a large number of studies selected only one or two provinces and cities as samples, so that the results are less representative [13]. Nonetheless, the concern is over both the provenance of that data and whether anything will be done with it. Some of the research data were from simulated experiments or sampling surveys rather than official statistics [6,14]. Another issue was that population-related ecosystem service assessment factors like economic activities, construction, and psychological stressors have been considered separately in some studies but rarely collectively addressed among them, simultaneously within a study, including this work [7]. Additionally, the patterns of adoption are highly context-specific due to large diversities in behaviour across cultures or institutions and spaces within a vast market like China (the fragile nature of transferring research results in different existing conditions is often forgotten) [12].
In an attempt to bridge these gaps, further exploratory work has been done and the following paper will investigate all such components systematically, including demographic characteristics, economic conditions, as well as Policies related to infrastructure development. That would be a framework even more applicable in China, far and away the world leader for electric vehicle adoption, but also one where regional disparities are vast.
3. Methodology
3.1. Data source
To fill in the corresponding research gaps identified from existing literature, data of various varieties are needed to allow for a holistic assessment of EV adoption and charging facilities expansion within China. Each type of data serves a specific purpose in capturing the drivers of EV adoption and the regional heterogeneity of infrastructure deployment.
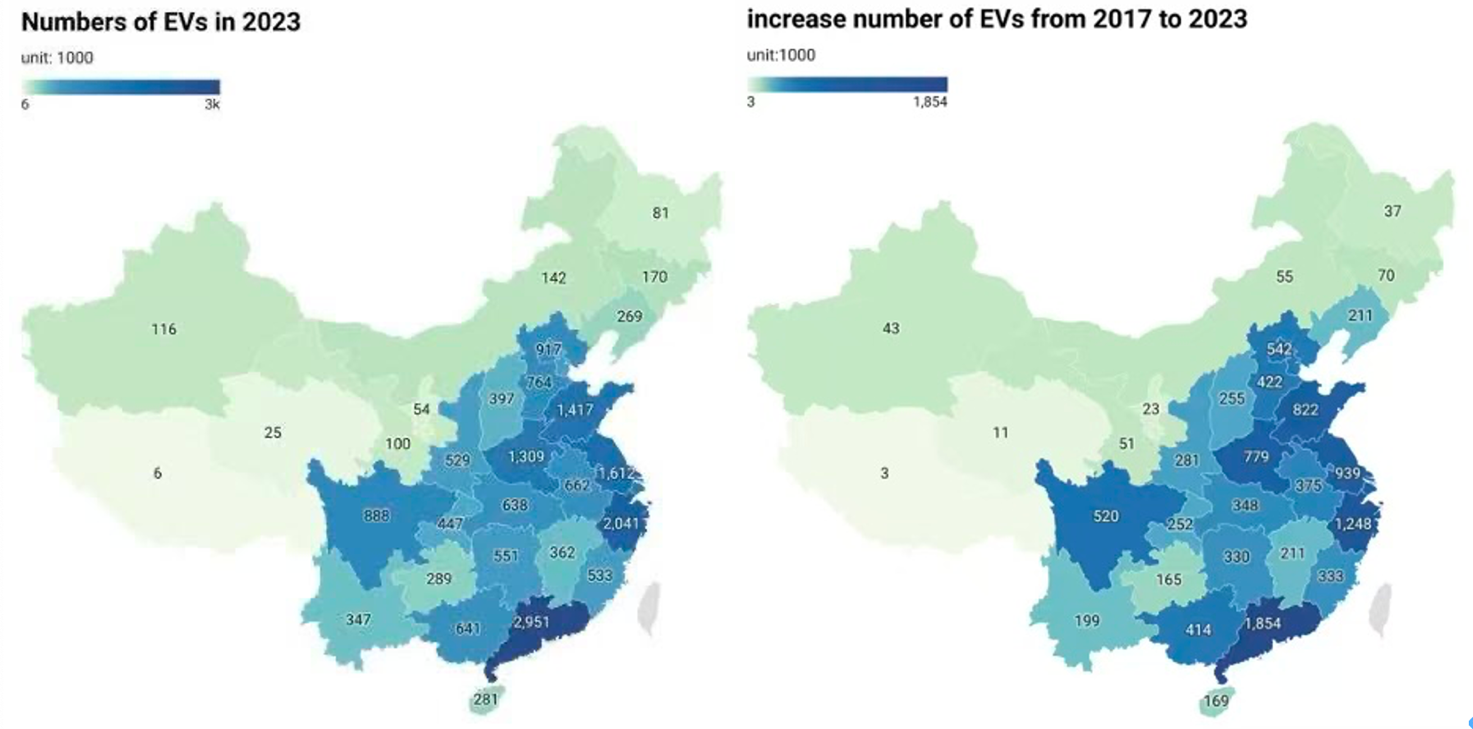
In Figure 1(a) and (b) show China’s rapid but uneven growth in electric vehicle (EV) adoption. Coastal provinces such as Guangdong and Zhejiang have the highest numbers, while inland and western regions lag, reflecting disparities in the EV market.
|
Category |
Data Source |
Time Coverage |
Key Variables |
|
EV Stock Data |
Ministry of Public Security of China |
2017-2023 |
Number of registered EVs (city-level) |
|
Charging Infrastructure Data |
China Electric Vehicle Charging Infrastructure Promotion Alliance (EVCIPA) |
2020-2024 |
Number of public charging piles, charging stations, and shared private piles (provincial-level) |
|
Population and Demographic Data |
Seventh National Population Census of China |
2020 |
Age structure, educational attainment, urbanization rate |
|
Economic Data |
Official Government Statistical Reports |
2017-2023 |
Provincial GDP and GDP per capita |
|
Policy Variables |
Official Government Documents |
2017-2023 |
Dummy variable (1 = policy implemented, 0 = not implemented) |
Table 1 provides an overview of the datasets used in this study, including information on EV stock, charging infrastructure, demographic, economic, and policy variables.
3.2. Variable construction
In this study, this paper constructs both the dependent variable and a set of explanatory variables at the provincial level. All variables are aligned by province to be analyzed.
EV Adoption (Y): This paper measures EV adoption using the number of electric vehicles in 2023, as reported in the EV data table. The data are aggregated at the provincial level using the “Province” field and aligned with the 2020 resident population from the Population sheet. The dependent variable is defined as the number of EVs per 10,000 residents:
This captures the EV penetration rate in each province, expressed in units of “vehicles per 10,000 people.”
Population Size (X1): Derived directly from the provincial resident population in the Population sheet. To reduce potential scale effects in regression, this paper takes the natural logarithm:
Age Structure (X2: Old-age and Youth Dependency Ratio): Calculated from the Age Composition sheet, which reports the shares of 0-14, 15-59, 60+, and 65+ age groups. This paper merges the 60+ and 65+ groups into a single 60+ category and computes the old-age and youth dependency ratio as:
This ratio reflects the economic burden on the working-age population.
Urbanization Level (X3): Using the Urban Population sheet, this paper retains the 2020. urbanization rate as urban_ratio. Additionally, the relative growth from 2010 to 2020 is calculated as:
This captures the pace of urbanization over the past decade.
Education Index (X4): Based on the Education sheet, which reports the number of people with tertiary, secondary (including vocational), and junior secondary education per 100,000 population. This paper constructs a weighted index:
This index approximates the provincial accumulation of human capital.
Per Capita GDP (X5): Extracted from the Per Capita GDP sheet. This paper selects the latest available year (2024) and takes the natural logarithm to standardize the scale:
Charging Infrastructure (X6): This paper utilizes 2023 data from the Charging Piles sheet, which includes information on public and shared private charging piles. At the provincial level, this paper calculates:
Policy Intensity (X7): Derived from the Policy sheet, where each policy is coded 0 or 1, where 0 indicates that a policy does not exist in a particular region, and 1 suggests that a policy exists. Policy intensity, which measures the power of government support by province, is the sum of all implemented policies.
Finally, all 7 variables are merged at province level to form the modeling dataset. Columns: The dependent variable Y and explanatory variables X1-X7, Rows: each row represents a province.
This paper uses the regions (31 provinces of China) as a case study to analyze the relationship between all seven independent variables and the electric vehicle (EV) ownership per 10,000 people. To systematically evaluate the determinants of EV adoption, this paper employed a combination of linear, regularized, and machine-learning models. Specifically, this paper applied Ordinary Least Squares (OLS), Least absolute shrinkage and selection operator (LASSO), Ridge regression, Principal Component Regression (PCR), Random Forest, and XGBoost. To ensure robustness and generalizability, all models are evaluated using a five-fold cross-validation (CV).
3.3. Method introduction
OLS regression: The OLS method represents the controlled model that offers people interpretable estimates of coefficients, effectively indicating marginal effect sizes and their significance between demographic/economic/educational/infrastructural/policy variables on EV adoption.
LASSO Regression: The LASSO method adds a penalty term of absolute coefficients, which makes the regression coefficient zero and performs variable selection. It discriminates the significant factors behind EV adoption by removing other ones in case of multicollinearity.
Ridge Regression Ridge regression serves as a counterpart to LASSO towards stabilizing binning of small sample sizes. It will not kill the coefficient of large samples (compared with LASSO where features are set toward 0) by introducing an L2 penalty, which shrinks coefficients but does not shrink them to zero, including zero000 thresholds, thus resolving multicollinearity issues among variables, such as population size, GDP per capita, or urbanization, so that the author could have more stable estimation.
Principal Component Regression (PCR): The PCR offers a denoising procedure by considering orthogonal principal components of the input data as features and then regressing these on all the inputs after dimensionality reduction. This will help in reducing data redundancy and make it robust against multicollinearity.
Random Forest: Random Forest predicts by averaging across multiple decision trees, allowing it to capture nonlinear relationships and higher-order interactions. For example, the effect of policy may depend on the level of economic development or urbanization, which Random Forest can reveal. In addition, it provides variable importance measures to assess the relative contribution of each factor.
XGBoost: XGBoost is a gradient boosting algorithm where multiple regression trees are built iteratively, aiming to minimize the prediction error and control model complexity by regularization. Because it remains powerful even with modest sample sizes and is capable of capturing nonlinear patterns, higher-order interactions, and leading to better predictive performance.
4. Results and discussion
In this section, a detailed overview of the model estimation results is presented, and this paper then examines how well linear and non-linear approaches predict EV uptake across provinces. In addition to providing the statistically significant determinants, the results give insights into stability, relevance, and complexity of interaction effects on key explanatory factors across different models.
4.1. OLS regression
Baseline Model: Ordinary Least Squares (OLS) regression, to project the linear relationship between EV ownership and all explanatory variables in total. An overview of estimated coefficients, standard errors, t-values, and significance levels is given for Table 2.
|
Variable |
coefficient |
Std. |
t value |
p value |
|
(Intercept) |
646 |
1578 |
0.41 |
0.686 |
|
charger_density |
6.64 |
1.91 |
3.48 |
0.002 |
|
edu_index |
0.0110 |
0.00439 |
2.51 |
0.021 |
|
urban_ratio |
4.34 |
3.53 |
1.23 |
0.233 |
|
urban_growth |
205 |
237 |
0.86 |
0.398 |
|
gdp_log |
-82.1 |
82.9 |
-0.99 |
0.334 |
|
dep_ratio |
195 |
350 |
0.56 |
0.583 |
|
policy |
-14.3 |
32.3 |
-0.44 |
0.663 |
|
pop_log |
-12.0 |
25.4 |
-0.47 |
0.641 |
|
public_ratio |
-240 |
1301 |
-0.18 |
0.856 |
The OLS results indicate that charger density and education index have a significant positive impact on EV adoption at 5% significance level. At the same time, other variables, including GDP, policy intensity, population size, dependency ratio, and urbanization indicators, are not statistically significant at 5% significance level. Diagnostic checks suggest that multicollinearity is generally manageable (variance inflation factor (VIFs) of most factors < 8), although the urbanization ratio exhibits a VIF of approximately 10.4, indicating potential correlation with urban growth. Also, Breusch-Pagan tests show no evidence of heteroscedasticity. Cross-validation using 5-fold CV gets an root mean square error (RMSE) of 90.1, highlighting that while OLS provides straightforward interpretability, its predictive accuracy is relatively limited.
4.2. LASSO regression
However, to mitigate the limitations of OLS regression, three regularization regression methods were carried out. The L1 penalty of the LASSO technique was used to automatically select a few important features, and thus most coefficients were reduced to zero except for three key variables: charger density, urbanization rate (UR), and education index. This finding more succinctly and robustly supports that infrastructure, level of urbanization, and educational development play a vital role in promoting EV uptake (Table 3).
|
Variable |
Coefficient |
|
(Intercept) |
-283 |
|
charger_density |
3.54 |
|
urban_ratio |
1.00 |
|
edu_index |
0.0101 |
This prevents against collinearity, reducing the effects of some coefficients by applying an L2 penalty in Ridge regression and shrinking all to a similar scale coefficient without setting them to zero. The results showed that the Dependency Ratio and Public Transport Mode Share had much larger positive coefficients in the dependency ratios, while Fund and Charger Density were relatively consistently positively influential. This process of filtering collinearity by reducing the dimensionality is called Principal Component Regression, and it is performed equivalently to Ridge regression.
Summary of LASSO results highlighting charging infrastructure, urbanization, and education as key factors for EV adoption. It is less useful than OLS for understanding the relationship between features and prediction; however, with a 5-fold CV RMSE of 76.6, it has good predictive performance outside of feature space (and thus generalizes well to new data) while at the same time offering parsimony in terms of its complexity constituent variables.
4.3. Ridge regression
Ridge regression allows for L2 shrinkage across all variables to mitigate questions of multicollinearity while keeping all predictors. Key variables with notable influence include dep_ratio (146), public_ratio (135), gdp_log (-57), and charger_density (4.6). This model gets an RMSE of 75.3, slightly better than LASSO. Ridge indicates that while linear relationships also convey nontrivial information, the predictive efficacy of a single variable can be fairly unstable and thus regularization is necessary.
4.4. Principal Component Regression (PCR)
The principal component is an algorithm in which this paper extracts the main data of the unsupervised variables and thereby reduce their dimension. Cross-validation over eight components is determined to be the best trade-off, with an RMSE of 75.3. By managing multicollinearity, PCR reduces variance in the model compared to Ridge, but also achieves a level of performance that is only marginally worse (those two are significantly better than OLS).
4.5. Random Forest
Random Forest was tuned using 5-fold CV to determine the optimal number of variables at each split (mtry = 7). Table 4 shows the top five most important variables.
|
variable |
importance |
|
edu_index |
100 |
|
urban_ratio |
96.2 |
|
urban_growth |
63.3 |
|
charger_density |
50.2 |
|
dep_ratio |
15.7 |
Random Forest achieves the lowest RMSE of 63.9 among all models, highlighting the nonlinear effects and interactions between education, urbanization, and charging infrastructure that linear models cannot fully capture.
4.6. XGBoost
XGBoost was optimized via grid search over learning rate, tree depth, and iteration rounds. It is eta = 0.1, a tree with depth 2-3, and up to 50-100 iterations. As a result, the 5-fold CV RMSE is 68.1, which is slightly worse than Random Forest but still well above linear and regularized models, confirming the robustness of the three key predictors.
4.7. Comparative model performance
Table 5 summarizes 5-fold cross-validation RMSE across all models.
|
model |
RMSE |
|
comments |
|
Random forest |
63.9 |
0.755 |
Best prediction, clear variable importance |
|
XGBoost |
68.1 |
0.649 |
Robust fitting |
|
Ridge |
75.3 |
- |
Regularized, moderate error |
|
PCR |
75.3 |
- |
After dimensionality reduction, stable as Ridge |
|
LASSO |
76.6 |
- |
Sparse model, clear variable selection |
|
OLS |
90.1 |
0.706 |
Intuitive, but highest error |
As can be seen from Table 5, the lowest RMSE corresponds to Random Forest-63.9-so it has the best predictive accuracy among all models. XGBoost is the next best model, with a bit higher RMSE of 68.1, outperforming linear and regularized models, which suggests that nonlinear ensembles are more powerful in modeling complex relationships between the adoption of electric vehicles and the explanatory variables. In turn, Ridge and PCR have the same RMSE of 75.3, which means that regularization and dimensionality reduction stabilize predictions but cannot fully explain the nonlinear patterns of data. LASSO, improving interpretability thanks to variable selection, has an RMSE of 76.6, whereas OLS exhibits the largest RMSE, 90.1, reflecting limitations of standard linear regression to deal with multicollinearity and interactions. What can be emphasized from this table is that nonlinear models not only yield better predictive performance but also shed light on the partial importance of core variables, such as charging infrastructure and education-urbanization indicators.
4.8. Results
It only points out that the development of charging infrastructure, educational attainment, and urbanization are uniform and stable predictors of EV adoption. Linear models, Ridge Class regression model, and PCR present interpretable coefficients, quantifying the marginal influences of these factors. In particular, through OLS, it could be shown that determination in charging pile density and education index is a statistically significant positive driving force. LASSO identifies charger density, urban-to-total ratio, and the addition of the education index as the sole non-zero coefficients. The Ridge regression and principal component regression show that the estimation results can be stabilized by regularization and dimensionality reduction when there is multicollinearity, even though their predictive accuracy is just average.
Random Forest and XGBoost, nonlinear composite methods, produce very good predictive results with RMSE of 63.9 and 68.1. In addition to the minimum prediction error, random forests also provide educated ranking outputs: public education, changing into an urban state, and increasing Urban area growth and commuting density are given with predominant contributions as well-designed nonlinear relationships among driving determinants. The XGBoost validates these findings with slightly less accurate results but still very strong ones. In each case, the model has limited explanatory power, with GDP, population, and policy intensity losing in importance among them all. The findings demonstrate that infrastructure and demographic characteristics are just as important, if not more so, than economic or policy-based factors.
5. Conclusion
The results of this research repeatedly find charging infrastructure, educational attainment, and signs of urbanization to be the most reliable determinants for the demand side with regard to electric vehicles. It seems these factors are rather stable among different modeling approaches, both linear and nonlinear ones-meaning that they do contribute to a great extent in increasing demand of EVs; The considered variables (economic size, people or policies) explain very little of this-suggesting that people should look at other types of explanatory mechanisms than pure economy or regulation in order to understand which structural and socio-demographic conditions are leading the adoption.
The implications for policy and theory have been appropriately acknowledged in the research. In the policy context, this result directly contributes to guiding charging station prioritization in Beijing's satellite cities (and not only the capital), new energy top-down environmental education course formulation, and a bundled urban planning scheme for district or prefectural level sustainable development. Combining linear and nonlinear modeling frameworks provides unique value for the analysis of technology adoption dynamics because it allows tracking down direct effects as well as complex interactions between key factors.
Regardless of these inputs, the research was found to have inadequacies. Analysis using the provincial cross-section data may not be the best way to capture individual-level behavior or temporal shifts. The data, for further research, may be prolonged longitudinally or use Surveys at the micro level and additional socio-economic as well as environmental variables to have deeper insights into adoption. Additionally, structural or experimental approaches can be used to study causal mechanisms and make the findings more robust and translatable into practice.
This work contributes to the overall discussion on factors affecting EV in its own world by delivering a complete assessment of them, defining suitable natural variables for decision-makers, and laying the foundations for additional exploratory research responsible for this matter.
References
[1]. International Energy Agency. (2025) Global EV Outlook 2025. https: //www.iea.org/reports/global-ev-outlook-2025/trends-in-electric-car-markets-2.
[2]. Irfan, D. and Tang, X. (2025) Evaluating China’s Electric Vehicle Adoption with PESTLE: Stakeholder Perspectives on Sustainability and Adoption Barriers. Sustainability, 17(14), 6258.
[3]. Soltani-Sobh, A., Heaslip, K., Stevanovic, A., Bosworth, R. and Radivojevic, D. (2017) Analysis of the Electric Vehicles Adoption over the United States. Transportation Research Procedia, 22, 203-212.
[4]. Ling, Z., Cherry, C.R. and Wen, Y. (2021) Determining the Factors That Influence Electric Vehicle Adoption: A Stated Preference Survey Study in Beijing, China. Sustainability, 13(21), 11719.
[5]. Coffman, M., Bernstein, P. and Wee, S. (2017) Electric vehicles revisited: a review of factors that affect adoption. Transport Reviews, 37(1), 79-93.
[6]. Liu, H.C., You, X.Y., Xue, Y.X. and Luan, X. (2017) Exploring critical factors influencing the diffusion of electric vehicles in China: A multi-stakeholder perspective. Research in Transportation Economics, 66, 46-58.
[7]. Liu, D. and Xiao, B. (2018) Exploring the development of electric vehicles under policy incentives: A scenario-based system dynamics model. Energy Policy, 120, 8-23.
[8]. Helveston, J.P., Liu, Y., Feit, E. M., Fuchs, E., Klampfl, E. and Michalek, J.J. (2015) Will subsidies drive electric vehicle adoption? Measuring consumer preferences in the U.S. and China. Transportation Research Part A: Policy and Practice, 73, 96-112.
[9]. Wang, D., Ozden, M. and Tsang, Y.P. (2023) The impact of facilitating conditions on electric vehicle adoption intention in China: An integrated unified theory of acceptance and use of technology model. International Journal of Engineering Business Management, 15.
[10]. Sierzchula, W., Bakker, S., Maat, K. and Van Wee, B. (2014) The influence of financial incentives and other socio-economic factors on electric vehicle adoption. Energy Policy, 68, 183-194.
[11]. Winikoff, J.B. (2024) Economic specialization, infrastructure, and rural electric vehicle adoption. Energy Policy, 195, 114380.
[12]. Ma, H., He, B.Y., Kaljevic, T. and Ma, J. (2024) A Two-sided Model for EV Market Dynamics and Policy Implications. Working paper.
[13]. Asensio, O.I., Buckberg, E., Cole, C., Heeney, L., Knittel, C.R. and Stock, J.H. (2024) Charging Uncertainty: Real-Time Charging Data and Electric Vehicle Adoption. Working paper.
[14]. Yuan, H., Ma, M., Zhou, N., Deng, Y., Liu, J. and Zhang, S. (2024) Planning for future EV charging infrastructure: A city-scale assessment. Working paper.
Cite this article
Xie,H. (2025). What Factors Influence the EV Adoption in China: National Case Analyses. Advances in Economics, Management and Political Sciences,247,1-11.
Data availability
The datasets used and/or analyzed during the current study will be available from the authors upon reasonable request.
Disclaimer/Publisher's Note
The statements, opinions and data contained in all publications are solely those of the individual author(s) and contributor(s) and not of EWA Publishing and/or the editor(s). EWA Publishing and/or the editor(s) disclaim responsibility for any injury to people or property resulting from any ideas, methods, instructions or products referred to in the content.
About volume
Volume title: Proceedings of CONF-BPS 2026 Symposium: GenAI, Labour Markets, and the Economics of Human and Financial Capital
© 2024 by the author(s). Licensee EWA Publishing, Oxford, UK. This article is an open access article distributed under the terms and
conditions of the Creative Commons Attribution (CC BY) license. Authors who
publish this series agree to the following terms:
1. Authors retain copyright and grant the series right of first publication with the work simultaneously licensed under a Creative Commons
Attribution License that allows others to share the work with an acknowledgment of the work's authorship and initial publication in this
series.
2. Authors are able to enter into separate, additional contractual arrangements for the non-exclusive distribution of the series's published
version of the work (e.g., post it to an institutional repository or publish it in a book), with an acknowledgment of its initial
publication in this series.
3. Authors are permitted and encouraged to post their work online (e.g., in institutional repositories or on their website) prior to and
during the submission process, as it can lead to productive exchanges, as well as earlier and greater citation of published work (See
Open access policy for details).
References
[1]. International Energy Agency. (2025) Global EV Outlook 2025. https: //www.iea.org/reports/global-ev-outlook-2025/trends-in-electric-car-markets-2.
[2]. Irfan, D. and Tang, X. (2025) Evaluating China’s Electric Vehicle Adoption with PESTLE: Stakeholder Perspectives on Sustainability and Adoption Barriers. Sustainability, 17(14), 6258.
[3]. Soltani-Sobh, A., Heaslip, K., Stevanovic, A., Bosworth, R. and Radivojevic, D. (2017) Analysis of the Electric Vehicles Adoption over the United States. Transportation Research Procedia, 22, 203-212.
[4]. Ling, Z., Cherry, C.R. and Wen, Y. (2021) Determining the Factors That Influence Electric Vehicle Adoption: A Stated Preference Survey Study in Beijing, China. Sustainability, 13(21), 11719.
[5]. Coffman, M., Bernstein, P. and Wee, S. (2017) Electric vehicles revisited: a review of factors that affect adoption. Transport Reviews, 37(1), 79-93.
[6]. Liu, H.C., You, X.Y., Xue, Y.X. and Luan, X. (2017) Exploring critical factors influencing the diffusion of electric vehicles in China: A multi-stakeholder perspective. Research in Transportation Economics, 66, 46-58.
[7]. Liu, D. and Xiao, B. (2018) Exploring the development of electric vehicles under policy incentives: A scenario-based system dynamics model. Energy Policy, 120, 8-23.
[8]. Helveston, J.P., Liu, Y., Feit, E. M., Fuchs, E., Klampfl, E. and Michalek, J.J. (2015) Will subsidies drive electric vehicle adoption? Measuring consumer preferences in the U.S. and China. Transportation Research Part A: Policy and Practice, 73, 96-112.
[9]. Wang, D., Ozden, M. and Tsang, Y.P. (2023) The impact of facilitating conditions on electric vehicle adoption intention in China: An integrated unified theory of acceptance and use of technology model. International Journal of Engineering Business Management, 15.
[10]. Sierzchula, W., Bakker, S., Maat, K. and Van Wee, B. (2014) The influence of financial incentives and other socio-economic factors on electric vehicle adoption. Energy Policy, 68, 183-194.
[11]. Winikoff, J.B. (2024) Economic specialization, infrastructure, and rural electric vehicle adoption. Energy Policy, 195, 114380.
[12]. Ma, H., He, B.Y., Kaljevic, T. and Ma, J. (2024) A Two-sided Model for EV Market Dynamics and Policy Implications. Working paper.
[13]. Asensio, O.I., Buckberg, E., Cole, C., Heeney, L., Knittel, C.R. and Stock, J.H. (2024) Charging Uncertainty: Real-Time Charging Data and Electric Vehicle Adoption. Working paper.
[14]. Yuan, H., Ma, M., Zhou, N., Deng, Y., Liu, J. and Zhang, S. (2024) Planning for future EV charging infrastructure: A city-scale assessment. Working paper.