


1. Introduction
Following the strong rebound of the global economy in 2021, due to the impact of the epidemic, international conflicts, wars and the huge debt bubbles, coupled with the intensification of the macro factors such as inflation, the inequality of debt and income, the overall trend of the global economy has changed. It has a huge impact on the international situation, economic trade and foreign investment, and continues to ferment globally. Based on the current market situation, the study examines the performance of investment portfolios under different investment strategies, combined with the development of the industry in which individual stocks are located, to further identify investment options that are more suitable for volatile markets.
The strategies chosen for this paper are common hedge fund strategies that have been analyzed in detail by many market participants. There is an argument here that a market neutral strategy looks for uncorrelated investments and looks for portfolios that perform differently under given market conditions. All market-neutral strategies benefit from the relationship between the long and short elements of the portfolio, whether that relationship occurs within the portfolio or within the instrument itself [1]. Another article argues that managers who are not keen to take systemic risk at any time can be considered market-neutral managers. During a downturn, they profit when their short positions appreciate faster than their long positions fall in value [2]. For momentum strategies, an article demonstrates that momentum is often more profitable on the long side than on the short side, and that both price and earnings momentum margins are important, and that the combined use of price and earnings momentum can yield greater economic profits. There is no significant difference in the profitability of momentum strategies in rising and falling markets, and price action is very useful in portfolio management [3]. However, there is a study that suggest momentum strategies remain risky, exhibiting rare but large losses due to the dynamics of equity leverage in momentum portfolios. When the economy is in a state of hidden turmoil associated with stock market downturns and volatility, portfolios short leverage becomes high, behaving similarly to call options in market index portfolios, making momentum strategies more likely to crash [4]. Fundamental analysis or technical analysis can be used to analyze securities in the capital market. However, technical analysis is more complicated, and small institutions or individual investors prefer to choose fundamental analysis. Among them, investors emphasize the price-earnings ratio to understand the future development of the company, and the PEG ratio is effectively revised since the price-earnings ratio [5]. There are many proponents of the EPG ratio in the market who argue that the ratio assumes that short-term growth forecasts reflect the long-term future, considers differences in short-term earnings growth, and provides a better ranking based on the P/E ratio [6]. An academic study shows that since March 2020, the impact of the corona-virus outbreak on black swan events has become more and more significant, and investors have limited investment opportunities. From a market-wide perspective, some stocks in sectors such as consumer staples, healthcare, telecommunications, and energy are in focus [7]. Research has also found that during most stock market crashes, there are both short- and long-term momentum effects on stock returns [8]. In addition, some analysts believe that the synchronization of stock returns is positively related to analysts' forecasting activities, which is consistent with the increase of industry-level price information by analysts through industry information transmission [9]. In addition, some studies believe that China is one of the largest and most potential markets in the world, and a powerful company like Tencent has very good prospects in terms of development and profitability [10]. As the pillar industry of China's economic development, the real estate industry has played an important role in supporting the economic lifeline, so the analysis of the profitability of the real estate industry is also worthy of attention [11].
Based on the global economic recession and turbulent market situation, this paper selects 6 representative company stocks from different industries and constructs 3 investment portfolios through different strategies. First, long the Peabody Energy which is the representative company of energy industry especially in coal resource, also held a short position in the Internet company with Tencent for hedging. The strategy was selected as the momentum strategy, and the investment income was 20.4740%. Second, under the core logic of the market neutral strategy, build an investment portfolio with beta close to 0. Here, this paper chooses to hold a long position in the monkeypox concept stock -- Siga Technologies, and at the same time short Longfor Group, which is a real estate company listed in Hong Kong. This portfolio has a beta of 0.37 and the return reaches 16.9609%. Third, judging the market value and the company's actual stock value through the PEG ratio as the core investment concept, choosing to be long FedEx, which is in the delivery express industry, and short Zoom which is online video calling platform that has been popular in the past two years, constructed a return of 12.4633 % of the portfolio.
2. Method
2.1. Investment Strategy
Momentum strategy. First is the momentum strategy refers to the historical performance of stock prices, stocks with higher early yields will still outperform stocks with low early yields, so when constructing investment portfolios, it is usually based on “chasing up and selling down”. For this strategy, investors conduct current market segments and research based on the performance of stocks and futures historical data. In other words, if the historical data has performed well, the underlying stock will also perform well in predicting the next time period.
The advantage is that the momentum strategy is a relatively simple method of consideration, that is, by observing market fluctuations, investors can clearly grasp the technical indicators of market momentum. The disadvantage is that the calculation method of the momentum strategy is too simple, only considering the price changes. Since only the price difference is used to measure the momentum of the market, there is no fundamental range.
Market neutral strategy. Secondly, the market neutral strategy is an investment strategy that builds long and short positions to hedge beta market risks and can obtain stable returns regardless of whether the market is rising or falling. It is generally believed that building a portfolio with a beta close to 0 can meet the requirements of a market-neutral strategy.
There are several advantages of a market neutral strategy: first, it can provide a diversified investment portfolio; second, the market neutral strategies have low risk and the same performance under different market conditions for the different portfolio; third, the asset portfolio constructed according to the market-neutral strategy has little correlation with other asset classes and has little impact on the market; forth, as transaction costs decrease, profit margins increase [12].
However, the market neutral strategy is not risk-free arbitrage. The selection of long and short positions in an asset portfolio depends on the subjective judgment of hedge fund managers. Once there is an error in judgment, or the performance of long stocks is worse than that of short stocks, this strategy may cause significant losses.
PEG ratio. Thirdly, the PEG Ratio is a company's price-earnings ratio divided by the company's earnings growth rate. The PEG Ratio = 1, the stock value matches the growth potential, and the valuation is reasonable; The PEG Ratio > 1, the value of the stock may be overvalued, or the market believes that the company's performance growth will be higher than the market's expectations. Generally, the PEG of growth stocks will be higher than 1, or even above 2. Investors are willing to give them a high valuation, indicating that the company is likely to maintain rapid performance growth in the future; The PEG Ratio < 1, either the market has underestimated the value of the stock, or the market believes that its performance growth may be worse than expected. Value stocks typically have PEGs below 1 to reflect expectations of low earnings growth.
The PEG ratio is mainly applicable to industries and companies with stable performance growth and low leverage, such as consumer and pharmaceutical. It is not suitable for cyclical stocks with large performance fluctuations, such as agriculture, non-ferrous metals and infrastructure industries, nor for high-debt industries, such as banking, real estate, and insurance industries.
The advantage of this strategy is that it makes up for the inadequacy of the PE ratio on the company's growth valuation. The disadvantage is that it can only assist in judging the relative level of stock price and value but cannot judge the company's operation and asset quality.
2.2. Data of Industry and Company
The following data section selects the S&P 500 for trend comparison. Figure 1 is the trend graph of the S&P 500 this year, which mainly fluctuates between 4,000 and 5,000 points, showing a slight downward trend.
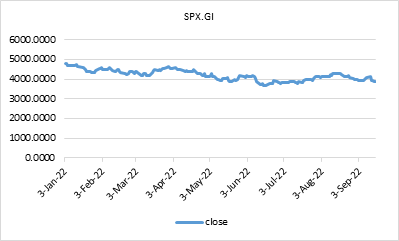
Figure 1: S&P 500 Index chart from 3-Jan-2022 to 3-Sep-2022.
Source: Wind [13]
Based on the current macro situation, combined with the industry, first, the conflict between Russia and Ukraine directly leads to the tight supply of international coal, which indirectly increases the demand for coal use. From the analysis of trade flow, European coal imports mainly come from Russia and the Americas. After the start of the Russian-Ukrainian war, the EU imposed sanctions on Russian trade exports. From August 2022, the EU's ban on coal imports from Russia has officially taken effect. Judging from past data, as Figure 2, the EU will import about 90, 000, 000 tons of coal in 2020, mainly from Russia (46.7%), the United States (17.7%), Australia (13.7%), Colombia (8.2%), South Africa (2.8%) and other countries [14].
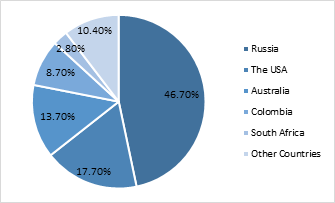
Figure 2: Distribution map of European coal imports.
Source: Zhongtai Securities [14]
Among them, the dependence on Russian coal imports is the highest. In order to meet the coal import gap from Russia after the ban takes effect, it is expected that the EU will increase its procurement of other international coal such as the United States and Australia. Under multiple factors, international coal prices continued to rise, and demand was supported strongly.
Peabody Energy Corporation (Peabody Energy), the world's largest privately-owned coal company, was listed on the New York Stock Exchange in 1949 (NYSE: BTU) and owns in 26 mining operations in the United States and Australia. As a coal concept stock, in addition to the mining business, Peabody Energy also sells, brokers and trades coal. Figure 3 shows the stock price trend of Peabody Energy since the beginning of this year. It is not difficult to see that although there are some fluctuations, the overall trend is upward. Stock price of Peabody Energy are up 145% this year, compared to Figure 1, the stock price is very impressive.
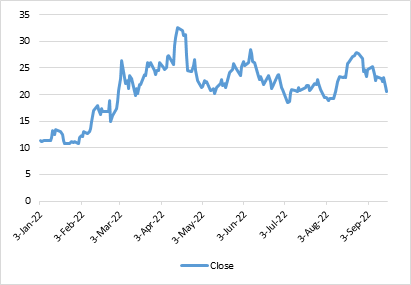
Figure 3: The close price chart of Peabody Energy.
Source: Yahoo Finance [15]
Second, in the early days of the covid-19 outbreak, countries took "breakdown" to stop the spread of the epidemic between cities, all companies and schools started working and learning from home. For most companies, they will not pay to purchase and use complex conference systems because of a sudden epidemic. In order to meet the needs of classes, schools only need basic online conference functions, and will not increase costs. At this time, a company became their first choice, which is Zoom Video Communications, Inc. (Zoom). With its core business, Zoom firmly seized the opportunity of online meetings and doubled its revenue, but it was also accompanied by a certain degree of development pressure. Since the beginning of the epidemic, the global video meeting market has been dominated by Zoom and Microsoft Teams, the Chinese market is basically dominated by Tencent Meetings. According to the data, from 2020 to 2021, Zoom's market share will increase from 26.4% to 48.7%, and the market share of Microsoft Teams will increase from 9.7% to 14.5% [16]. The usage of other platforms is shown in Figure 4.
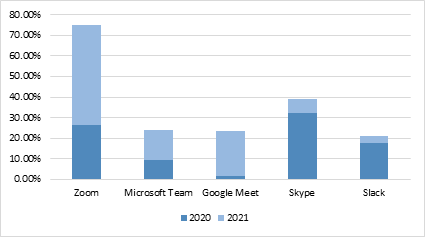
Figure 4: The market shares of video calling platform.
Source: Digital Information World [16]
Compared with Microsoft, which has a complete product ecosystem and customer base of Office, and can use Microsoft 365 for a bundled sales strategy, Zoom has obvious competitive disadvantages. However, due to the high reliability and stability of the video meeting services, it still has a priority of most enterprises and institutions and has a relatively high customer stickiness. Affected by this, Zoom's share price has continued to decline since the beginning of this year, from $180 per share to $80 per share. The trend is shown in Figure 5, with a decline of about 44.44%. But whether it can continue to consolidate institutional users in the future depends on the success of Zoom's transformation to the Business-side.
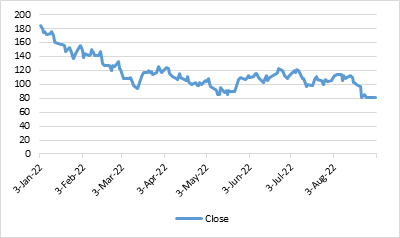
Figure 5: The close price chart of Zoom.
Source: Yahoo Finance [17]
In addition to Covid-19, the monkeypox epidemic also suddenly entered the public eye in May 2022. On July 23, WHO declared that the monkeypox outbreak constitutes a "public health emergency of international concern". As of September 2022, there will be more than 50,000 confirmed cases of monkeypox worldwide [18]. With the rapid spread of monkeypox epidemics in Europe and the United States, many countries and regions have begun to purchase monkeypox vaccines and drugs in large quantities, and the supply is in short supply. SIGA Technologies Inc. (Siga) is a concept stock of monkeypox, with the development of the epidemic, Siga's stock price has also risen, thanks to its oral TPOXX® (Tecovirimat) has been approved by the European Medicines Agency for the treatment of smallpox, monkeypox and other diseases after smallpox vaccination. This comes after the University of Oxford announced it would begin a new clinical study called PLATINUM to assess whether Tecovirimat is effective in treating monkeypox [19]. It is not difficult to see from Figure 6 that before the monkeypox epidemic began to spread, from the beginning of this year to mid-May, Siga’s stock price was weak and has a low volatility. There have been obvious ups and downs since late May, and the stock price has risen sharply since the WHO announced that monkeypox was upgraded to a global public health event in mid-July.
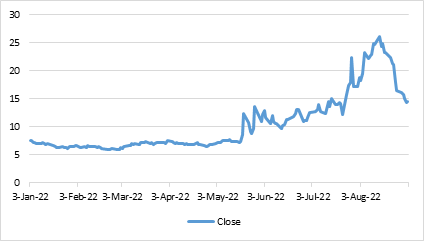
Figure 6: The close price chart of Siga Technologies.
Source: Yahoo Finance [20]
One of the industries that has been able to maintain stable amid the delivery segment. Judging from the market concentration of the top 50 global freight forwarding companies, in 2020, there will be 2 companies with freight revenue greater than US$70 billion, while FedEx Corporation (FedEx) ranked second with US$704.56, followed by UPS, whose freight business The scale is far ahead of other companies, and the total revenue of its freight business accounts for 22% of the top 50 companies. From Figure 7, the price per share of FedEx is always at a high level, and the volitility is not obvious. The overall trend is similar with the S&P 500 in Figure 1.
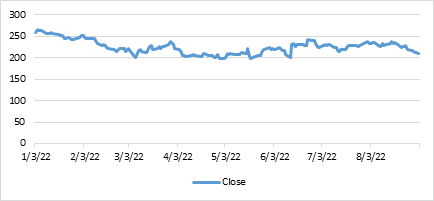
Figure 7: The close price chart of FedEx Corporation.
Source: Yahoo Finance [21]
Finally, let's look at the Chinese market. In the past two years, China's core Internet industries have developed strongly. Tencent Holdings Limited (Tencent) is a leading company in the industry, mainly in the field of digital entertainment. This field mainly includes online music, online literature, online games, online video, online live broadcast and online news, and Tencent basically has related businesses. From the perspective of development history, Tencent made its fortune from social software, and the subsequent company development layout is also mainly concentrated in the field of social networking and digital entertainment. In 2021, Tencent announced the launch of the carbon neutrality plan, successfully becoming one of the first Internet companies in China to launch carbon neutrality plans. one. In addition, Tencent's product, WeChat, has dominated third-party mobile payment all year round, and has accounted for nearly 50% of China's third-party mobile payment market in the next five years. Compared with digital entertainment and third-party mobile payment, Tencent's layout in the field of e-commerce has obvious shortcomings. Tencent's stock price chart is shown in Figure 8.
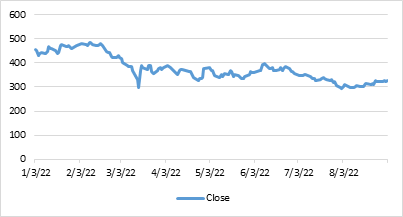
Figure 8: The close price chart of Tencent.
Source: Yahoo Finance [22]
The last segment is the real estate industry. In 2022, the real estate market will move forward in a weak recovery, but the supply-side changes under the credit turmoil will bring significant opportunities for some blue-chip real estate companies. The competition in the land market has decreased significantly, and the profit margin of land acquisition has increased significantly. As policies continue to be implemented in various parts of China, in addition to lowering the down payment ratio requirement, the purchase restriction is gradually relaxed, and the mortgage loan interest rate is also expected to continue to decline. Therefore, by the end of the year, the market is still volatile.
Longfor Group Holdings Limited (Longfor) is the real estate company, affected by the Evergrande redemption crisis last year, investors are pessimistic about the real estate market; in addition, due to the tightening of credit policies, decline in the scale of financing, structural changes, and cost declines have become the main features in the real estate industry this year. Affected by the above factors, combined with the data shown in Figure 9, the price per share of Longfor Group has dropped by 55.77% from the highest to the lowest in 2022.
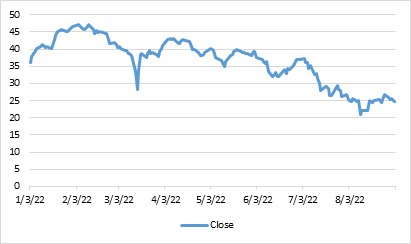
Figure 9: The close price chart of Longfor.
Source: Yahoo Finance [23]
2.3. Results
This section shows different portfolio covers above strategies. The first portfolio longs Peabody Energy, shorts Tencent. The reason is that based on the momentum strategy of “chasing up and selling down”, combined with the above-mentioned energy shortages in Europe and the shift in demand focus due to the Russian-Ukrainian conflict, and considering the demand for peak shaving in summer and the demand for heating in winter are superimposed, and since the beginning of this year, the United States has repeatedly sounded the alarm of power shortage. Previously, in the context of high natural gas prices, many U.S. power companies restarted coal-fired power plants to prevent winter power shortages, resulting in a sharp surge in coal demand and further driving up coal prices.
And the judgment of Peabody’s historical stock price, the 200-DAY Moving Average is 19.08, which can be selected as a long stock. From the perspective of short positions, the 200-DAY Moving Average of Tencent's stock price is 395.828. According to Table 1, Tencent's stock price has fallen continuously. Mainly for the following reasons: First, after Ali was fined in 2021, the Chinese government will promote the return of funds to the real economy. Second, games are Tencent's core revenue, and the rectification of games by anti-monopoly policies has led to a drop in the stock price. Third, there are rumors that Tencent has begun to reduce all or most of the shares of Meituan which is a food delivery company. Therefore, it is not difficult to judge why Tencent's share price, as shown in Figure 8, has continued to decline this year.
Table 1: Portfolio results of the momentum strategy.
Symbol | Position | Price Paid | Weight | Market value | Profit |
BTU | Long | $22.55 | 80% | $562.6 | 24.75% |
0700.HK | Short | HK$320.8 | 20% | $197.53 | 3.37% |
Portfolio return | 20.4740% | ||||
Then, in this portfolio used by the market neutral strategy, the monkeypox epidemic is still accelerating around the world, so Siga's stock price will still be on an upward trend in the short term. Based on this view, this stock has been selected as a long position. Affected by the Evergrande redemption crisis last year, investors are pessimistic about the real estate market.
At present, the sales of the real estate market are facing downside risks, but many companies have poor financing and cannot replenish their land reserves in a timely manner. Therefore, under the background of the great differentiation of real estate enterprises' credit, the credit that determines the prospects of the enterprise (expressed as bond yield), followed by the strength of land acquisition and development capacity, so Longfor Group is chosen here.
Based on the above analysis, it is unlikely that the real estate market will improve in the future, so there is recommended to keep the existing short positions. While, under the market-neutral strategy, in order to diversify the market risk, the portfolio selects two stocks with betas both less than 1, where Siga’s beta is 0.4 and Longfor’s beta is 0.27, also adjusts the investment weight of each stock. The specific trade data is shown in Table 2.
Table 2: Portfolio results of the market neutral strategy.
Symbol | Position | Price Paid | Weight | Market value | Profit |
SIGA | Long | $17.27 | 77% | $21,541.2 | 24.73% |
0960.HK | Short | HK$27.8 | 23% | $15.397.99 | -9.17% |
Portfolio return | 16.9609% | ||||
Portfolio beta | 0.37 | ||||
The third portfolio consists of FedEx Express and zoom. The PEG ratio of FDX is 0.92, which is less than 1 indicates that the market is underestimating the expected growth of FedEx, and the company's stock is currently undervalued. At the same time, it shows that FDX is a value stock with a low PE ratio, and FedEx's performance and fundamentals are stable, sales are growing steadily, so chose to hold a long position.
For Zoom, with the effective control of the epidemic, the demand for online office has dropped, and the demand for personal support in the post-epidemic era has declined significantly. Coupled with the impact of the previous high base, revenue has dropped significantly. In short, after the epidemic dividend disappeared, Zoom's performance was not satisfactory, and its stock price showed a downward trend in the short term.
Zoom's PEG ratio is 3.06, which is greater than 1, indicating that market's expected growth is higher than the actual value of the stock. The stock is currently overvalued. Based on the above analysis, the trades shown in Table 3 are made here, resulting in a yield of 12.4633% at the selected observation time
Table 3: Portfolio results of the PEG ratio.
Symbol | Position | Price Paid | Weight | Market value | Profit |
FDX | Long | $224.78 | 33% | $4,540.8 | 1.01% |
ZM | Short | $103.51 | 67% | $3,387.4 | 18.19% |
Portfolio return | 12.4633% | ||||
From the perspective of the three groups of portfolios, the momentum strategy has the better return performance, as the energy industry and Internet companies have been affected by macro factors this year, the performance is obvious, and the certainty is strong. In addition, Peabody Energy is a large energy company and has abundant resource reserves. Tencent's stock price trend is relatively intuitive, so historical stock prices have strong reference significance. The advantages of using a momentum strategy are obvious.
For a market-neutral strategy, it is believed that in a period of market volatility, building a portfolio with beta nearly equal to 0 can effectively avoid the risks brought by the market, while the stock volatility of Siga and Longfor are both smaller than the index volatility. Therefore, if a reasonable weight adjustment is made to the investment portfolio, a relatively considerable rate of return can be obtained.
While the portfolio constructed using the PEG ratio is relatively weak, considering the business situation of the company and make stock long and short choices is too simple.For FedEx, which yields lower yields, investors and institutions are now cautious about the North American transportation sector due to the slowdown in imports.
3. Conclusion
In this investigation, the aim was to assess how to choose individual stocks and strategies to obtain higher investment returns in the current volatile market. By analyzing the industries in which the six stocks are located, combining momentum strategy, market neutral strategy and PEG ratio strategy to construct investment portfolios and conduct real trading, the results of return rates are intuitively obtained. The insights gained from this study may be of assistance to understand how individual investors and institutions should comprehensively judge market conditions and make reasonable asset allocation under the possible "black swan" event. This study has found that generally the momentum strategy performs better when the market trend is determined; the market neutral strategy can effectively avoid market risks under volatile market conditions. Of course, The major limitation of this study is the number of individual stocks in the industry is small, and the dimension of strategy considerations is relatively simple. Therefore, this issue will be further discussed in the future.
References
[1]. Nicholas, J.G., 2000. Market neutral investing. Princeton, NJ: Bloomberg Press.
[2]. Beliossi, G., 2002. Market neutral strategies. The Journal of Alternative Investments, 5(2), pp.93-96.
[3]. Daniel, K., Jagannathan, R. and Kim, S., 2012. Tail risk in momentum strategy returns (No. w18169). National Bureau of Economic Research.
[4]. Daniel, K., Jagannathan, R. and Kim, S., 2012. Tail risk in momentum strategy returns (No. w18169). National Bureau of Economic Research.
[5]. Meher, B.K. and Sharma, S., 2015. Is PEG Ratio a Better Tool for Valuing the Companies as Compared to P/E Ratio? (A Case Study on Selected Automobile Companies). International Journal of Banking, Risk and Insurance, 3(2), pp.48-52.
[6]. Easton, P.D., 2004. PE ratios, PEG ratios, and estimating the implied expected rate of return on equity capital. The accounting review, 79(1), pp.73-95.
[7]. Ahmad, W., Kutan, A.M. and Gupta, S., 2021. Black swan events and COVID-19 outbreak: Sector level evidence from the US, UK, and European stock markets. International Review of Economics & Finance, 75, pp.546-557.
[8]. Fauzi, R. and Wahyudi, I., 2016. The effect of firm and stock characteristics on stock returns: Stock market crash analysis. The Journal of Finance and Data Science, 2(2), pp.112-124.
[9]. Piotroski, J.D. and Roulstone, D.T., 2004. The influence of analysts, institutional investors, and insiders on the incorporation of market, industry, and firm‐specific information into stock prices. The accounting review, 79(4), pp.1119-1151.
[10]. Che, J., 2018. Investment Analysis about China’s IT Company—The Tencent Holdings Limited. Modern Economy, 9(6), pp.1112-1120.
[11]. Liu, F. and Wen, H., 2019, September. Analysis of Profitability of Real Estate Enterprises Taking LONGFOR as an Example. In The 4th International Conference on Economy, Judicature, Administration and Humanitarian Projects (JAHP 2019) (pp. 325-329). Atlantis Press.
[12]. Longxing, B., 2016. The advantages and Disadvantages of the Market Neutral Strategy. Available at: http://www.baiven.com/f/90/210179.html (Accessed: 15th October 2022)
[13]. Zhongtai, Securities., 2022. The conflict between Russia and Ukraine reshapes the international coal trade pattern, and listed companies continue to improve their operations and seize the opportunity for profit certainty, Financial, 25th July. Available at: https://baijiahao.baidu.com/s?id=1739284392022759425&wfr=spider&for=pc (Accessed: 15th October 2022)
[14]. Digital Information World., 2021. Zoom vs Google Meet vs Microsoft Teams: New data. reveals the WORLD'S most POPULAR video calling platform. Available at: https://www.digitalinformationworld.com/2021/04/top-video-call-platform-by-market-share.html# (Accessed: 15th October 2022)
[15]. Xinhua News., 2022. Summary: More than 50,000 confirmed cases of monkeypox world. wide, many countries strengthen monkeypox prevention and control. Available at: http://www.news.cn/tech/2022-09/01/c_1128967821.htm (Accessed: 5th October 2022)
[16]. SIGA Human BioArnor., 2022. Press Release Details. Available at: https://investor.siga.com/news-releases/news-release-details/siga-announces-collaboration-oxford-university-support-expanded (Accessed: 15th October 2022)
Cite this article
Weng,S. (2023). Different portfolio performance based on momentum strategy, market neutral strategy and PEG ratio in volatile market. Advances in Economics, Management and Political Sciences,15,1-12.
Data availability
The datasets used and/or analyzed during the current study will be available from the authors upon reasonable request.
Disclaimer/Publisher's Note
The statements, opinions and data contained in all publications are solely those of the individual author(s) and contributor(s) and not of EWA Publishing and/or the editor(s). EWA Publishing and/or the editor(s) disclaim responsibility for any injury to people or property resulting from any ideas, methods, instructions or products referred to in the content.
About volume
Volume title: Proceedings of the 2nd International Conference on Business and Policy Studies
© 2024 by the author(s). Licensee EWA Publishing, Oxford, UK. This article is an open access article distributed under the terms and
conditions of the Creative Commons Attribution (CC BY) license. Authors who
publish this series agree to the following terms:
1. Authors retain copyright and grant the series right of first publication with the work simultaneously licensed under a Creative Commons
Attribution License that allows others to share the work with an acknowledgment of the work's authorship and initial publication in this
series.
2. Authors are able to enter into separate, additional contractual arrangements for the non-exclusive distribution of the series's published
version of the work (e.g., post it to an institutional repository or publish it in a book), with an acknowledgment of its initial
publication in this series.
3. Authors are permitted and encouraged to post their work online (e.g., in institutional repositories or on their website) prior to and
during the submission process, as it can lead to productive exchanges, as well as earlier and greater citation of published work (See
Open access policy for details).
References
[1]. Nicholas, J.G., 2000. Market neutral investing. Princeton, NJ: Bloomberg Press.
[2]. Beliossi, G., 2002. Market neutral strategies. The Journal of Alternative Investments, 5(2), pp.93-96.
[3]. Daniel, K., Jagannathan, R. and Kim, S., 2012. Tail risk in momentum strategy returns (No. w18169). National Bureau of Economic Research.
[4]. Daniel, K., Jagannathan, R. and Kim, S., 2012. Tail risk in momentum strategy returns (No. w18169). National Bureau of Economic Research.
[5]. Meher, B.K. and Sharma, S., 2015. Is PEG Ratio a Better Tool for Valuing the Companies as Compared to P/E Ratio? (A Case Study on Selected Automobile Companies). International Journal of Banking, Risk and Insurance, 3(2), pp.48-52.
[6]. Easton, P.D., 2004. PE ratios, PEG ratios, and estimating the implied expected rate of return on equity capital. The accounting review, 79(1), pp.73-95.
[7]. Ahmad, W., Kutan, A.M. and Gupta, S., 2021. Black swan events and COVID-19 outbreak: Sector level evidence from the US, UK, and European stock markets. International Review of Economics & Finance, 75, pp.546-557.
[8]. Fauzi, R. and Wahyudi, I., 2016. The effect of firm and stock characteristics on stock returns: Stock market crash analysis. The Journal of Finance and Data Science, 2(2), pp.112-124.
[9]. Piotroski, J.D. and Roulstone, D.T., 2004. The influence of analysts, institutional investors, and insiders on the incorporation of market, industry, and firm‐specific information into stock prices. The accounting review, 79(4), pp.1119-1151.
[10]. Che, J., 2018. Investment Analysis about China’s IT Company—The Tencent Holdings Limited. Modern Economy, 9(6), pp.1112-1120.
[11]. Liu, F. and Wen, H., 2019, September. Analysis of Profitability of Real Estate Enterprises Taking LONGFOR as an Example. In The 4th International Conference on Economy, Judicature, Administration and Humanitarian Projects (JAHP 2019) (pp. 325-329). Atlantis Press.
[12]. Longxing, B., 2016. The advantages and Disadvantages of the Market Neutral Strategy. Available at: http://www.baiven.com/f/90/210179.html (Accessed: 15th October 2022)
[13]. Zhongtai, Securities., 2022. The conflict between Russia and Ukraine reshapes the international coal trade pattern, and listed companies continue to improve their operations and seize the opportunity for profit certainty, Financial, 25th July. Available at: https://baijiahao.baidu.com/s?id=1739284392022759425&wfr=spider&for=pc (Accessed: 15th October 2022)
[14]. Digital Information World., 2021. Zoom vs Google Meet vs Microsoft Teams: New data. reveals the WORLD'S most POPULAR video calling platform. Available at: https://www.digitalinformationworld.com/2021/04/top-video-call-platform-by-market-share.html# (Accessed: 15th October 2022)
[15]. Xinhua News., 2022. Summary: More than 50,000 confirmed cases of monkeypox world. wide, many countries strengthen monkeypox prevention and control. Available at: http://www.news.cn/tech/2022-09/01/c_1128967821.htm (Accessed: 5th October 2022)
[16]. SIGA Human BioArnor., 2022. Press Release Details. Available at: https://investor.siga.com/news-releases/news-release-details/siga-announces-collaboration-oxford-university-support-expanded (Accessed: 15th October 2022)