


1. Introduction
The spread of COVID-19 has had a significant influence on people and nations worldwide. When people were quarantined at home to avoid the spread of the Covid-19, their lifestyles and numerous industries were impaired. Cultural markets, particularly live events such as concerts, were severely impacted by store closures or the cancellation of live music events, as well as the broader economic downturn, which decreased demand. Nonetheless, music streaming may benefit from the outbreak, as people can spend more time at home listening to music during the lockdown.
This paper focuses on how the Covid-19 has affected China's music streaming industry. We use a case study to focus on Tencent Music Entertainment, the largest music company with 68% market share in China; we investigate Tencent Music's stock market performance from the beginning of the pandemic in 2020 to the present day to reflect the performance of the entire online streaming industry in China during the past three years.
In 2016, China Music Group and QQ Music were integrated as Tencent Music Entertainment Group [1]. Tencent Music Group currently comprises four platforms: Kugou Music, QQ Music, Cool My Music, and WeSing. WeSing is distinct from conventional online music players in that users can interact with one another, view performances, and send virtual gifts, among other features. This provides TME with additional revenue from social entertainment. Currently, forty percent of TME's revenue is derived from online music fees, while the remaining sixty percent is derived from social entertainment. Tencent Music's business is divided into online music business and social entertainment business, the former of which can be further divided into subscription business (paid membership revenue) and non-subscription business (copyright sublicensing, advertising, and digital album revenue). Within Tencent Music's business, Wesing and live streaming are the main sources of revenue, accounting for 60 to 70 percent of total revenue.
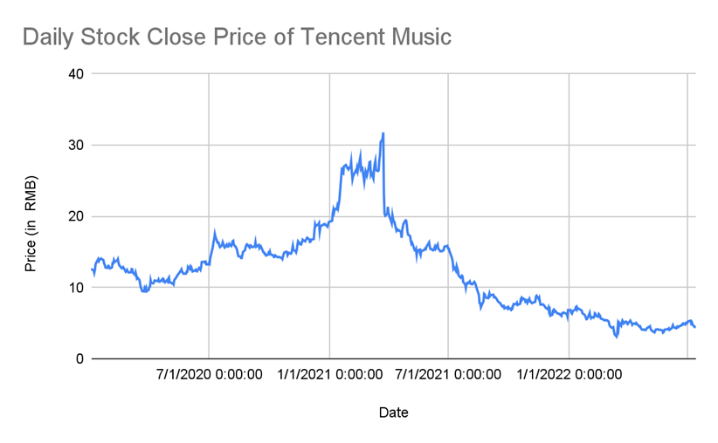
Figure 1: Tencent Stock Price.
Tencent Music was influenced by the Covid-19 as a reflection of its stock price as shown in figure 1. According to TME's Q1 2020 earnings report [2], there were 42.7 million paid subscribers to online music, up 50.4 percent year over year, with an increase in average revenue per paying user (ARPPU) of 13.3 percent. Total revenue was RMB 6.31 billion (US$891 million), up 10.0 percent year over year, with online music subscription revenue rising to RMB 1.21 billion (US$170 million), up 70.0 percent year over year. Obliviously, Covid-19 made Tencent Music more successful. The stock market performance of Tencent Music leading up to the outbreak also shows this. The share price of Tencent Music surged by 110 percent from January 2020 to March 2021.
In the third week of March 2021, Goldman Sachs purchased shares of Chinese tech companies worth $6.6 billion, including 30 million shares of Tencent Music. TME’s stock fell 36% as a result. To boost the stock price, Tencent Music declared on March 29, 2021, that it would start repurchasing $1 billion in American Depositary Shares over 12 months. [3] The Chinese government has been looking into Tencent Music for alleged monopolistic practices since April 21, and [4] the Securities and Exchange Commission of the United States posted a new rule that required foreign companies to file documents about government affiliations and influence. As a result, Tencent Music's stock price was not able to recover and kept decreasing.
Strong industry competitiveness is the primary cause of Tencent Music's stock's poor performance from March 21 to the present, in addition to these other factors. The short video market has emerged as Tencent Music's toughest competitor—and perhaps even the toughest competitor for the entire Chinese music streaming industry.Tencent Music's monthly user activity (MAU) and APPRU are in a declining trend as shown in Figure 2 and 3.
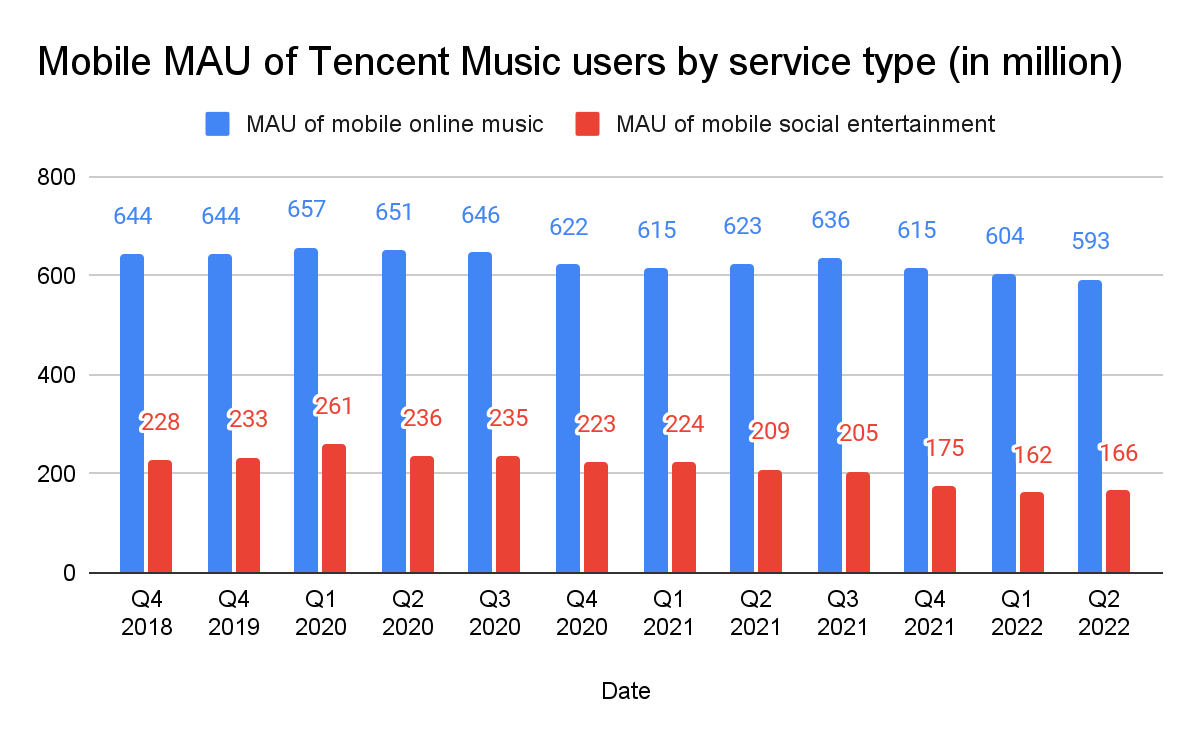
Figure 2: Tencent Quarterly MAU.
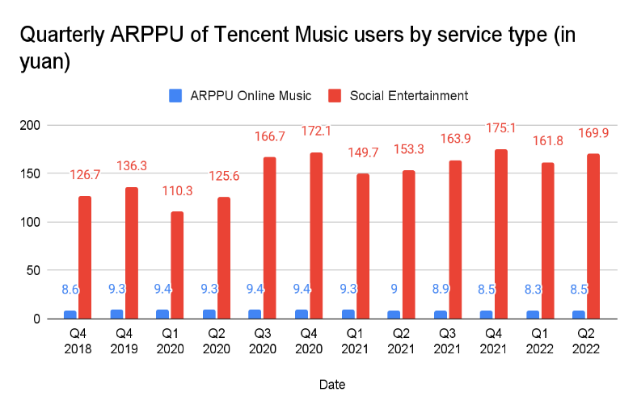
Figure 3: Tencent Quarterly ARPPU.
In summary, we discover that the five variables with the biggest effects on Tencent's stock price are the average revenue per user, monthly user activity (MAU), paid users, the quantity of new Covid-19 cases, and the macroeconomic environment. The macroeconomic environment consists of government regulations, business rivalry, and unforeseen circumstances. National policies cover both China's adopted policies and its overall economic status. Tencent Music contends with the danger of emerging sectors in addition to competition from other streaming services.
2. Method and Results
2.1. Variables
Note: Since the macro environment cannot be represented by data, we asked 10 individuals of different ages to rate the degree of impact on Tencent Music through a questionnaire, and took the average as the benchmark.
Table 1
Symbol | Definition | Unit |
Ai | Quarterly average revenue per user (ARPPU) for Tencent Music from January 2020 to March 2022. | RMB |
Mii | Quarterly monthly active users (MAU) for Tencent Music from January 2020 to March 2022. | Numbers of people |
Uiii | Quarterly paying users for Tencent Music from January 2020 to March 2022. | Numbers of people |
Civ | Quarterly mean new covid-19 cases from January 2020 to March 2022. | Numbers of cases |
Ov | Quarterly mean scores people have about how the macroeconomic environment influences Tencent Music from January 2020 to March 2022. | 1-100 |
2.2. Correlation Coefficient
To determine the influence of each of these five variables on the closing price of Tencent Music's stock, we use an equation to determine the correlation coefficient and graphs based on the results to determine the best trend line and the R square between the variables and the price.
\( Rxy=\frac{1}{n-1} \sum (\frac{Xi - \overline{X}}{Sx})(\frac{Yi -\overline{ Y}}{Sy}) \)
Where Rxy is the correlation coefficient that measures the direction and strength of the linear relationships between two variables, n is the total numbers of cases by quarters in population; Xi is the daily data of each variable by quarters, \( \overline{x} \) is the quarterly mean data of each variable; Yi is the daily close stock price by quarters of Tencent Music, and \( \overline{y} \) is quarterly mean close stock price of Tencent Music.
We utilized this formula five times to determine the correlation coefficient between each variable and the stock's closing price of Tencent Music as shown in Figure 4 to 8. If the obtained data is greater than 0, it indicates a positive association between variables; otherwise, it indicates a negative association or no association.
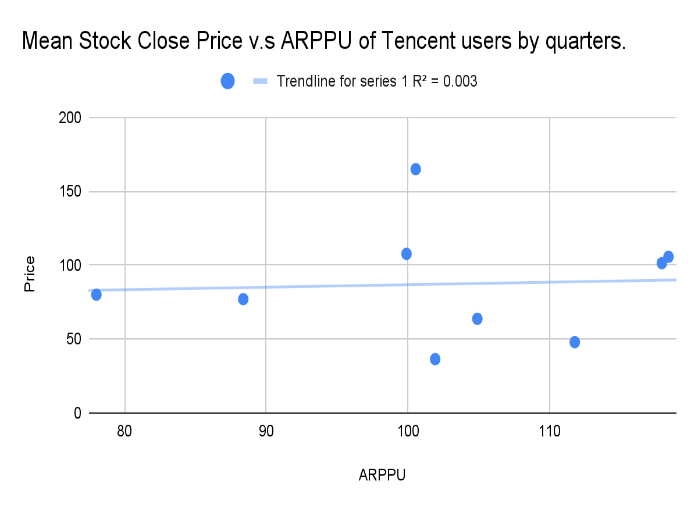
Figure 4: Linear regression: ARPPU v. Stock Price.
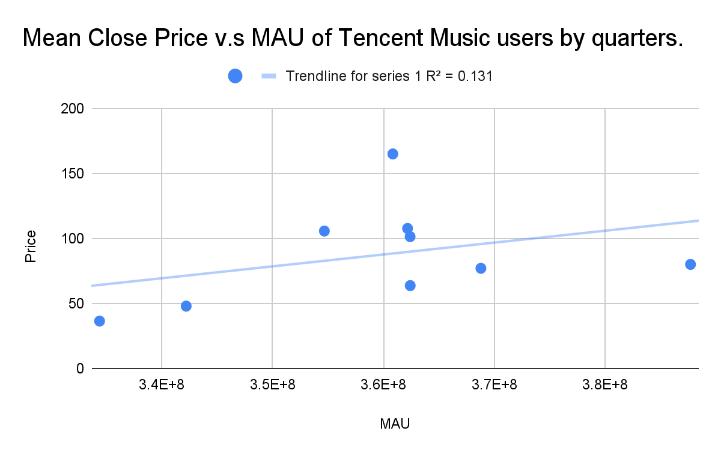
Figure 5: Linear regression: MAU v. Stock Price.
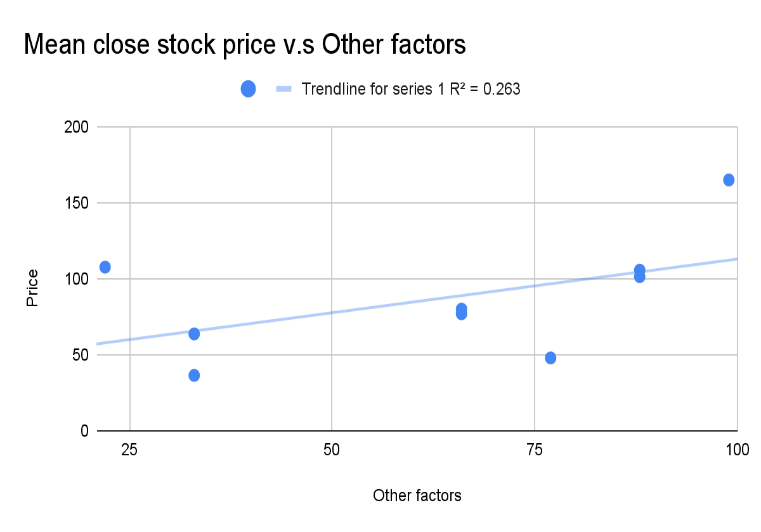
Figure 6: Linear regression: Covid-19 Cases v. Stock Price.
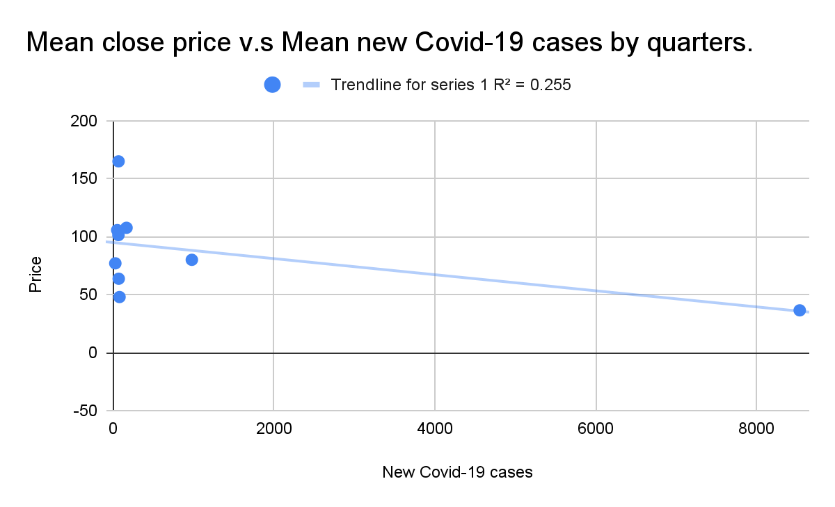
Figure 7: Linear regression: Other Factors v. Stock Price.
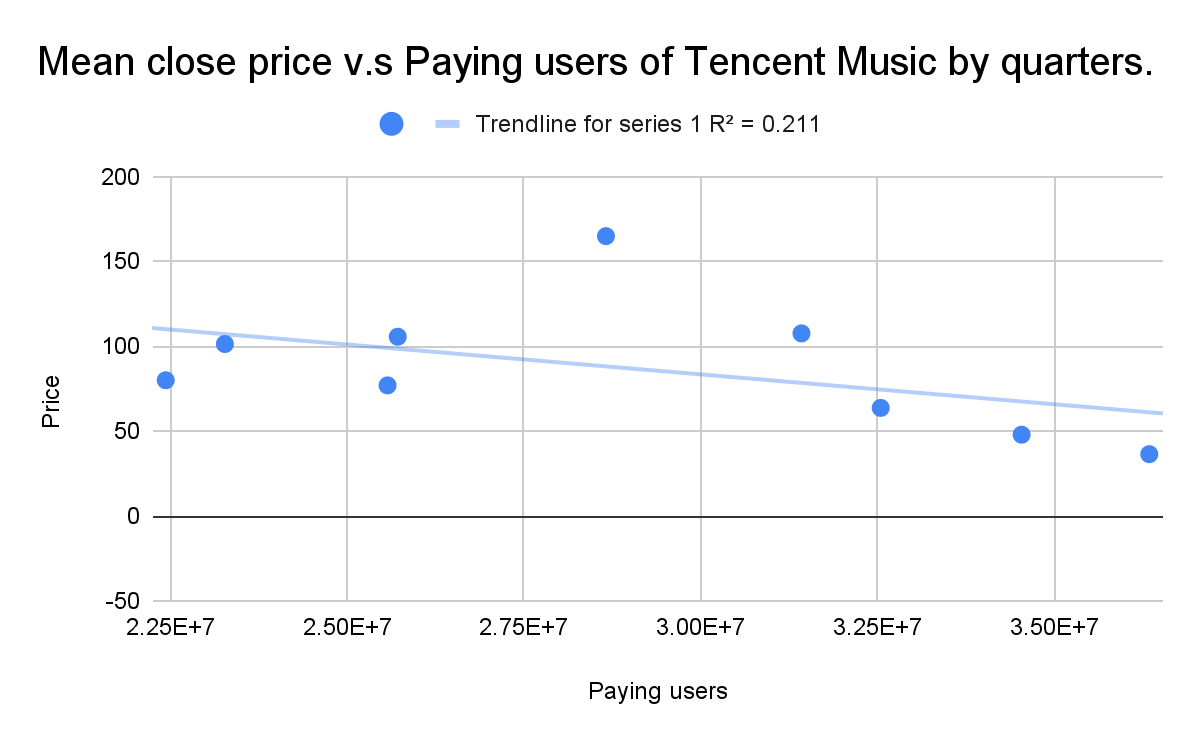
Figure 8: Linear regression: Paying users v. Stock Price.
Table 2
Variables | Ai | Mii | Uiii | Civ | Ov |
Correlation Coefficient | 0.058 | 0.362 | -0.460 | -0.505 | 0.512 |
Ai, Mii and Ov have positive correlation coefficients, and Civ, Uii have negative correlation coefficients. This indicates that the average revenue per user (ARPU), monthly user activity (MAU), and the macroeconomic environment are all positively correlated with the stock price of Tencent Music; while the number of new COVID-19 cases and the number of paying users demonstrate negative causation. The number of new COVID-19 cases and the macroeconomic environment have the highest absolute correlation coefficients with Tencent Music's stock price. The correlation coefficient between average revenue per user and stock price is close to zero, indicating a weak or nonexistent relationship between the two variables.
For most quarters from 2020 to 2022, the number of COVID-19 cases in China was capped at 500, hence there is a cluster of data on the far left of the X-axis. Tencent Music's stock has not been positively affected by the outbreak, as indicated by the decreasing trend in graph. The outlier above the trendline indicates that in the early stages of the epidemic, the number of COVID-19 confirmed cases is a significant cause for Tencent Music. However, as people's lives return to normal and other factors come into play, COVID-19 would no longer have a significant impact on the stock price.
2.3. Linest Equation
We construct the Linest equation in Google sheets after determining the correlation coefficient between each of the five variables and the closing stock price of Tencent Music [6]. The linest function determines the statistics for a line by determining the straight line that best fits our data using the "least squares" method, and it then provides an array that describes the line. We use it to predict the future close stock price [7].
Table 3
Date | Ai | Mii | Pii | Ov | Civ | Y=mean close stock price |
Q1 2020 | 78.012 | 387.72 | 22.436 | 66 | 977.678 | 80.005 |
Q2 2020 | 88.384 | 368.8 | 25.572 | 66 | 26.286 | 76.979 |
Q3 2020 | 117.97 | 362.41 | 23.272 | 88 | 65.094 | 101.346 |
Q4 2020 | 118.409 | 354.67 | 25.716 | 88 | 50.619 | 105.346 |
Q1 2021 | 100.56 | 360.85 | 28.66 | 99 | 66.333 | 164.9 |
Q2 2021 | 99.909 | 362.18 | 31.424 | 22 | 165.286 | 107.611 |
Q3 2021 | 104.911 | 362.42 | 32.544 | 33 | 68.516 | 63.701 |
Q4 2021 | 111.792 | 342.2 | 36.536 | 77 | 78.219 | 47.917 |
Q1 2022 | 101.935 | 334.38 | 36.341 | 33 | 8534.968 | 36.436 |
We put all data into google sheet and put “ =linest(Y1-Y10, Ai1-O10,1,1)” to ask google sheet to calculate the slope coefficient, intercept constant, standard error of slope, coefficient of determination for us.
Table 4
Ai | Mii | Pii | Ov | Civ | Y-inter | |
Slope | 1.00236700 | 2.14608581 | 3.34622289 | 0.76502097 | 0.00000034 | -932.5601004 |
Standard Error | 3.00979 | 5.09390 | 11.18350 | 1.11798 | 0.01262 | 2451.02779 |
Table 5
Coefficient determination | 0.41117 | Standard error of Y estimate | 48.17168 |
F Statistic | 0.41896 | Degrees of freedom | 3 |
Regression sum of squares | 4861.05894 | Regression sum of squares | 6961.53359 |
Coefficient determination 0.41117 represents 41.1% of the variation in the quarterly mean stock price of Tencent Music is accounted for by the linear model relating to the 5 variables we defined to the stock price of Tencent Music. The standard errors indicate the likelihood that the population means would differ from the sample mean. The reason why the standard errors of the monthly active users, the number of paying users, and the average revenue per user are rather high is because we utilize the data given in each quarterly financial report as opposed to the actual quarterly mean values.
1) Given that we have the slope for each variable and the y-intercept, we can then derive the linear regression:
\( y=Ai*1.0024+Mii*2.146+Piii*3.3462+Ov*0.795+Civ*0.0000034-932.6501 \)
2) We put all the data into the linear regression line we have, then calculate the predicted quarterly mean stock price for Tencent Music and residuals by quarters.
\( e = y – y\text{^} \)
Where y is the actual quarterly mean stock price of Tencent Music, and y^ is the predicted quarterly mean stock price of Tencent Music we got from the regression line. We then graph the residuals plot.
Table 6
Date | y | y^ | Residuals: |
Q1 2020 | 80.005 | 103.3153894 | -23.31087324 |
Q2 2020 | 76.979 | 83.56879912 | -6.590227711 |
Q3 2020 | 101.346 | 108.6158633 | -7.269684114 |
Q4 2020 | 105.346 | 100.6529273 | 4.988322705 |
Q1 2021 | 164.9 | 114.2920746 | 50.60759753 |
Q2 2021 | 107.611 | 66.83958744 | 40.77152366 |
Q3 2021 | 63.701 | 84.52801799 | -20.8270023 |
Q4 2021 | 47.917 | 88.35817541 | -40.44098791 |
Q1 2022 | 36.436 | 34.36489813 | 2.071331378 |
As shown in Figure 9, the residual negative growth in 2021 from the second to the third quarter was 61 yuan. This demonstrates that the macroeconomic environment had the most impact on Tencent Music at this time. Investors have shied away from Tencent Music due to a sell-off by significant shareholders and new regulations in China and the US.
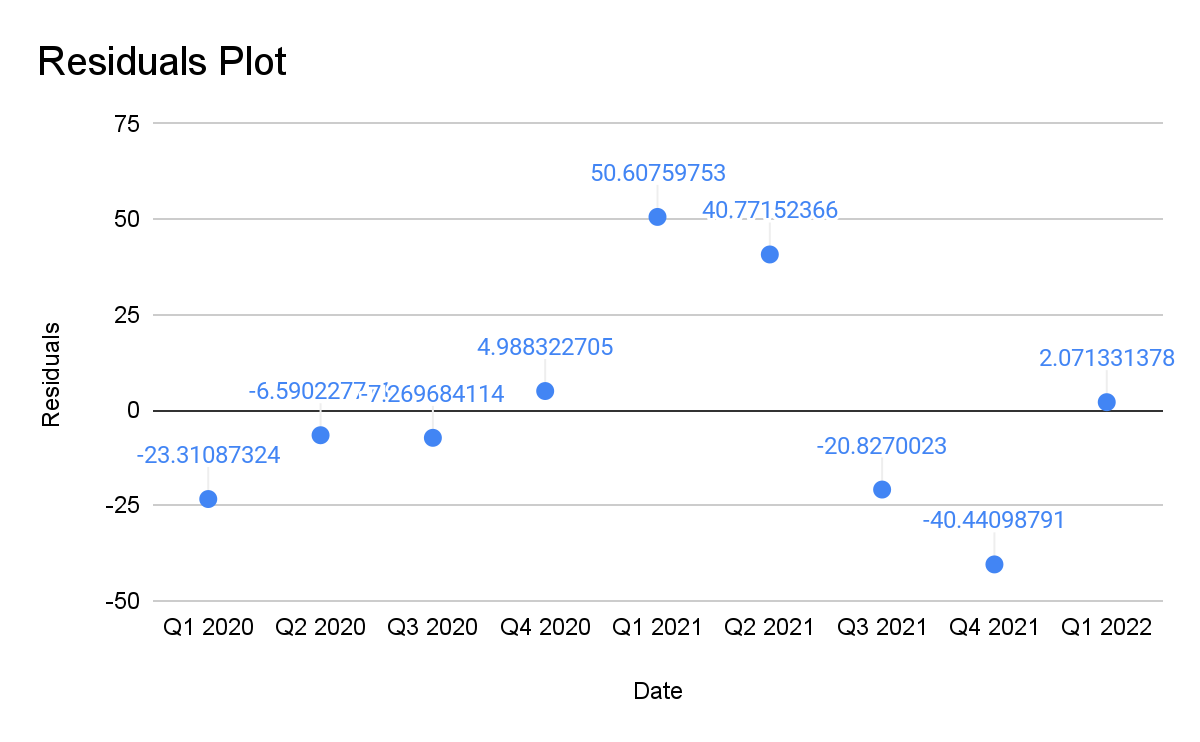
Figure 9: Residuals of Stock Price v. Date.
3. Conclusion
In this study, we examine five variables that, from both a consumer and environmental perspective, have the most effects on Tencent Music. Each of these elements and the share price of Tencent Music have varying degrees of causation based on the correlation coefficients we calculated.
The start of the Covid-19 provided Tencent Music with an excellent chance to grow. To better serve people's requirements, additional online life was introduced. This is supported by our data, which shows that Tencent Music performed better than anyone expected in Q2 2021. In addition, environmental factors have an impact on the share price of Tencent Music, with Chinese legislation having a significant impact on both the company's existence and the share price in the future.
We can see that the entire Chinese streaming market is growing by using Tencent Music as a proxy for the entire Chinese streaming market. More businesses will enter the streaming market in the future thanks to the Chinese government's goal of a thriving economy and its eradication of copyright theft and monopolistic actions. The steadily rising payment rate from Tencent Music is another sign of Chinese users' growing acceptance of digital culture. The streaming industry must consider how it can increase user consumption and experience because the short-form video sector is by far its toughest competitor in the streaming space.
References
[1]. Zhehao, Zhou. “Who is the biggest online music platform in China”[J]. Fortune Life, 2021, (23):48-53.
[2]. World Health Organization. (n.d.). China: WHO Coronavirus Disease (COVID-19) Dashboard With Vaccination Data. World Health Organization. Retrieved from https://covid19.who.int/region/wpro/country/cn
[3]. Xing, Wen. “The Administration of Market Supervision of China ordered Tencent Holding Ltd. to release exclusive online music rights and other penalties in accordance with the law”[J]. Reliability Report, 2021, (07):28.
[4]. BobPisani. (2021, March 26). China-listed stocks tank on fears of multiple disputes with U.S. CNBC. Retrieved from https://www.cnbc.com/2021/03/26/china-listed-stocks-tank-on-fears-of-multiple-disputes-with-us.html
[5]. Microsoft. (n.d.). Retrieved from https://support.microsoft.com/en-us/office/linest-function-84d7d0d9-6e50-4101-977a-fa7abf772b6d
[6]. Cheusheva, Svetlana, et al. “How to Use LINEST Function in Excel - Formula Examples.” Excel Add-Ins and Outlook Tools - Ablebits.com, www.ablebits.com/office-addins-blog/2018/07/25/excel-linest-function-formula-examples/.
Cite this article
Chen,M.;Ma,M.;Xu,Z. (2023). A Case Study of Tencent Music: How’s the Music Streaming Industry Faring Under Covid-19?. Advances in Economics, Management and Political Sciences,15,32-39.
Data availability
The datasets used and/or analyzed during the current study will be available from the authors upon reasonable request.
Disclaimer/Publisher's Note
The statements, opinions and data contained in all publications are solely those of the individual author(s) and contributor(s) and not of EWA Publishing and/or the editor(s). EWA Publishing and/or the editor(s) disclaim responsibility for any injury to people or property resulting from any ideas, methods, instructions or products referred to in the content.
About volume
Volume title: Proceedings of the 2nd International Conference on Business and Policy Studies
© 2024 by the author(s). Licensee EWA Publishing, Oxford, UK. This article is an open access article distributed under the terms and
conditions of the Creative Commons Attribution (CC BY) license. Authors who
publish this series agree to the following terms:
1. Authors retain copyright and grant the series right of first publication with the work simultaneously licensed under a Creative Commons
Attribution License that allows others to share the work with an acknowledgment of the work's authorship and initial publication in this
series.
2. Authors are able to enter into separate, additional contractual arrangements for the non-exclusive distribution of the series's published
version of the work (e.g., post it to an institutional repository or publish it in a book), with an acknowledgment of its initial
publication in this series.
3. Authors are permitted and encouraged to post their work online (e.g., in institutional repositories or on their website) prior to and
during the submission process, as it can lead to productive exchanges, as well as earlier and greater citation of published work (See
Open access policy for details).
References
[1]. Zhehao, Zhou. “Who is the biggest online music platform in China”[J]. Fortune Life, 2021, (23):48-53.
[2]. World Health Organization. (n.d.). China: WHO Coronavirus Disease (COVID-19) Dashboard With Vaccination Data. World Health Organization. Retrieved from https://covid19.who.int/region/wpro/country/cn
[3]. Xing, Wen. “The Administration of Market Supervision of China ordered Tencent Holding Ltd. to release exclusive online music rights and other penalties in accordance with the law”[J]. Reliability Report, 2021, (07):28.
[4]. BobPisani. (2021, March 26). China-listed stocks tank on fears of multiple disputes with U.S. CNBC. Retrieved from https://www.cnbc.com/2021/03/26/china-listed-stocks-tank-on-fears-of-multiple-disputes-with-us.html
[5]. Microsoft. (n.d.). Retrieved from https://support.microsoft.com/en-us/office/linest-function-84d7d0d9-6e50-4101-977a-fa7abf772b6d
[6]. Cheusheva, Svetlana, et al. “How to Use LINEST Function in Excel - Formula Examples.” Excel Add-Ins and Outlook Tools - Ablebits.com, www.ablebits.com/office-addins-blog/2018/07/25/excel-linest-function-formula-examples/.