


1. Introduction
As the improvement of the global capital market system promotes the development of the financial market system, the stock industry has become the main market that many investors pay attention to. Stock is one of the ways that joint-stock companies raise money. There are lots of research on stock price return, volatility and related forecasting in recent years, which is the most concerned issue for investors and capitalists. However, the stock market contains a large number of stocks, and the volatility of stock prices makes it difficult for investors to fully grasp the overall changes in the stock market. Therefore, we can solve this problem by using the stock price index [1].
The field became more and more interesting. For example, The stock index is often called a barometer which can give an index to the political, human society and economic changes of the country or region that the market is located. We can reflect the changes of the whole stock market through the index. At present, the five major stock indexes in the world are the Dow Jones Stock Index and four other stock Index major from the US and UK. Among them, the Hang Seng Index is an important indicator of the price of the Hong Kong stock market. In the current econometric model, there are a large number of ways to solve the linear relationship between two different conveniences. Salisu, A, et, al used the Fractional cointegrated VAR (FCVAR) method of Johansen and Nielsen, it is found that all regional stock markets are fractional cointegrated, and this behavior may be affected by global economic conditions [2].
In recent years, Hong Kong's stock and financial market is also in the recovery stage, which is also the inspiration of this paper. In order to conduct quantitative research on the situation of Hong Kong's financial industry, the Hong Kong stock market is the main subject of our study [3]. Among them, Hong Kong's Hang Seng index provides a good opportunity for research in this paper, the index is based on majority of Hong Kong's mainstream stocks, the index is calculated in a way that takes into account the role of different stocks. Therefore, it can also be considered that the index reflects the overall trend of the current Hong Kong stock and financial market. Kot, H. W. et,al, Argyroudis, G. et, al, Chen, Y. et. al and other scholars have found that there is a certain correlation between different stock indexes, and one stock index can even be used to predict the trend of another stock index [4-6].
This paper chooses to use the form of stock price index for analysis. The Hong Kong Hang Seng Index and FTSE CHI index from October 1, 2021 to October 1, 2022 were collected through the official website of Yingwei Financial Information. ADF and PP unit root tests were conducted through Eviews software, and the convergence of the data was judged through the unit circle. Finally, the two groups of stock indices were applied to the VAR model to obtain their lag periods and the variance decomposition was carried out to reveal the interaction between the two index.
The rest of this paper is organized as follows: Section 2 presents the data and methods used in this paper. Section 3 applies the above method to calculate the data and discuss the results. Finally, Section 4 concludes.
2. Data and Method
2.1. Data
This paper needs to study the relationship between two different stock indexes. In order to make the research objects located in the same temporal dimension and spatial dimension, this paper choose Hong Kong Hang Seng Index and FTSE CHI Hong Kong Index in the Hong Kong financial market as the research objects. The paper has detailed the close correlation between the two indices in the introduction, through the data provided by the official website of UK Financial Situation, the daily data of the two stock indexes from October 1, 2021 to September 30, 2022 were collected for research. The two groups of data collected are preliminarily analyzed, and the descriptive statistical results are shown in Table 1:
Table 1: Summary statistic.
Mean | Coefficient | Std.Err | R2 | Ad-R2 | ADF | PP | |
HK Hang Seng Index | 0.000 | -0.933 | 0.064 | 0.468 | 0.466 | -14.651*** | -14.627*** |
FTSE CHI HK Index | 0.000 | -1.062 | 0.086 | 0.472 | 0.468 | -12.356*** | -14.390*** |
Note: Ad-R2 denote Adjusted R-squared, ***represent passed the 1% significance test.
According to Table 1, both time series can pass the stationarity test of ADF and PP, and the stationarity of the series can represent the initial assumption of the required model.
2.2. Methodology
Vector autoregressive (VAR) model was proposed by Christopher, a Nobel Prize winner in economics, in 1980. VAR model is built by using the form of simultaneous equations. Variables on the right side of all equations in the system of this model are the same. In addition, the variables on the right side of the equation cover the lag value of each endogenous variable and are widely used to study the dynamic relationship between variables [7]. The basic form of VAR model is shown in Eq (1) :
\( {Y_{t}}={A_{D}}+{A_{1}}{Y_{t-1}}+{A_{2}}{Y_{t-2}}+⋯+{A_{n}}{Y_{t-n}}+{u_{t}} \) (1)
Vector autoregressive model is a kind of unstructured model, which includes multiple equations for the prediction of interconnected time series variable system. The model has wide compatibility. Doh and Smith [8] proposed that the existing exogenous variables could be regarded as the lagged values of endogenous variables according to the different statistical meanings of the data, so as to construct functions. VAR model can perform regression analysis on multiple groups of related time series, and is also widely used to analyze the effect of a single random variable on the whole system, and to analyze the impact of time series on each other. In this paper, a linear regression model is established between Hong Kong Hang Seng Index and FTSE CHI Hong Kong Index. The expression of the model is as follows:
\( (\begin{matrix}y_{t}^{HSI} \\ y_{t}^{CHI} \\ \end{matrix})={A_{1}}(\begin{matrix}y_{t-1}^{HSI} \\ y_{t-1}^{CHI} \\ \end{matrix})+⋯+{A_{n}}(\begin{matrix}y_{t-n}^{HSI} \\ y_{t-n}^{CHI} \\ \end{matrix})+(\begin{matrix}{C_{t1}} \\ {C_{t2}} \\ \end{matrix})+(\begin{matrix}ε_{t}^{HSI} \\ ε_{t}^{CHI} \\ \end{matrix}), t=1,2,3⋯ \) (2)
In Eq. (2), \( {y_{t}} \) denotes the two-dimensional endogenous variable, \( y_{t}^{HSI} \) and \( y_{t}^{CHI} \) denote Hong Kong Hang Seng Index and FTSE CHI Hong Kong Index respectively, \( t \) is the number of samples, \( n \) is the lag order, \( {A_{1}}⋯{A_{n}} \) is parameter matrix, \( ε_{t}^{HSI} \) and \( ε_{t}^{CHI} \) represents the random interference term, \( {C_{t1}} \) and \( {C_{t2}} \) represent two exogenous variables.
3. Empirical Finding
The results of the first part are related to changes in two selected stock indices. The second part is about the law of Hong Kong Hang Seng Index and FTSE CHI Hong Kong index changes and the reasons. The empirical research results based on VAR model are as follows:
3.1. Determine the Lag Order
In order to obtain reliable model results, it is necessary to correctly judge the Lag order. The Lag order is shown in Table 2 through the Lag structure function in Eviews:
Table 2: Lag structure.
Lag | LagL | LR | FPE | AIC | SC | HQ |
0 | 1703.919 | NA | 2.52e-09 | -14.12381 | -14.09489* | -14.11216* |
1 | 1708.421 | 8.891272 | 2.51e-09 | -14.12797 | -14.04121 | -14.09302 |
2 | 1714.738 | 12.37366 | 2.46e-09* | -14.14721* | -14.00261 | -14.08895 |
3 | 1717.466 | 5.297272 | 2.49e-09 | -14.13665 | -13.93421 | -14.05509 |
4 | 1719.679 | 4.259376 | 2.52e-09 | -14.12181 | -13.86154 | -14.01695 |
5 | 1722.091 | 4.605328 | 2.56e-09 | -14.10864 | -13.79053 | -14.98048 |
6 | 1727.188 | 9.643210* | 2.53e-09 | -14.11774 | -13.74179 | -14.96628 |
According to Table2 can find that the most appropriate lag order of the two indicators is 2.
3.2. Test of Convergence
In order to ensure the reliability of VAR model results, it is necessary to ensure that the series participating in the model operation are stationary series, so we need to conduct stationarity test on the data. When the data is stable, if the impact of external unstable factors is received, the data will become stable with the passage of time. If the data is not stable and affected by external extreme conditions, the model results will be affected more and more seriously, thus making the results unreliable [9]. In the stationarity test, we used the Augmented Dickey-Fuller test statistic and Phillips-Perron test statistic to judge based on the unit circle method.
From the ADF and PP statistics in Table 1, it can be found that all test statistics can pass the significance test of 1%, so we can reject the null hypothesis and the series is stationary. At the same time, this paper uses the unit circle method to test stability. By analyzing whether the characteristic root of each variable falls within the unit circle, the modulus of the characteristic root is determined to be less than 1. As shown in Figure 1, the characteristic roots of all variables lie within the unit circle. Therefore, the constructed model is stable and reliable.
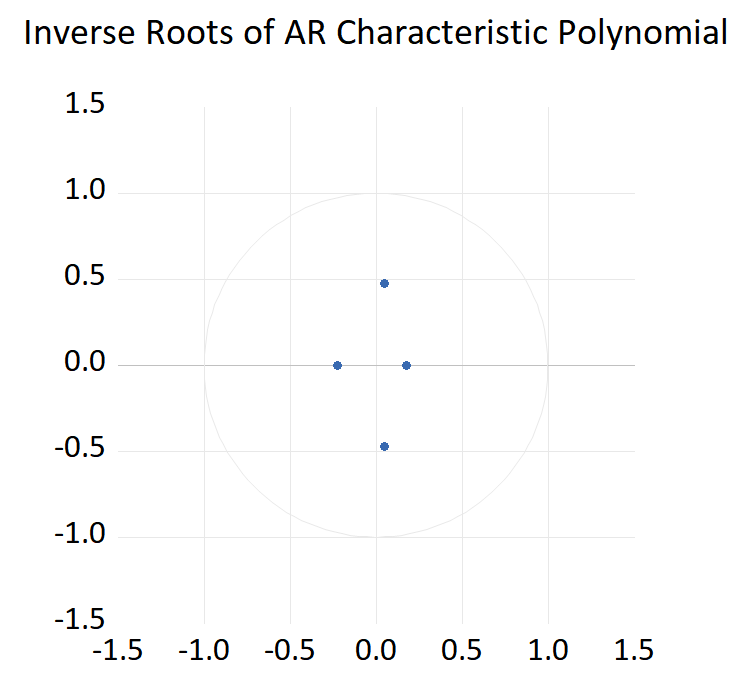
Figure 1: VAR model stability test judgment for HIS and CSI.
According to Fig. 1, I find that all points are located in the unit circle, and it can also be concluded that the sequence is stationary.
3.3. Result of VAR model
After passing the above tests, the VAR model is constructed, and the model results are shown in Table 3:
Table 3: Vector Auto-regression Estimates.
HK Hang Seng Index | FTSE CHI HK Index | |
HK Hang Seng Index (-1) | -0.913499 | -0.981443 |
(0.41985) | (0.47541) | |
[-2.17719] | [-2.06441] | |
HK Hang Seng Index (-2) | 0.724413 | 0.869184 |
(0.42134) | (0.47741) | |
[1.71930] | [1.82062] | |
FTSE CHI HK Index (-1) | 0.900490 | 0.966104 |
(0.36891) | (0.41800) | |
[2.44095] | [2.31125] | |
FTSE CHI HK Index (-2) | -0.745429 | -0.906930 |
(0.37245) | (0.42201) | |
[-2.00141] | [-2.14905] | |
C | -0.001221 | -0.001511 |
(0.00107) | (0.00122) | |
[-1.13624] | [-1.24075] | |
R-squared | 0.059450 | 0.062751 |
From Table 3, we can find that FTSE CHI index has a negative impact on Hong Kong Heng Seng Index in lag phase 1, and a positive impact in lag phase 2. However, the Hang Seng index of Hong Kong has a positive impact on the FTSE CHI index in the lag 1 period, while it has a negative impact in the lag 2 period. It can be seen that the mutual influence direction of the two indices remains consistent in lag 1 and lag 2 periods respectively, but the influence relationship will change with different lag periods. This may be due to external economic policy uncertainty or other factors at different times.
3.4. Impulse Response Function for HK Hang Seng Index and FTSE CHI HK Index
In this paper, the impulse response function is used to observe the dynamic interaction relationship and the dynamic interaction benefit between the described variables more intuitively. Impulse response analysis is a method to analyze the response degree of other variables when the random disturbance term of endogenous variables is affected by one unit standard deviation [10]. Fig. 2 and Fig. 3 below are the impulse response analysis charts of VAR model on HK Hang Seng Index and FTSE CHI HK Index. The abscissa in the figure is the response period number of impulse response, which is set as 10 in this paper. The vertical axis shows the response of a variable to a shock of one unit standard deviation. A solid line in the figure represents the impulse response trajectory, and the two dashed lines above and below represent the 95% confidence intervals. The impulse response results as follows:
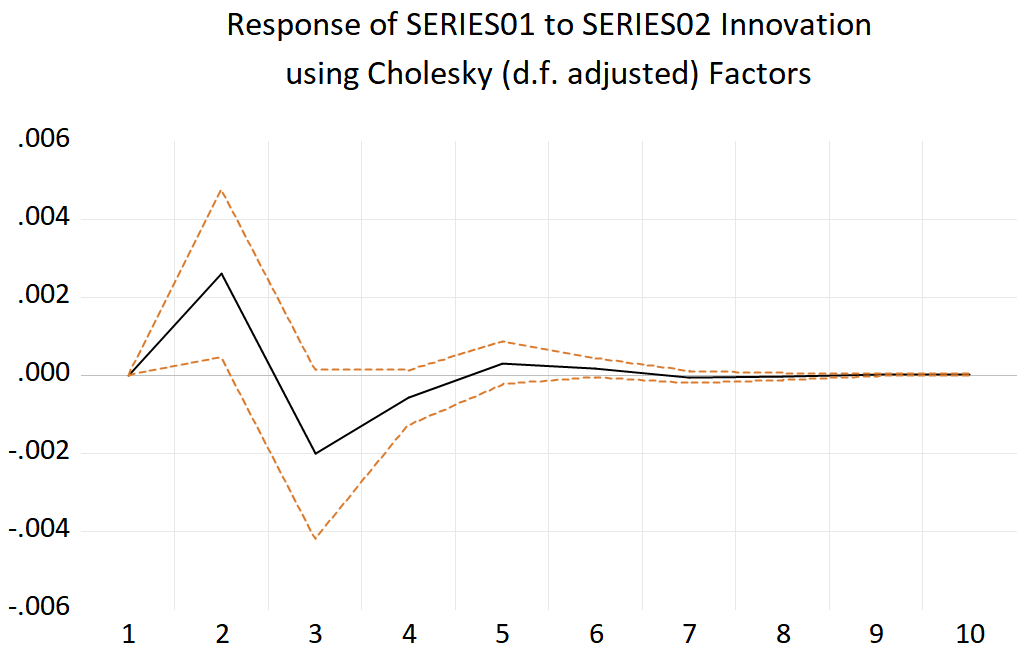
Figure 2: Impulse response of HK Hang Seng Index to FTSE CHI HK Index.
As can be seen from Figure 2, for HK Hang Seng Index, the impact of one standard deviation of FTSE CHI HK Index in the first stage is about 0.000, and there are positive and negative effects in the alternating response fluctuations. The maximum positive response value was about 0.028 in the second stage, and the maximum negative response value was -0.002 in the third stage. As the lag period increases, the effect converges to 0 from the 8th stage. This result shows that the impact of FTSE CHI HK Index on HK Hang Seng Index is complex, with the intersection of positive and negative responses. Finally, it approaches 0, indicating that HK Hang Seng Index has strong self-regulation ability.
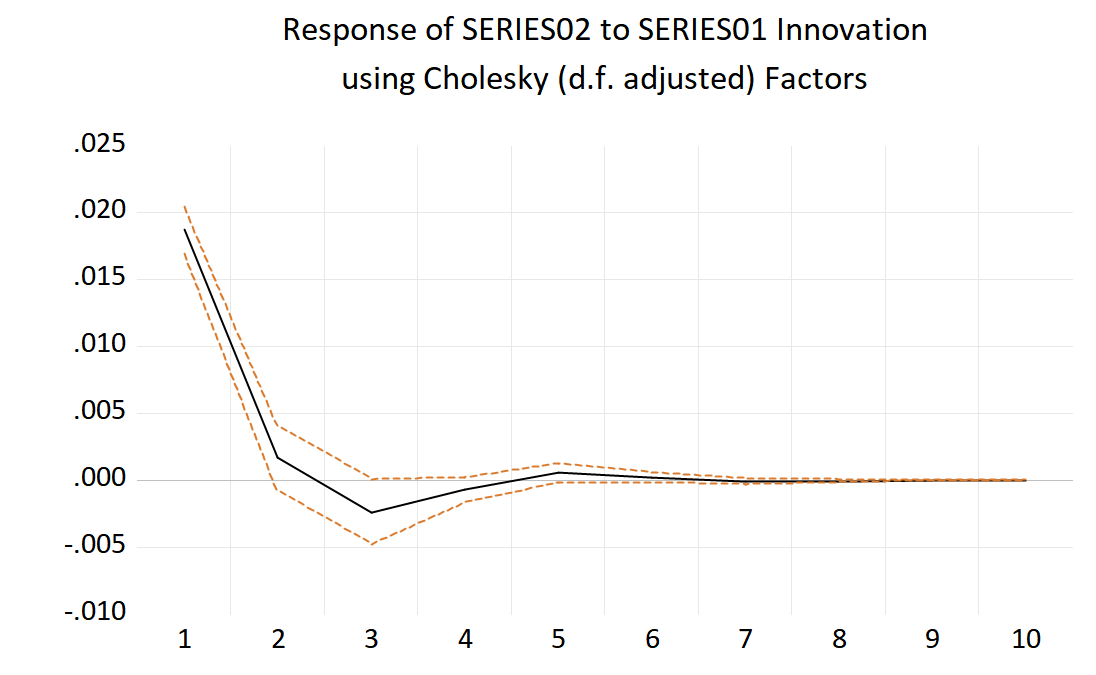
Figure 3: Impulse response of FTSE CHI HK Index to HK Hang Seng Index.
As can be seen from Figure 3, for the FTSE CHI HK Index, the impact of one standard deviation of HK Hang Seng Index in the first stage is about 0.018, and there are positive and negative effects in the alternating response fluctuations. The maximum positive response value was 0.0158 in the first stage, and the maximum negative response value was -0.0025 in the third stage. As the lag period increases, the effect converges to 0 from the seventh stage. This result shows that the impact of HK Hang Seng Index on FTSE CHI HK Index is complex, with the intersection of positive and negative responses. Finally, it approaches 0, indicating that the FTSE CHI HK Index has strong self-regulation ability.
3.5. Variance Decomposition
Variance decomposition transforms the mean square error of each endogenous variable into the contribution rate of each endogenous variable according to its causes [11], obtained the mutual influence degree of dynamic changes of HK Hang Seng Index and FTSE CHI HK Index. In this paper, the relationship between stock indexes of two different companies in Hong Kong is decomposed to different degrees, and the lag period is set as 10 cycles.
Table 4: Variance decomposition of HK Hang Seng Index.
Period | S.E. | FTSE CHI HK Index | HK Hang Seng Index |
1 | 0.016725 | 100.0000 | 0.000000 |
2 | 0.017001 | 97.65363 | 2.346372 |
3 | 0.017213 | 96.33556 | 3.664440 |
4 | 0.017234 | 96.22940 | 3.770596 |
5 | 0.017242 | 96.20185 | 3.798151 |
Table 4:(continued).
6 | 0.017244 | 96.19229 | 3.807713 |
7 | 0.017244 | 96.19132 | 3.808678 |
8 | 0.017244 | 96.19070 | 3.809298 |
9 | 0.017244 | 96.19068 | 3.809318 |
10 | 0.017244 | 96.19064 | 3.809356 |
According to variance decomposition of HK Hang Seng Index in Table 4, with the increase of lag period, FTSE CHI HK Index was influenced by HK Hang Seng Index and finally stabilized at about 96.1906%.
Table 5: Variance Decomposition of FTSE CHI HK Index.
Period | S.E. | FTSE CHI HK Index | HK Hang Seng Index |
1 | 0.016725 | 97.67121 | 2.328789 |
2 | 0.017001 | 95.62700 | 4.372995 |
3 | 0.017213 | 94.15150 | 5.848500 |
4 | 0.017234 | 94.04362 | 5.956382 |
5 | 0.017242 | 94.00769 | 5.992312 |
6 | 0.017244 | 93.99780 | 6.002203 |
7 | 0.017244 | 93.99652 | 6.003485 |
8 | 0.017244 | 93.99585 | 6.004151 |
9 | 0.017244 | 93.99582 | 6.004181 |
10 | 0.017244 | 93.99578 | 6.004223 |
According to the variance decomposition of FTSE CHI HK Index in Table 5, with the increase of lag period, HK Hang Seng Index was influenced by FTSE CHI HK Index and finally stabilized at about 93.995%.
4. Conclusion
Stock index is of great significance to study the overall development trend of the whole financial market industry. Hong Kong's Hang Seng index contains the most important banks, energy and other stocks in Hong Kong, while the FTSE CHI index contains the UK's dominant banking and financial industries. Thus, the interrelation between the HSI and the FTSE CHI is very large. Through the data combined with the model analysis, it is found that the FTSE CHI index is very strongly affected by the Hong Kong Hang Seng Index, and the Hong Kong Hang Seng Index is equally strongly affected by the FTSE CHI index, but slightly less than the former. Although the influence relationship between the two is very strong, the positive and negative relationship is often not very durable, and the opposite correlation is reflected in different lag periods, which also shows the self-regulation ability of the stock financial industry. Besides, the results from the impulse response function suggest that shock from one market may last for several periods in another market, and the results from the variance decomposition suggest that the index plays a crucial role in the variation of index futures, vice versa.
References
[1]. Liang, S., Cui, H., Yuan, C.: Stock index adjustments and analysts’ forecast optimism: A quasi-natural experiment on the CSI 300 Index. China Journal of Accounting Research 15(3) (2022).
[2]. Salisu, A. A., Ndako, U. B., Adediran, I. A., Swaray, R.: A fractional cointegration VAR analysis of Islamic stocks: A global perspective. The North American Journal of Economics and Finance 51 (2020).
[3]. Gan, C., Nartea, G. V., Wu, J.: Predictive ability of low-frequency volatility measures: Evidence from the Hong Kong stock markets. Finance Research Letters 26, 40-46 (2018).
[4]. Kot, H. W., Leung, H. K. M., Tang, G. Y. N.: The long-term performance of index additions and deletions: Evidence from the Hang Seng Index. International Review of Financial Analysis 42, 407-420 (2015). 5. Argyroudis, G., Siokis, F.: The complexity of the HANG SENG Index and its constituencies during the 2007–2008 Great Recession. Physica A: Statistical Mechanics and its Applications 495, 463-474 (2018).
[5]. Chen, Y., Yu, W.: Setting the margins of Hang Seng Index Futures on different positions using an APARCH-GPD Model based on extreme value theory. Physica A: Statistical Mechanics and its Applications 544, (2020).
[6]. Cavicchioli, M.: Goodness-of-fit tests for Markov Switching VAR models using spectral analysis. Journal of Statistical Planning and Inference 219, 189-203 (2022).
[7]. Doh, T., Smith, A. L.: A new approach to integrating expectations into VAR models. Journal of Monetary Economics (2022).
[8]. Kim, J. H.: Testing for parameter restrictions in a stationary VAR model: A bootstrap alternative. Economic Modelling 41, 267-273 (2014).
[9]. Chen, P., Semmler, W., Maurer, H.: Delayed Monetary Policy Effects in a Multi-Regime Cointegrated VAR(MRCIVAR). Econometrics and Statistics (2022).
[10]. Shin, H. C., Marsh, J. C.: Identifying relative strength of methadone versus health and social services in comprehensive substance use disorder treatment using a variance decomposition approach. Evaluation and Program Planning 92, 102060 (2022).
Cite this article
Cao,W. (2023). Study on the Relationship between Hang Seng Index and FTSE CHI Index in Hong Kong: Evidence from VAR Model. Advances in Economics, Management and Political Sciences,16,46-53.
Data availability
The datasets used and/or analyzed during the current study will be available from the authors upon reasonable request.
Disclaimer/Publisher's Note
The statements, opinions and data contained in all publications are solely those of the individual author(s) and contributor(s) and not of EWA Publishing and/or the editor(s). EWA Publishing and/or the editor(s) disclaim responsibility for any injury to people or property resulting from any ideas, methods, instructions or products referred to in the content.
About volume
Volume title: Proceedings of the 2nd International Conference on Business and Policy Studies
© 2024 by the author(s). Licensee EWA Publishing, Oxford, UK. This article is an open access article distributed under the terms and
conditions of the Creative Commons Attribution (CC BY) license. Authors who
publish this series agree to the following terms:
1. Authors retain copyright and grant the series right of first publication with the work simultaneously licensed under a Creative Commons
Attribution License that allows others to share the work with an acknowledgment of the work's authorship and initial publication in this
series.
2. Authors are able to enter into separate, additional contractual arrangements for the non-exclusive distribution of the series's published
version of the work (e.g., post it to an institutional repository or publish it in a book), with an acknowledgment of its initial
publication in this series.
3. Authors are permitted and encouraged to post their work online (e.g., in institutional repositories or on their website) prior to and
during the submission process, as it can lead to productive exchanges, as well as earlier and greater citation of published work (See
Open access policy for details).
References
[1]. Liang, S., Cui, H., Yuan, C.: Stock index adjustments and analysts’ forecast optimism: A quasi-natural experiment on the CSI 300 Index. China Journal of Accounting Research 15(3) (2022).
[2]. Salisu, A. A., Ndako, U. B., Adediran, I. A., Swaray, R.: A fractional cointegration VAR analysis of Islamic stocks: A global perspective. The North American Journal of Economics and Finance 51 (2020).
[3]. Gan, C., Nartea, G. V., Wu, J.: Predictive ability of low-frequency volatility measures: Evidence from the Hong Kong stock markets. Finance Research Letters 26, 40-46 (2018).
[4]. Kot, H. W., Leung, H. K. M., Tang, G. Y. N.: The long-term performance of index additions and deletions: Evidence from the Hang Seng Index. International Review of Financial Analysis 42, 407-420 (2015). 5. Argyroudis, G., Siokis, F.: The complexity of the HANG SENG Index and its constituencies during the 2007–2008 Great Recession. Physica A: Statistical Mechanics and its Applications 495, 463-474 (2018).
[5]. Chen, Y., Yu, W.: Setting the margins of Hang Seng Index Futures on different positions using an APARCH-GPD Model based on extreme value theory. Physica A: Statistical Mechanics and its Applications 544, (2020).
[6]. Cavicchioli, M.: Goodness-of-fit tests for Markov Switching VAR models using spectral analysis. Journal of Statistical Planning and Inference 219, 189-203 (2022).
[7]. Doh, T., Smith, A. L.: A new approach to integrating expectations into VAR models. Journal of Monetary Economics (2022).
[8]. Kim, J. H.: Testing for parameter restrictions in a stationary VAR model: A bootstrap alternative. Economic Modelling 41, 267-273 (2014).
[9]. Chen, P., Semmler, W., Maurer, H.: Delayed Monetary Policy Effects in a Multi-Regime Cointegrated VAR(MRCIVAR). Econometrics and Statistics (2022).
[10]. Shin, H. C., Marsh, J. C.: Identifying relative strength of methadone versus health and social services in comprehensive substance use disorder treatment using a variance decomposition approach. Evaluation and Program Planning 92, 102060 (2022).