


1. Introduction
A Certified Emissions Reduction, also known as CER, is a certificate issued by the United Nations to member nations for preventing one tonne of carbon dioxide emissions calculated per tonne of carbon dioxide equivalent [1]. CERs are traded as a commodity through the carbon trading system.
In 2021, the sixth report of the IPCC (Intergovernmental Panel on Climate Change) released the following essential data: The global temperature has risen by 1.1 degrees Celsius since the Industrial Revolution. Global carbon dioxide emissions grew from 208 million tonnes in 1850 to 36.2 billion in 2019. This means that the current global atmospheric carbon dioxide concentration and surface temperatures are the highest in 2 million years and 120,000 years respectively [2].
The total value of carbon market transactions reached a record high of EUR 760 billion in 2021, representing an increase of EUR 289 billion, or 164%, compared with the same period in 2020[3]. 2021 has been a remarkable year for the EU carbon allowance (EUA) market, with prices hitting an all-time high above €90 per tonne on December 8 and allowances in South Korea and the UK also rising by 70%.
Chinese carbon market construction has experienced the following four stages: 1. Constructed the first carbon market in September 2010. 2. Launched seven pilot carbon markets in the second half of 2013 and the first half of 2014. 3. two non-pilot regional markets went online at the end of 2016. 4. Oficially launched the national carbon market based on the power industry in July 2021. According to statistics, by the end of 2020, 331 million tons of carbon dioxide and 7.336 billion yuan of carbon dioxide were traded nationwide in the eight pilot carbon markets [4].
Regional carbon markets have become an essential means of reducing emissions. By 2021, China's pilot carbon markets will cover about 20% - 40% of the greenhouse gas emissions in each region, and the compliance rate (the proportion of enterprises that can fully pay their carbon quota in the total control and emission enterprises at the end of the period) is about 100%. Carbon markets have become an essential means of emission reduction in each region.
According to the 2021 final accounting results, the national carbon market covers about 4.5 billion tons of carbon emissions, estimated to account for about 40% of the country's total carbon emissions. In 2021, the activity of the national carbon emission trading market (referred to as the "national carbon market") increased significantly. Data show that as of December 31, 2021, the cumulative volume of carbon emission quota (CEA) in the national carbon market reached 179 million tons, accounting for 31.90% of the cumulative book in China's carbon market, and the turnover exceeded 7.6 billion yuan. Data released by the Shanghai Ring Exchange show that from the launch of July 16, 2021, to December 31, 2021, the national carbon emission permit trading market has been in operation for 114 trading days, the cumulative volume of carbon emission quota (CEA) of 179 million tons, the cumulative turnover of 7.661 billion yuan. Among them, the cumulative turnover of listing agreement transactions was 30.7746 million tons, and the cumulative turnover was 1.451 billion yuan; The cumulative turnover of bulk agreement transactions was 148.0148 million tons, and the cumulative turnover was 6.21 billion yuan. It closed at 54.22 yuan per ton on Dec 31, up 12.96% from the opening price on the first day. More than half of the critical emission units actively participate in the market [5].
2. Related Works
The transaction price of carbon emission rights can directly reflect the carbon market's relationship between supply and demand. Since 2013, each carbon emission trading pilot's trading volume has shown an upward trend in general [6]. The global carbon market is mainly concentrated in Europe, North America, and East Asia.
Prior research empirical analysis and research on the influencing factors of carbon emission rights have been made from different perspectives [7]. The macroeconomic environment, traditional energy prices, extreme weather, climate environment, carbon quota policy, and other factors will impact carbon emission trading pricing [8]. Some scholars believe that traditional energy prices, especially oil prices, positively impact carbon emission trading prices [9], while coal is negatively correlated with carbon emission trading prices [10]. At the same time, many scholars believe that extreme weather will increase energy consumption demand and affect carbon prices [11]. Among them, different regions are affected by other factors to varying degrees. For example, Jiang et al. (2022) pointed out that economic conditions and air quality in Hubei province have a significant impact on the fluctuation of local carbon emission permit prices, and energy price is an important reason for the change in carbon emission permit price in Hubei Province [12]. Other scholars pointed out that China's carbon emission trading price is bound to be affected by price fluctuations in the international carbon market [13].
Beijing Institute of Technology provides a review and prospects for China's carbon market in 2021 [5]. Yet, there are no definitive studies on the summarised analysis of carbon credits in the first half of 2022. Thus, our research is aimed to fill in the gap and focus on exploring the relationship between the two concepts. We would like to explore and analyze the carbon market in 2022 and make recommendations to enhance the trading activity of carbon market emissions.
3. Overview of the International Carbon Market (H1 2022)
As of April 2022, there were 68 carbon pricing schemes and three coming on stream, containing 37 carbon taxes and 34 emissions trading systems [14]. Since the release of ‘Carbon Pricing Status and Future Trends 2021', four new carbon pricing schemes have been implemented: one in Uruguay and others in North America (Ontario, Oregon, New Brunswick). Carbon pricing instruments control about 23% of global greenhouse gas emissions. Total greenhouse gas emissions under the carbon pricing tool increased by 1.5 % in the first half of 2022 compared to 2021 [14].
3.1. European Union Carbon Market
European Union's emissions trading system is the world's largest one; after falling sharply in early March, prices rose gradually in 2022. In July 2021, the EU released the 'Fit for 55' package. As part of the package, the EU proposed an overhaul of its carbon market to align it with the new EU 2030 climate target. The proposed reforms include adjusting emissions caps, adjusting the market Stability Reserve Mechanism to set stricter benchmarks, including the maritime transport sector, establishing a carbon border adjustment mechanism, and creating a new independent carbon market to cover fuel emissions from the construction and road transport sectors. This was one of the key factors driving the EU carbon price to a record high in 2021.
In the first half of 2022, the Russia-Ukraine war significantly affected the EU carbon market. The carbon price fell sharply from the end of February to the beginning of March (from the highest of 96.41 euros/ton to the lowest of 57.92 euros/ton), which was the most significant decline in the EU carbon price since 2014. This resulted in the European economy suffering a considerable setback since February 24, which weakened the demand for carbon allowances [15]. While international oil prices continue to hit record highs and energy prices such as natural gas, coal, and electricity continue to rise, the EU carbon price has fallen sharply. The price gradually recovered after March 7 and hovered around €80 to €85 / tonne throughout June, finally reaching €89.77 / tonne on June 30, close to the EU carbon market transaction price at the end of 2021. However, compared with a general upward trend of the carbon price in 2021, it was relatively volatile and sharply declined in the first half of 2022. Since then, carbon prices have rebounded after several months and have risen to a level similar to early 2022.
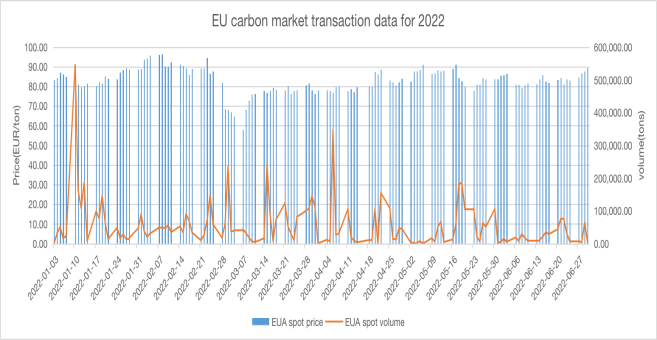
Figure 1: EU carbon market transaction data for 2022.
3.2. South Korea's Carbon Market
Korea is the seventh largest emitter of greenhouse gases among OECD industrialised countries [16]. At the Copenhagen climate Conference held in 2009, South Korea pledged to reduce its greenhouse gas emissions by 30% in 2020 compared with the Business-as-usual scenario [17,18]. To achieve this goal, Korea has been building a national carbon market since 2009 and officially started trading in January 2015. By November 2017, about 599 companies, including five domestic airlines, had been included in South Korea's carbon market, accounting for 68% of the country's total greenhouse gas emissions. Carbon market trading in South Korea is conducted in three phases, Phase 1 (2015-2017), Phase 2 (2018-2020), and Phase 3 (2021-2025) [19,20]. The allocation of quotas has transitioned from being completely free of charge to a predominantly free allocation, supplemented by paid auctions. From the third stage, financial institutions will enter a secondary trading market based on carbon allowances to improve the market maker system in the second stage. Specifically, the Korean carbon market allowed other players, such as securities firms and individuals, to enter the secondary market; second, derivatives were introduced to enhance market functioning and ensure stability and flexibility in trading terms [21].
The average daily trading volume in South Korea rose sharply with 447.47 million tons traded on June 14, setting a new record for the country in 2022. Although trading volume rose sharply, South Korea's carbon price is still meagre, and the price recovery momentum is insufficient. On June 13, carbon prices hit the most inadequate record of $10.33/tonne. Such a significant fluctuation is mainly due to South Korea's carbon market has set an upper limit on the quota allowed to be stored, which forces market participants to sell the excess percentage. The rapid increase of quota supply in South Korea's carbon market in the short term brings downward pressure to the short-term price. The new Korean government has decided to establish and operate more than 100 local government carbon-neutral support centres by 2027 to practice carbon neutrality. Additionally, it decided to use carbon-neutral green cities as a representative model for each region. Moreover, it will follow the EU precedent of introducing nuclear power plants into the green classification system in 2023. This aimed to attract and support funding from the nuclear industry and promote complementarity in the green classification system. From 2022 until 2026, the government will provide comprehensive advice to SMEs on ESG (environmental, social and governance) management to promote green industries and technologies by expanding environmental labelling schemes and strengthening certification standards.
4. The Operation of China's National Carbon Market
4.1. The Overview of the Chinese National Carbon Market
By July 15, 2022, the first anniversary of the launch of online trading of the national carbon market, the total volume of quota trading in the national carbon market was 194 million tons, and the total turnover was nearly 8.5 billion yuan [22]. Among them, the trading volume of the listing agreement was 32.5928 million tons, and the turnover was 1.556 billion yuan; The importance of bulk agreement trading was 161 million tons, with a turnover of 6.936 billion yuan. The number of enterprises participating in the trading has exceeded half of the total number of critical emitters, and the compliance rate of market quotas has reached 99.5% [23].
4.2. The Number of Crucial Emission Companies in Each Region
Figure 2 shows the number of carbon emission companies in 16 provinces. Compared with 2021, it shows an upward trend, but there are still significant differences in the distribution among different regions. Shandong province has the most companies, while Hainan Province has the least. Shandong and Jiangsu provinces have more than 200 critical companies covered, which is much higher than others, while Hainan has only eight.
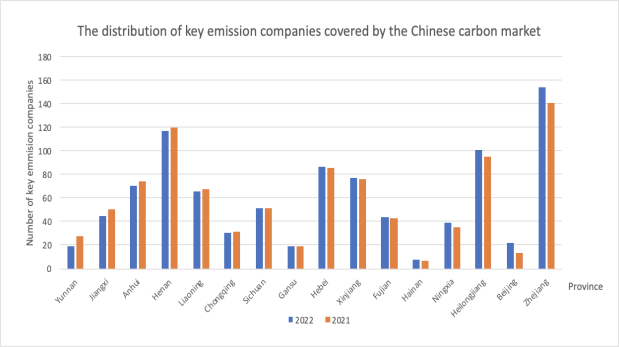
Figure 2: The distribution of crucial emission companies covered by the Chinese carbon market.
4.3. Market Trading Volume Declines, and Market Activity Drops Sharply
Figure 3 shows the fluctuations of daily trading volume in the national carbon market in the first half of 2022, screening by average daily quota. Compared to the book in December 2021, which was between 5 and 10 million tons, the volume in 2022 decreased significantly. In January, February, and March, the total volume of online listing and offline block trading was 1.352 million tons and 8.89 million tons, respectively [24].
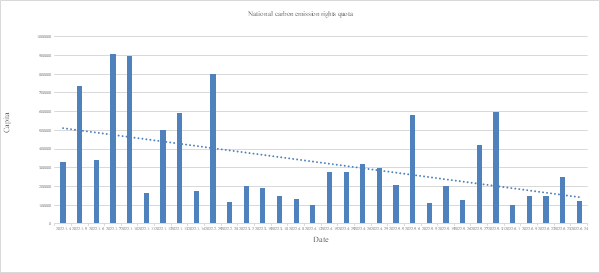
Figure 3: National carbon emission rights quota.
The enormous daily trading volume of nearly 3.2 million tonnes in the first half of 2022 came in early January, which is much higher than that in other months. From February, the book has shown a significant downward trend, and the average daily volume is less than 400,000 tons. Overall, the maturity of the national carbon market needs to be significantly improved.
At the same time, there was less than a 5% turnover rate in the national carbon market. Currently, the EU carbon market is the world's most actively traded carbon market. The turnover rate has increased from 417% to 500% [25]. Compared with the EU carbon market, the Chinese national carbon market is less active, and the trading atmosphere is relatively cold, so there is much room for improvement.
4.4. Daily Transaction Average Price
By the end of the first half of 2022, CEA had a cumulative turnover of 194 million tons and a turnover of 8.464 billion yuan, with an average transaction price of 43.74 yuan/ton [26]. Figure 4 shows the changing daily transaction average price trend in the national carbon market. Compared with the second half of 2021, the everyday transaction price from January to March fluctuated between 56 and 62 yuan/ton, which was significant. Although the daily transaction price fell sharply in early January, it recovered at the end of the month and reached the highest everyday transaction price in the first half of the year. Since April, the volatility gradually decreased, and at the end of May, it slowly remained stable, maintaining around 59 yuan/ton. Overall, the national carbon market daily transaction average price is regular.
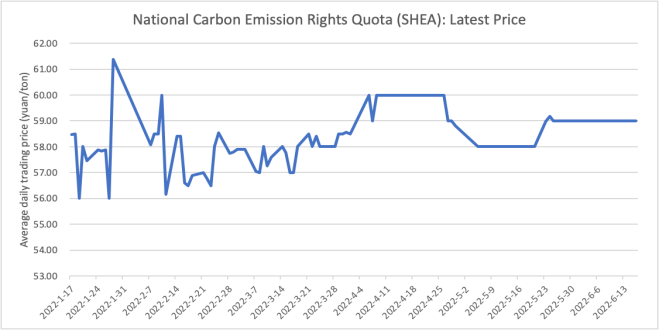
Figure 4: National carbon emission rights quota (SHEA): latest price.
4.5. Block Trading is the Primary Way to Trade
The transfer of carbon emission rights agreement includes two ways: listing transactions and block trading. The amount below 100,000 tons will be classified as a listing transaction, and the amount above 100,000 tons (including) will be concluded by block trading. Figure 5 shows the daily price and the percentage of trading volume of list transactions and block trading in the Chinese carbon market.
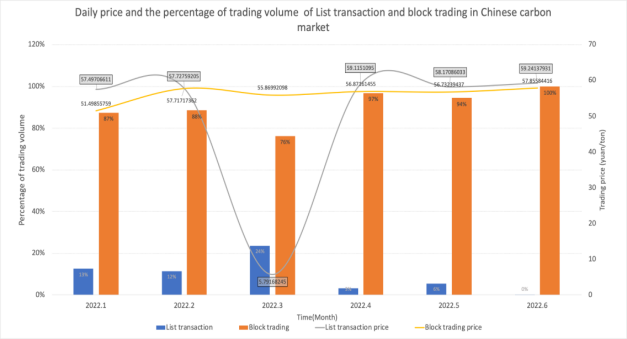
Figure 5: Daily price and the percentage of trading volume of List transaction and block trading in the Chinese carbon market.
In the first half of 2022, the cumulative volume of block trading was 1,319,4581ton, accounting for a much higher proportion than listing agreements, with 90% and 10% respectively [26]. Block trading is the primary way in the current national carbon market. The main reason is that block trading is dominated by flexible pricing, a small impact on floor trading price, high efficiency, and low trading cost. Large groups have more advantages in reducing the overall performance cost by using the limit of rising and falling block trading.
There is little difference comparing the average daily price of the National Carbon Market listing agreement with the block trading, which is maintained between 57 and 60 yuan/ton. The cost of the listing agreement is slightly higher than that of the bulk deal. In March 2022, there was a significant decline in the average daily price of listing trading, possibly due to the global carbon market changes caused by the war between Russia and Ukraine that broke out on February 24, 2022. Russia plays a vital role in the worldwide energy supply system as the world's largest gas exporter and second-largest oil exporter. In 2021, Russia exported about 230 million tons of oil and 252 billion cubic meters of natural gas, accounting for 11 percent and 16 percent of the world's total [27]. Rosneft accounts for 15% of China's crude oil imports, 8% of its liquefied natural gas imports, and 9% of its pipeline gas imports [28]. Hence, this may lead to significant changes in the national carbon market.
5. Carbon Market Outlook for the Second Half of 2022 and 2023
Carbon pricing is the basis of the EU's efforts to reduce emissions from energy-intensive sectors such as power generation and heavy industry. As one of the world's largest producers of natural gas, oil, and coal, Russia has close ties with European countries and Europe is very dependent on Russian fossil energy. Although the uncertainty of the European energy supply to Russia is high, the carbon price is inclined to be decoupled. In theory, the cost of gas and the carbon price generally correlate positively. Still, since February 23, the EU's carbon price, in contrast to the performance of the gas price, the EU carbon credits (EUA) has been down about 40% since the war between Russia and Ukraine. Gas price is rising; with the new European champions league in March 2020 outbreak, the carbon quota fell to 15 euros/ton. There are three views on the main reasons for decoupling the two prices. Qin Yan, chief power and carbon analyst at Refinitiv, and others believe that the market panic caused the selling. Investors reduced their exposure to euro-pegged assets and sold carbon allowances because of concerns about the European Union's economic situation. Other people such as Ingvild Sorhus, chief analyst at EU Carbon Analysis argued: “The carbon price is now decoupling from the rest of the energy complex, which has risen on Russian supply concerns [29]. Some participants may be exposed to large losses due to surging energy prices and forced to sell EUA to avoid margin calls.” High energy prices bring losses to investors. Industrial enterprises must sell carbon quotas to cash out and improve liquidity, leading to oversupply and a sharp drop in carbon prices. The final argument is that carbon prices fall because of expected demand declines. (Due to the conflict between Russia and Ukraine, energy security will become the focus of EU policy rather than climate policy in the short term, so institutional investors, including funds, are pessimistic about the carbon market in the short time [30]. Three main reasons carbon prices fell and decoupled from energy prices in March 2022. First, market panic led to technical selling; second, liquidity demand cut positions; and third, expected demand decline. But the long-term outlook is unchanged.) [30]
Putting short-term shock pressures aside, the fundamentals of the EU carbon market have not changed much. Hence, carbon prices will slowly rise. While downward economic pressures will reduce emissions and demand for allowances, high gas prices will keep coal consumption high in Europe this year, driving up power generation emissions and increasing demand for allotments. The European Parliament is still debating proposals to further strengthen carbon markets as a cornerstone of the EU's new climate strategy [30]. With excessive market speculation driving up CO2 prices to the detriment of producers, more industries are calling on the EU to postpone negotiations and review the extension of reforms to the EU ETS (emissions Trading Scheme). However, it still expects the proposal to tighten the market and support a steady rise in carbon prices. The dependence on Russian energy has made the EU more determined to accelerate the green transition; carbon market mechanisms and carbon price signals remain potent tools to promote this process. Germany, Italy, Spain, and others have all called for short-term increases in coal use to counter the risk of disruptions to Russian gas supplies. For instance, In Germany, the coalition government has proposed a carbon price of 60 euros; this could still be implemented to stabilise the carbon market and make the carbon price work as an incentive for transition.
Since February, the global energy market has suffered a second crisis. First, it is due to the influence of international relations such as the Russia-Ukraine conflict. Second, the Northern Hemisphere has been experiencing extreme heat since March. Affected by climate change and other factors, Asia, Europe, and North America have experienced a wide range of high temperatures, especially in Europe, which has led to more than 600 deaths, resulting in drought, fire, and other secondary disasters. However, the influence of the international environment, such as the conflict between Russia and Ukraine, the tight energy supply, and the sharp decline of renewable energy generation, have brought more complex and severe challenges [31]. In the high-temperature environment, power resources are affected the most. Taking Europe as a representative, many countries face the contradiction of power supply and demand. How to save electricity and reserve energy reasonably has become a big problem. To reduce carbon dioxide emissions and achieve carbon neutrality as soon as possible, European countries have been in the vanguard of energy conservation and emission reduction, having long publicly committed to phasing out coal energy. In December 2019, the European Commission proposed the "European Green Deal," which aims to make Europe climate neutral by 2050. Before this, no new coal and petrochemical projects will be added, and specific emission reduction quotas will be set for the construction, agriculture, and transportation sectors [31]. However, due to the high temperatures, many European countries are planning to restart coal power plants, which has cast a shadow of uncertainty over the currently hot "carbon neutrality" target.
In addition to the Ukraine war and economic crisis, in 2022, a pair of gas pipe explosions also impacted the international carbon market. On June 14, America's largest natural gas export company announced that it would not be able to export gas until around the end of 2022 due to an explosion at its facility in the Gulf of Mexico, Texas and that it planned to complete the restart of part of the facility within 90 days. Since the Russia-Ukraine conflict, Europe has strongly resisted Russian gas to sanction Russia and reduce its dependence on Russian gas supplies. The two sides have gone through many rounds of tug-of-war on energy issues, leading to a significant increase in energy prices in Europe, including gas, and the risk of supply cuts, with the US promising to ease its supply gap by exporting more liquefied natural gas (LNG) to Europe [32]. On 26 September, Nord Stream 1 and Nord Stream 2, the main pipelines carrying natural gas between Russia and Europe, suffered considerable damages and underwater explosions in the leak area [33]. Firstly, the increase in energy prices due to reduced supply will exacerbate Europe's woes. The incident will also hit European norms for energy efficiency and emissions reduction. As of 30 September local time, the Norwegian Institute for Atmospheric Research said that at least 80,000 tonnes of methane gas had spread into the ocean and atmosphere after a large methane cloud formed over the area following the Nord Stream gas pipeline leak and continued to spread. Methane is a significant component of natural gas and an important greenhouse gas. The incident has also dealt a massive blow to global carbon reduction targets.
Due to the influence of international relations, climate, energy, and unexpected events, the global carbon market has undergone drastic fluctuations. Due to the uncertainty and severity of the development of these events, the carbon market has been severely hit, and the future of the international carbon market and the change in carbon price will be difficult to predict.
6. Conclusion
In conclusion, although the quota implementation rate in China's carbon market is over 99.5%, there are still large differences in the distribution of key emitters in China's carbon market among different provinces, which is related to the differences in energy consumption structure, economic development level, and government supervision. Less than 5% of the volume traded in the national carbon market changes hands. Currently, the EU carbon market is the most actively traded globally. The turnover rate has increased from 417% in 2021 to 500%. Compared with the EU carbon market, the national carbon market in China is less active, and the trading atmosphere is relatively quiet, so there is much room for improvement. At the same time, according to the article by the Beijing Institute of Technology on China's Carbon Market and Review (2022), compared with the first half of 2021, the outbreak of war between Russia and Ukraine in the first half of 2022 has a greater impact on the global carbon market [26]. It is expected that the Chinese market will continue to deepen its cooperation with the global carbon market and begin to explore the road to internationalisation. It is recommended to learn from the international carbon market development experience, coordinating the differences between China and international carbon emission trading mechanisms, and accelerating the internationalisation process of China's carbon market. At the same time, as the world's largest carbon market covering greenhouse gas emissions, China's national carbon market is expected to play a scale advantage in the construction of the global carbon market.
Acknowledgment
Xiaoyu Zhu, Xiang Li, and Xin Huang contributed equally to this work and should be considered co-first authors.
References
[1]. Francois, M., & Hamaide, B. (2011) Certified emission reductions weights for improved CDM projects. Environmental Policy and Governance, 21(1), 31-41.
[2]. Wang, M CN. (2021) Min Wang: There is no need to limit energy demandbecause of the “two-carbon” target. http://www.china.com.cn/opinion/think/2021-11/02/content_77846305.htm.
[3]. Liu, J., & Yu, A CN. (2022) Carbon trading system construction: What can we learn from the EU? - Two-carbon time. https://www.2ctime.com/tanjiaoyi/19539.html.
[4]. Tan, Z CN. (2022) Carbon know Xia: What is China’s carbon market, one article lao understand - double carbon time. https://www.2ctime.com/shuangtankuaibao/12010.html.
[5]. Wang, K., Li, S., Lu, M., Wang, J., Wei, Y (2021) China Carbon Market Review and Outlook (2022), Forecast and Outlook Report CEEP-BIT-2022-006 (No. 62).
[6]. Gao, P.,L, F.,(2021) Analysis on the influencing factors of carbon emission trading price. Cooperative economy and science and technology., 20:78-80.
[7]. Zhang, Y & Zhou, X.(2022) Comparative analysis of influencing factors of carbon emission permit price in the context of carbon neutrality. Chinese market., 2022(15): 27-29.
[8]. Li, Y.(2020)An Empirical Study on Influencing Factors of Carbon Emissions Trading Pricing. Price Theory and Practice., 06:146-149.
[9]. Wang, Z & Hu,Y.(2018) Analysis of the factors influencing the price of carbon emissions trading in China. Industrial technology and economics., 37 (2): 128-136.
[10]. Bai, Q., Dong, J., Tian, Y. (2022) Study on the fluctuation characteristics and influencing factors of carbon emission trading price in China. Statistics and Decision, 38(05): 161-165.
[11]. Jin, Y & Deng ,M.(2021) Research Progress on the value assessment of carbon emission permits. China Asset Evaluation., 2021(05):48-54.
[12]. Jiang, S., Jiang, Y., Wei, J., Wang, Y..(2022) Multi-factor research on the price fluctuation of carbon emission rights from the perspective of finance: Taking Hubei Province as an example. Wuhan Finance., 2022(07): 12-19.
[13]. Jiang, Y., & Wu, Z. (2021) Regression analysis of Influencing factors of Chinese carbon emission trading price. Environment and Sustainable Development.,46(01):77-78.
[14]. The World Bank. (2022) Interpretation of World Bank 2022 Carbon Pricing Status and Trends Report (I) : Carbon tax (Z. Qi, Ed.). WeiYang; The World Bank. https://www.weiyangx.com/407527.html.
[15]. Shi, W. (Ed.). (2022) Simkus: The escalation in Ukraine could have a major impact on the European economy. Jrj.com.cn. https://m.jrj.com.cn/madapter/usstock/2022/01/27000734227679.shtml.
[16]. Meng, Y., Wang, L., Wei, Y., Shi, Z., & Luo, Z. (2022) Time-frequency dynamics, co-movement and causality among returns of global carbon emissions trading schemes (ETSs): A tale of four markets. Journal of Cleaner Production, 363, 132564.
[17]. Wu, W. (2010) The strategic conception of carbon emission allocation in the post-Kyoto era (2012-2020). Journal of Nanjing University of Technology, 2010.11(D416). https://doi.org/1671-7287(2010)02-0018-05.
[18]. Xu, J. (2016) CHINA’S CO2 CABON EMISSIONS STUDY ON THE AFFECTING FACTORS AND REDUCTION COUNTERMEASURES. Social Science Acedamic Press(China).
[19]. Chen, Z., & Lin, L. (2021) Review and prospect of the construction of global carbon market. Environment and Sustainable Development, 2021(3), 38, 44. https://doi.org/10.19758 /j.cnki.issn1673-288x.202103008.
[20]. Hong, R. (2021) Analysis on the characteristics of Korean carbon Market and its referential significance for China.tanjiaoyi.com; IIGF. http://www.tanjiaoyi.com/article-32968-1.html.
[21]. Liu, H., Liu, Z., & Feng, C. (2021) Overview of global carbon market development in 2020 and implications for China’s carbon market construction. Finance.sina.com.cn; International Institute of Green Finance, Central University of Finance and Economics. https://finance.sina.com.cn/esg/2021-09-08/doc-iktzscyx2976758.shtml.
[22]. Li, H., Zhou, F., & Shang, Y. (2021) Problems and countermeasures of green finance development in Shanghai from the perspective of carbon peaking and carbon neutrality. Shanghai Economy, 2021(6), 61, 75. https://doi.org/1000-4211(2021)06-0061-15.
[23]. Lai, X., & Du, B. (2022) National carbon emission trading market practice and challenges. Shanghai Environment and Energy Exchange, 2022.15(860), 21, 23. https://doi.org/10.14115/j.cnki.zgcz.2022.15.008.
[24]. Xu, P. (2022) How can the national carbon market get out of the doldrums? Www.hxny.com; Caijing11. https://www.hxny.com/nd-72196-0-17.html.
[25]. Xie, X., Ma, Z., & Xiao, Z. (2022) Development and optimization of carbon equity market. China Academic Journal Electronic Publishing House, 2022(08), 67, 68.
[26]. Wang, K., & Li, S. (2022) Review and Prospect of China’s Carbon Market (2022). Journal of Beijing Institute of Technology(Social Sciences Edition), 1, 15. https://doi.org/10.15918/j.jbitss1009-3370.2022.0271.
[27]. Zhang, S. (2019) Analysis of the impact of energy transition on geopolitics. China Academic Journal Electronic Publishing House, 2019(8), 26, 33.
[28]. Xinjianan. (2021) What Impacts Will the Russia-Ukraine Conflict Have on the Global Low-carbon Energy Transition Process? . Efchina.org. https://www.efchina.org/Blog-en/blog-20220526-en.
[29]. Qing, Y. (2022) The challenges facing the EU carbon market under the new Energy Supply “order.” News.bjx.com.cn. https://news.bjx.com.cn/html/20220615/1233288.shtml.
[30]. Sueyl. (2022) The Russia-Ukraine war changed the logic of the market! Energy prices are soaring and carbon markets are tumbling! News.bjx.com.cn. https://news.bjx.com.cn/html/20220309/1209054.shtml.
[31]. Zhao, T. (2022) How much of an energy crisis caused by high temperatures will affect global “carbon neutrality”?. China Academic Journal Electronic Publishing House, 36, 37.
[32]. Jjckb. (2022) High gas prices weigh on economic activity in Europe. Www.investgo.cn. https://www.investgo.cn/article/gb/fxbg/202208/620222.html.
[33]. Wu, W. (2022) Nord Stream Explosion: Will Europe’s Energy Crisis Worsen? China Academic Journal Electornic Publishing House, 66, 67.
Cite this article
Zhu,X.;Li,X.;Huang,X.;Lin,Z. (2023). An empirical Analysis of Chinese Carbon Emissions Market Trading in the First Half of 2022. Advances in Economics, Management and Political Sciences,17,14-24.
Data availability
The datasets used and/or analyzed during the current study will be available from the authors upon reasonable request.
Disclaimer/Publisher's Note
The statements, opinions and data contained in all publications are solely those of the individual author(s) and contributor(s) and not of EWA Publishing and/or the editor(s). EWA Publishing and/or the editor(s) disclaim responsibility for any injury to people or property resulting from any ideas, methods, instructions or products referred to in the content.
About volume
Volume title: Proceedings of the 2nd International Conference on Business and Policy Studies
© 2024 by the author(s). Licensee EWA Publishing, Oxford, UK. This article is an open access article distributed under the terms and
conditions of the Creative Commons Attribution (CC BY) license. Authors who
publish this series agree to the following terms:
1. Authors retain copyright and grant the series right of first publication with the work simultaneously licensed under a Creative Commons
Attribution License that allows others to share the work with an acknowledgment of the work's authorship and initial publication in this
series.
2. Authors are able to enter into separate, additional contractual arrangements for the non-exclusive distribution of the series's published
version of the work (e.g., post it to an institutional repository or publish it in a book), with an acknowledgment of its initial
publication in this series.
3. Authors are permitted and encouraged to post their work online (e.g., in institutional repositories or on their website) prior to and
during the submission process, as it can lead to productive exchanges, as well as earlier and greater citation of published work (See
Open access policy for details).
References
[1]. Francois, M., & Hamaide, B. (2011) Certified emission reductions weights for improved CDM projects. Environmental Policy and Governance, 21(1), 31-41.
[2]. Wang, M CN. (2021) Min Wang: There is no need to limit energy demandbecause of the “two-carbon” target. http://www.china.com.cn/opinion/think/2021-11/02/content_77846305.htm.
[3]. Liu, J., & Yu, A CN. (2022) Carbon trading system construction: What can we learn from the EU? - Two-carbon time. https://www.2ctime.com/tanjiaoyi/19539.html.
[4]. Tan, Z CN. (2022) Carbon know Xia: What is China’s carbon market, one article lao understand - double carbon time. https://www.2ctime.com/shuangtankuaibao/12010.html.
[5]. Wang, K., Li, S., Lu, M., Wang, J., Wei, Y (2021) China Carbon Market Review and Outlook (2022), Forecast and Outlook Report CEEP-BIT-2022-006 (No. 62).
[6]. Gao, P.,L, F.,(2021) Analysis on the influencing factors of carbon emission trading price. Cooperative economy and science and technology., 20:78-80.
[7]. Zhang, Y & Zhou, X.(2022) Comparative analysis of influencing factors of carbon emission permit price in the context of carbon neutrality. Chinese market., 2022(15): 27-29.
[8]. Li, Y.(2020)An Empirical Study on Influencing Factors of Carbon Emissions Trading Pricing. Price Theory and Practice., 06:146-149.
[9]. Wang, Z & Hu,Y.(2018) Analysis of the factors influencing the price of carbon emissions trading in China. Industrial technology and economics., 37 (2): 128-136.
[10]. Bai, Q., Dong, J., Tian, Y. (2022) Study on the fluctuation characteristics and influencing factors of carbon emission trading price in China. Statistics and Decision, 38(05): 161-165.
[11]. Jin, Y & Deng ,M.(2021) Research Progress on the value assessment of carbon emission permits. China Asset Evaluation., 2021(05):48-54.
[12]. Jiang, S., Jiang, Y., Wei, J., Wang, Y..(2022) Multi-factor research on the price fluctuation of carbon emission rights from the perspective of finance: Taking Hubei Province as an example. Wuhan Finance., 2022(07): 12-19.
[13]. Jiang, Y., & Wu, Z. (2021) Regression analysis of Influencing factors of Chinese carbon emission trading price. Environment and Sustainable Development.,46(01):77-78.
[14]. The World Bank. (2022) Interpretation of World Bank 2022 Carbon Pricing Status and Trends Report (I) : Carbon tax (Z. Qi, Ed.). WeiYang; The World Bank. https://www.weiyangx.com/407527.html.
[15]. Shi, W. (Ed.). (2022) Simkus: The escalation in Ukraine could have a major impact on the European economy. Jrj.com.cn. https://m.jrj.com.cn/madapter/usstock/2022/01/27000734227679.shtml.
[16]. Meng, Y., Wang, L., Wei, Y., Shi, Z., & Luo, Z. (2022) Time-frequency dynamics, co-movement and causality among returns of global carbon emissions trading schemes (ETSs): A tale of four markets. Journal of Cleaner Production, 363, 132564.
[17]. Wu, W. (2010) The strategic conception of carbon emission allocation in the post-Kyoto era (2012-2020). Journal of Nanjing University of Technology, 2010.11(D416). https://doi.org/1671-7287(2010)02-0018-05.
[18]. Xu, J. (2016) CHINA’S CO2 CABON EMISSIONS STUDY ON THE AFFECTING FACTORS AND REDUCTION COUNTERMEASURES. Social Science Acedamic Press(China).
[19]. Chen, Z., & Lin, L. (2021) Review and prospect of the construction of global carbon market. Environment and Sustainable Development, 2021(3), 38, 44. https://doi.org/10.19758 /j.cnki.issn1673-288x.202103008.
[20]. Hong, R. (2021) Analysis on the characteristics of Korean carbon Market and its referential significance for China.tanjiaoyi.com; IIGF. http://www.tanjiaoyi.com/article-32968-1.html.
[21]. Liu, H., Liu, Z., & Feng, C. (2021) Overview of global carbon market development in 2020 and implications for China’s carbon market construction. Finance.sina.com.cn; International Institute of Green Finance, Central University of Finance and Economics. https://finance.sina.com.cn/esg/2021-09-08/doc-iktzscyx2976758.shtml.
[22]. Li, H., Zhou, F., & Shang, Y. (2021) Problems and countermeasures of green finance development in Shanghai from the perspective of carbon peaking and carbon neutrality. Shanghai Economy, 2021(6), 61, 75. https://doi.org/1000-4211(2021)06-0061-15.
[23]. Lai, X., & Du, B. (2022) National carbon emission trading market practice and challenges. Shanghai Environment and Energy Exchange, 2022.15(860), 21, 23. https://doi.org/10.14115/j.cnki.zgcz.2022.15.008.
[24]. Xu, P. (2022) How can the national carbon market get out of the doldrums? Www.hxny.com; Caijing11. https://www.hxny.com/nd-72196-0-17.html.
[25]. Xie, X., Ma, Z., & Xiao, Z. (2022) Development and optimization of carbon equity market. China Academic Journal Electronic Publishing House, 2022(08), 67, 68.
[26]. Wang, K., & Li, S. (2022) Review and Prospect of China’s Carbon Market (2022). Journal of Beijing Institute of Technology(Social Sciences Edition), 1, 15. https://doi.org/10.15918/j.jbitss1009-3370.2022.0271.
[27]. Zhang, S. (2019) Analysis of the impact of energy transition on geopolitics. China Academic Journal Electronic Publishing House, 2019(8), 26, 33.
[28]. Xinjianan. (2021) What Impacts Will the Russia-Ukraine Conflict Have on the Global Low-carbon Energy Transition Process? . Efchina.org. https://www.efchina.org/Blog-en/blog-20220526-en.
[29]. Qing, Y. (2022) The challenges facing the EU carbon market under the new Energy Supply “order.” News.bjx.com.cn. https://news.bjx.com.cn/html/20220615/1233288.shtml.
[30]. Sueyl. (2022) The Russia-Ukraine war changed the logic of the market! Energy prices are soaring and carbon markets are tumbling! News.bjx.com.cn. https://news.bjx.com.cn/html/20220309/1209054.shtml.
[31]. Zhao, T. (2022) How much of an energy crisis caused by high temperatures will affect global “carbon neutrality”?. China Academic Journal Electronic Publishing House, 36, 37.
[32]. Jjckb. (2022) High gas prices weigh on economic activity in Europe. Www.investgo.cn. https://www.investgo.cn/article/gb/fxbg/202208/620222.html.
[33]. Wu, W. (2022) Nord Stream Explosion: Will Europe’s Energy Crisis Worsen? China Academic Journal Electornic Publishing House, 66, 67.