


1. Introduction
As the global economy rapidly goes digital, demand for chips has skyrocketed across industries. New chip demand markets such as artificial intelligence, self-driving cars, and industrial Internet continue to grow. On the other hand, work, life, and entertainment methods such as home office, smart home, and virtual reality are also becoming popular in the digital age, which has led to a continuous increase in global chip demand. Due to the Covid-19 global epidemic, as well as the US blockade and sanctions, the development of China's chip industry was hindered for a long period. Affected by the shortage of talent in the Chip industry, the crisis of lack of chips in China continues to spread. According to data from the General Administration of Customs, the total number of chips imported by China in 2021 was 635.48 billion, an increase of 16.9% over the same period [1]. According to the latest chip market research report released by IC Insights, a semiconductor research institute, in 2021, American companies will account for 55% of the total sales of the global chip market, while mainland China will only account for 5%, significantly lagging behind the United States[2]. In addition, in Gartner's latest list of the top ten semiconductor companies in 2021, American companies occupy 7 seats, with a combined market share of 33.2%. Chip design is inseparable from design software, namely EDA, and the top three EDA companies in the world are all American companies. In terms of equipment, the world's most important semiconductor equipment lithography machine is produced in the Netherlands, but some of the core components required for the equipment are produced by American manufacturers. Silicon wafer is an important material for making integrated circuits. By performing photolithography and ion implantation on silicon wafers, integrated circuits and various semiconductor devices can be made. Japan has obvious advantages in semiconductor production materials. The world's top two manufacturers of silicon wafers for integrated circuits are Japan's Shin-Etsu and SUMCO, accounting for more than 60% of the world's; the large-size silicon wafers produced by these two companies account for more than 70% of the world’s requirement, forming an absolute monopoly and extremely high technical barriers. The development level of China's chips is still far behind that of foreign countries. It lacks core technologies and relies heavily on foreign chip imports. With the development of globalization, and under such background, the overall economic development situation of the United States is closely related to the development of China's chip industry. This research paper used VAR and ARMA-GARCH models to discover the relationship between USD to RMB exchange rate and the index level of China's mainland chip industry.
In fact, the RMB has been falling against the USD in the first half of 2022. Analysis suggests that in the short term, the USD index is expected to remain high in the face of monetary tightening by the Federal Reserve, which will keep the RMB exchange rate under pressure. However, the direct impact of exchange rate depreciation will increase the import cost of importing enterprises. There is a very deep connection between the depreciation of the human life currency and the shortage of the chip industry. Nowadays, the development of the global semiconductor industry shows a "Moore's Law" slowdown. The division of labor in the industry chain is characterized by accelerated adjustment from a high degree of globalization and integration to regionalization and parallelization. The chip industry's "Moore's Law" has slowed down. Moore's law means that every 2 years (or 18 months) the number of transistors integrated into the chip can double. It is mainly based on the integrated circuit manufacturing process advances to achieve, so that the chip function, performance, and energy efficiency ratio increased significantly, and cost reduction. For half a century, the development of the semiconductor industry has followed Moore's Law. However, after entering the 10nm and below advanced process, chip manufacturing is increasingly difficult and costly, doubling the performance is difficult to do, and Moore's law has become slower. And the manufacturing and design of advanced chips depend on EUV (Extreme Ultraviolet) lithography equipment and advanced EDA (Electronic Design Automation) design tools, and the development of core semiconductor technology requires long-term investment. In addition, the exchange rate between China and the United States also ushered in a storm. After falling below "7" in September this year, it took less than three months for the RMB to rise back. on December 5, the onshore and offshore RMB to USD spot exchange rates both rose above round number 7. the highest point of the offshore RMB was 6.9336. since November, the RMB to USD exchange rate has seen a rapid, the RMB has been rising rapidly against the USD. The offshore yuan, for example, hit a low of 7.3566 on Nov. 1 and a high of 6.9336 at around 17:30 on Dec. 5, which means the yuan rose 4,230 basis points in more than a month. First, from the external point of view, as the US inflation falls back and economic growth slows down, the Fed's monetary policy tightening strength and rhythm has also loosened, and the interest rate hike process is nearing its end, the dollar index has started to fall back, and the strongest period of the dollar may have ended, which has weakened the pressure of RMB depreciation. Secondly, from the internal point of view, on the one hand, the epidemic prevention and control policies around the world are optimized and improved, more scientific and precise, and the impact of the epidemic on economic and social life is expected to gradually weaken; on the other hand, from the central to local level, all are grasping the window period of the fourth quarter, and the Chinese economy is bound to sprint at full speed at the end of the year, and all kinds of policy initiatives to stabilize growth should be strengthened to play an effective role, all these factors are conducive to the resumption of growth and stabilization of fundamentals in the Chinese economy These factors are conducive to the resumption of growth and stabilization of fundamentals in China's economy, which will also push the RMB to strengthen.
The structure of the rest of this paper is as follows: In the second part, the research design is presented, including the data source, the Augmented Dickey-Fuller Unit Root Test, and the ARMA-GARCHX model setting. The third part of the paper presents the Empirical Results and Analysis, including a thorough discussion of the results from the VAR model and the ARMA-GARCH model, as well as additional analysis on the Impulse Response, stock returns, stock volatility, and market participants' behavior. Part 4 is discussion and the final part of the paper briefly reiterates the main conclusions.
2. Research Design
2.1. Data Source
In the modern world, exchange rates are constantly changing over time. However, these changes in exchange rates also affect the price of chips. The data on chips and USD to RMB exchange rates are mainly from Eastern Fortune. Orient Fortune Information Co., Ltd, or Orient Fortune for short. It is a listed company on the Shenzhen Stock Exchange in mainland China. The time period of the data is from December 31, 2015, to December 5, 2022. The period of this data is quite volatile. And the data of this time period has very great reliability and provability. Secondly, this paper talks about the VAR model and ARMA-GARCH model dutifully analyzes and summarizes the data in detail, and constructs the model for further discussion [3].
2.2. Unit Root Test
Verifying that the data is stationary is the first step before proceeding. According to the ADF test performed in Stata, the p-values of the price and yield of chips in the chart are both equal to 0 (please see Table 1). The p-values in both price and output are equal to 0, which is considered statistically significant. Thanks to these discoveries. The evidence is sufficient to reject the claim that the variable has a unit root [4].
Table 1: ADF test.
Variables | t-statistic | p-value |
Price | ||
Exchange rate | -1.471 | 0.8390 |
Chip index | -13.585 | 0.0000*** |
Yield | ||
Exchange rate | -4.127 | 0.0058*** |
Chip index | -13.182 | 0.0000*** |
2.3. VAR Model Specification
The VAR model does not need to distinguish between endogenous and exogenous variables, and it is easy to forecast because the explanatory variables are lagged. Of course, the number of parameters to be estimated can be large. Second, VAR models are usually used to estimate the dynamic relationships of joint endogenous variables. This is achieved by auto-regressing all the current period variables in the model on a number of period lags of all variables. For example:
\( {Y_{t}}={α_{1}}+{∅_{11}}{Y_{t-1}}+⋯+{e_{1t}} \) (1)
\( {X_{t}}={α_{1}}+{∅_{21}}{Y_{t-1}}+⋯+{e_{2t}} \) (2)
\( {Z_{t}}={α_{1}}+{∅_{31}}{Y_{t-1}}+⋯+{e_{3t}} \) (3)
Although some analyses suggest an effect of chips and exchange rates, few studies have shown a strong correlation between stock returns and daily chip increases. In this context, a VAR model is chosen and there are three independent time series variables denoted as (1), (2), and (3) to generate the three-radiation VAR(p) model. If one needs to calculate the value of the chip and the shift in the exchange rate has to be modeled with one variable and the historical values of the other two variables. Similarly, the structure of the equation for the remaining two variables is the same, but the variables and coefficients are changed on the left side of the equation [5].
2.4. ARMA-GARCHX Model Specification
The ARMA-GARCH model evaluates the return and volatility of chips due to the US dollar exchange rate. This paper divides the model into two parts: ARMA and GARCH.
\( {y_{t}}={∅_{0}}+\sum _{i=1}^{p}{∅_{i}}{y_{t-i}}+{α_{i}}-\sum _{i=1}^{p}{∅_{i}}{α_{t-i}} \) (4)
The general expression of the ARMA model is shown above. AR(p) is represented by the components (4), while the rest of the equation is MA(q). AR(p) applies the past dollar exchange rate and the price of the chip to calculate the future value of the chip, while MA(q) uses the error term for forecasting.
Then comes the other part of the GARCH. The GARCH is fundamentally derived from the ARCH and both treat volatility as the variance to be modeled. In this paper, GARCH (1,1) is considered, where the first 1 denotes an autoregressive lag and the second 1 denotes a moving average lag. GARCH (1,1) is chosen for the following reasons: it has fewer parameters than ARCH(p); it fits many time series well enough to identify volatility clusters in the data. And it requires only one lag for the analysis. As a result, the model GARCH (1,1) was chosen.
\( σ_{t}^{2}={α_{0,1}}+{α_{1}}ε_{t-1}^{2}+{β_{t}}{m_{t}}+{γ_{1}}σ_{t-1}^{2} \) (5)
In the above equation, term \( {α_{1}}ε_{t-1}^{2} \) is ARCH part and \( {γ_{1}}σ_{t-1}^{2} \) represents GARCH part, and the additional term \( {β_{t}}{m_{t}} \) other than the generalized formula represents exchange rate that acted as an extra explanatory variable in the model [6].
3. Empirical Results and Analysis
3.1. Order of VAR Model
The likelihood ratio test can be used to determine the optimal order of a vector autoregressive model. As it shows in Table 2, basic procedures are, firstly, fitting the multiple VAR models with different orders. Secondly, likelihood ratio statistics of the model could be calculated by comparing the model to a saturated model, which is the difference in the log likelihoods of the two models [7]. Thirdly, the p-value for the likelihood ratio statistic should be calculated by using a chi-squared distribution. If the p-value is less than the specific significance level, say, 0.05, then the model being tested is preferred over the saturated model. In this way, the optimal order of VAR Model is determined by choosing the model with the lowest p-value [8]. In Table 2, it is evident that lag 7 has the lowest p-value 0.015, which is smaller than 0.05, indicating that the best model according to the LR criterion would be the VAR model with 7 lags.
Table 2: VAR model identification.
Lag | LL | LR | p | FPE | AIC | HQIC | SBIC |
0 | 1644.18 | 5.2e-09* | -13.4056* | -13.3941* | -13.377* | ||
1 | 1646.02 | 3.6753 | 0.452 | 5.3e-09 | -13.3879 | -13.3534 | -13.3022 |
2 | 1646.88 | 1.7157 | 0.788 | 5.4e-09 | -13.3623 | -13.3047 | -13.2194 |
3 | 1649.02 | 4.2725 | 0.370 | 5.5e-09 | -13.3471 | -13.2665 | -13.147 |
4 | 1650.36 | 2.6938 | 0.610 | 5.6e-09 | -13.3254 | -13.2218 | -13.0682 |
5 | 1650.89 | 1.0549 | 0.901 | 5.8e-09 | -13.2971 | -13.1705 | -12.9827 |
6 | 1651.14 | .49012 | 0.974 | 5.9e-09 | -13.2664 | -13.1168 | -12.8949 |
7 | 1657.33 | 12.392* | 0.015 | 5.8e-09 | -13.2843 | -13.1117 | -12.8556 |
8 | 1658.61 | 2.562 | 0.634 | 6.0e-09 | -13.2621 | -13.0665 | -12.7763 |
9 | 1661.83 | 6.4361 | 0.169 | 6.0e-09 | -13.2558 | -13.0371 | -12.7127 |
10 | 1664.86 | 6.068 | 0.194 | 6.1e-09 | -13.2479 | -13.0062 | -12.6477 |
11 | 1668.97 | 8.2067 | 0.084 | 6.0e-09 | -13.2487 | -12.984 | -12.5913 |
12 | 1669.37 | .80856 | 0.937 | 6.2e-09 | -13.2194 | -12.9316 | -12.5048 |
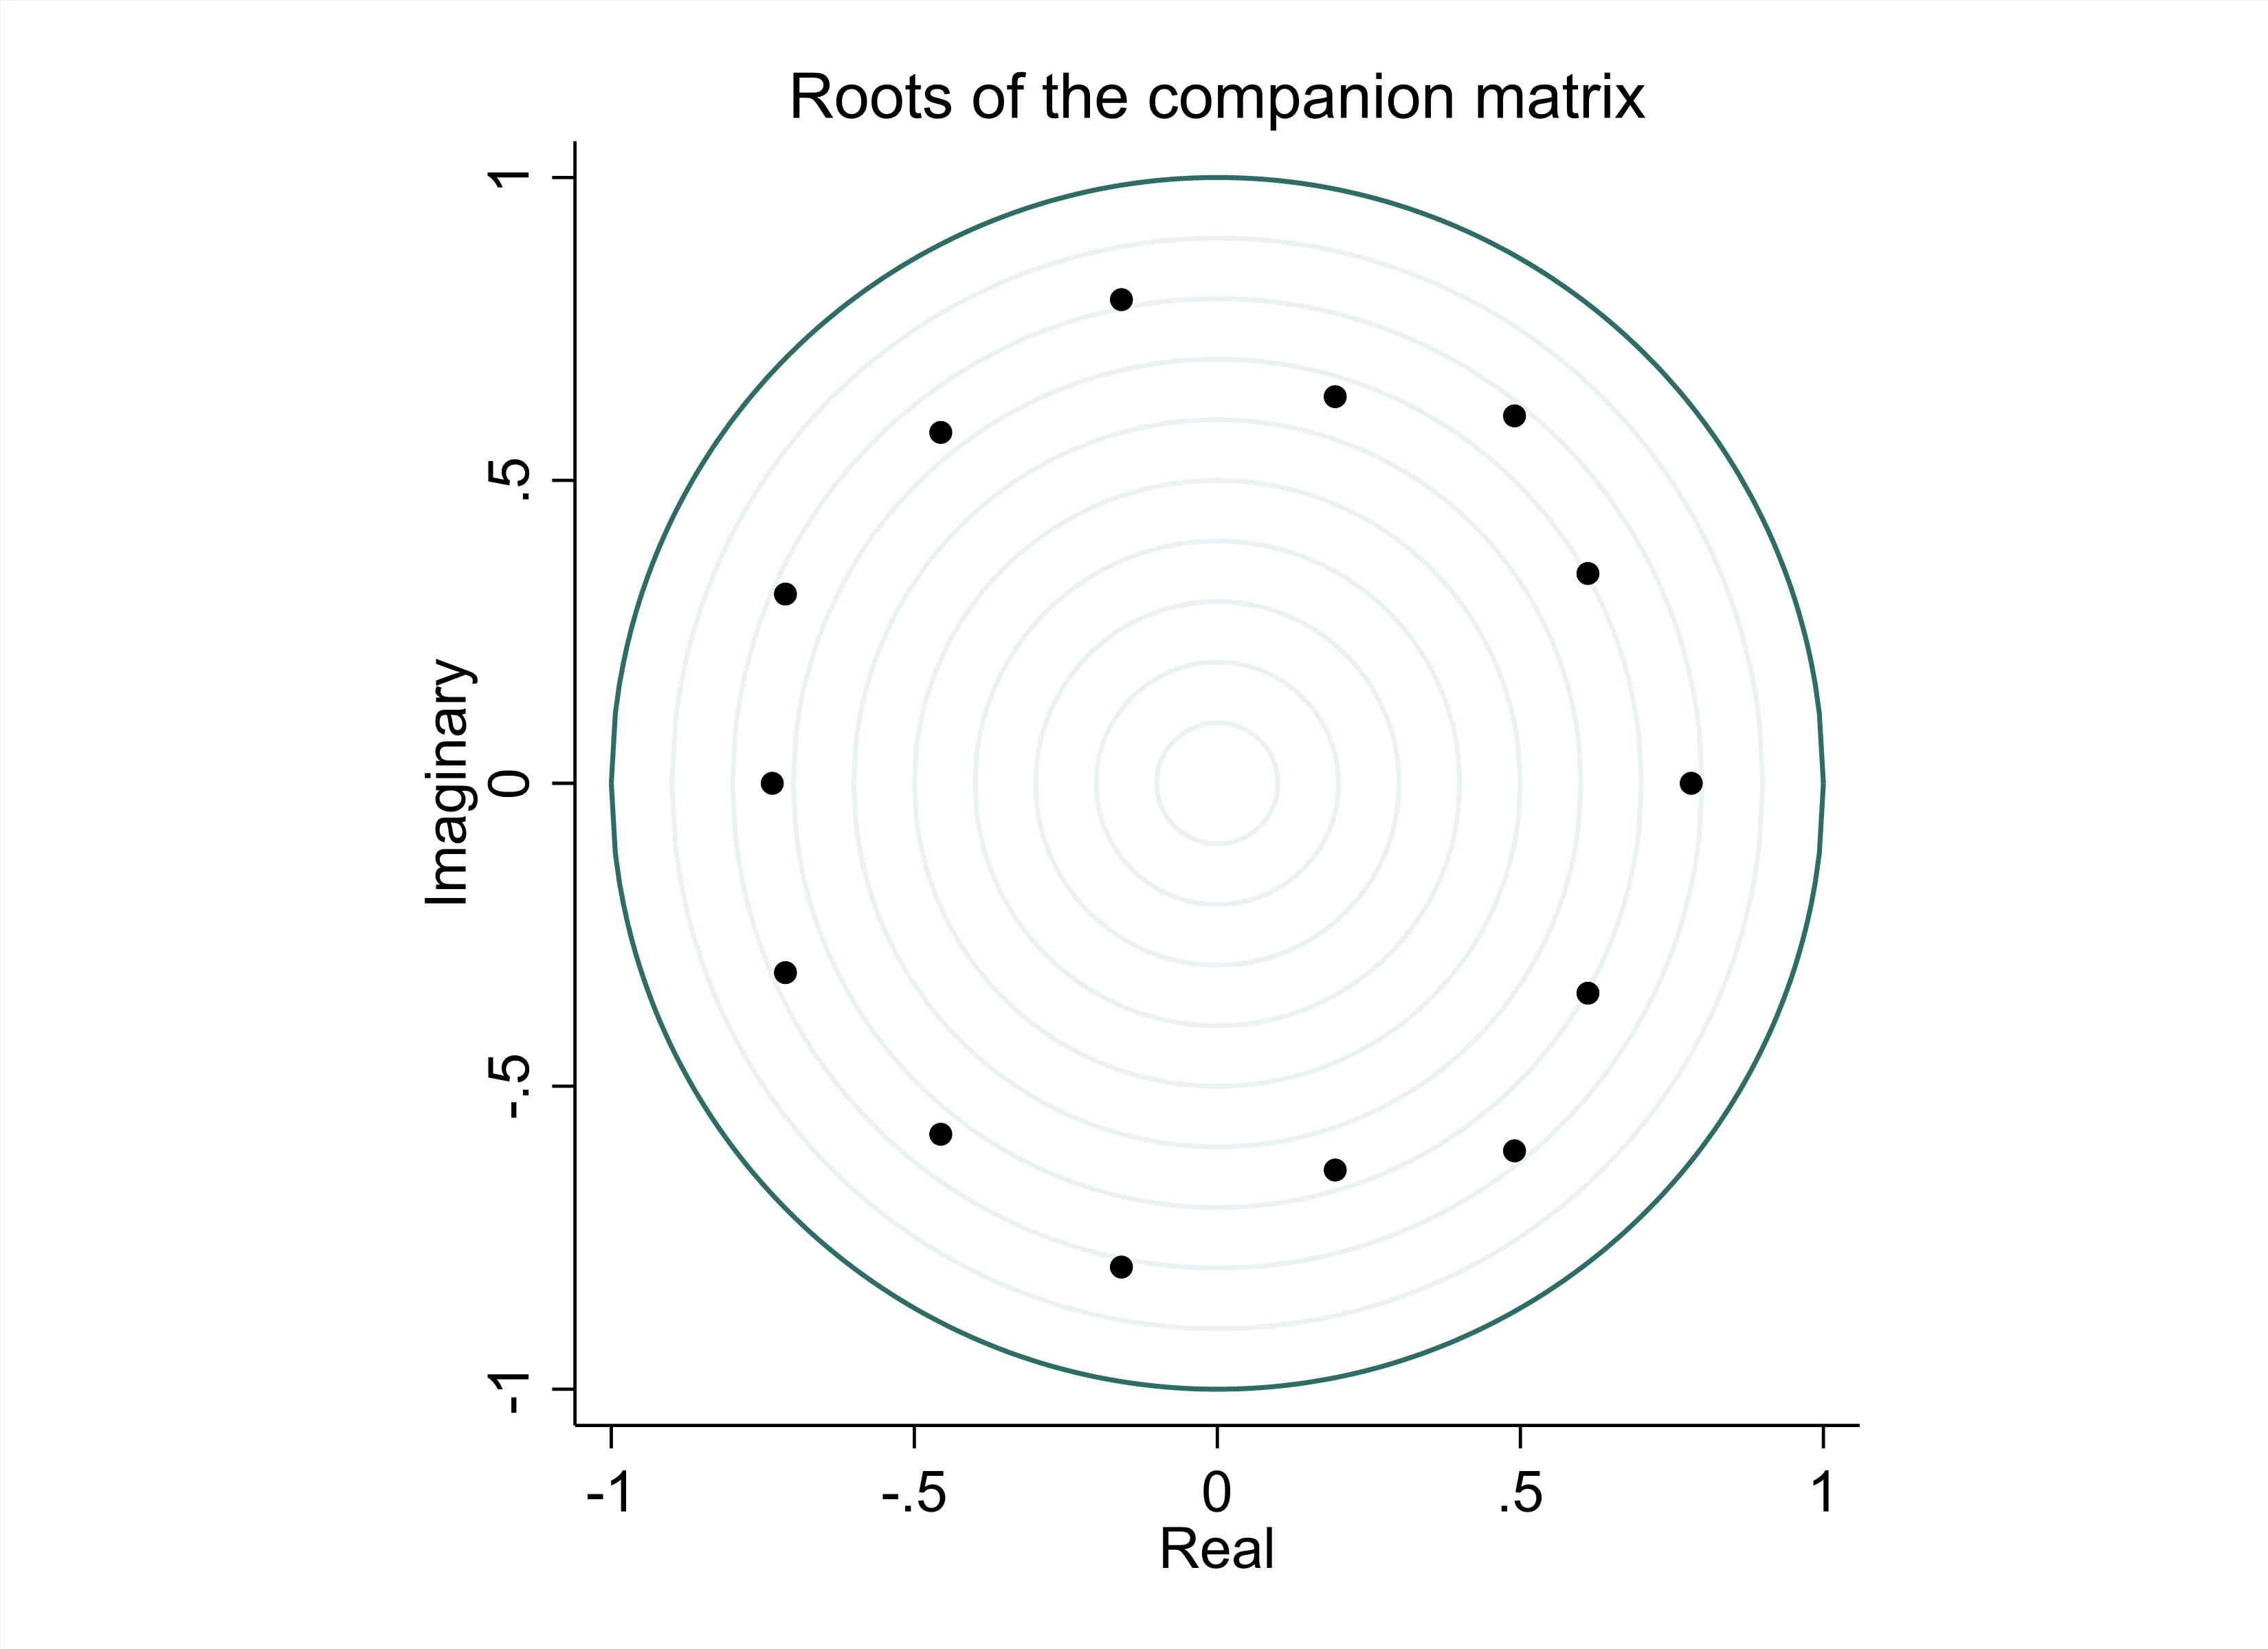
After determining the optimal order of the model, it is necessary to check whether the vector autoregressive model is a stationary process. If all of the eigenvalues are within the unit circle, then the VAR system is a stationary process [9]. Therefore, by examining Figure 1, it can be determined that the three-radiation VAR (7) model is a stationary process.
|
Figure 1: VAR stability. (Photo credit: Original) |
3.2. Impulse Response
The appreciation of the US dollar against the Chinese renminbi can have a range of economic consequences. One potential consequence is that it may make Chinese goods more expensive for Americans, as they will require more dollars to purchase the same amount of renminbi. This could lead to a decrease in demand for Chinese products such as chip, which could in turn lead to a decline in Chinese exports [10]. At the same time, the appreciation of the dollar against the renminbi may make American goods more affordable for Chinese consumers, which could lead to an increase in American exports and a boost to the US economy.
Another potential consequence of the dollar appreciation is that it may make it more expensive for Chinese companies to borrow in dollars, as they will have to pay back their loans with more renminbi than they would have if the exchange rate had been more favorable [10]. This could lead to a decrease in foreign investment in Chinese chip industry, as investors may be less likely to provide financing to Chinese chip firms if they anticipate receiving less in return due to the exchange rate.
In addition, the appreciation of the dollar against the renminbi may impact the competitiveness of Chinese chip firms in the global market. If their goods become more expensive due to the exchange rate, they may struggle to compete with firms from other countries whose goods are relatively cheaper. This could lead to a decline in the market share of Chinese chip company and a corresponding decrease in their profits. However, as the chip industry is a highly internationalized industry, the appreciation of dollar may somehow benefit Chinese domestic chip companies.
However, theoretical analysis cannot determine whether the changes in exports, foreign investment, and competitiveness in the global market has a dominant influence, and the dominance of these three effects may also alternate.
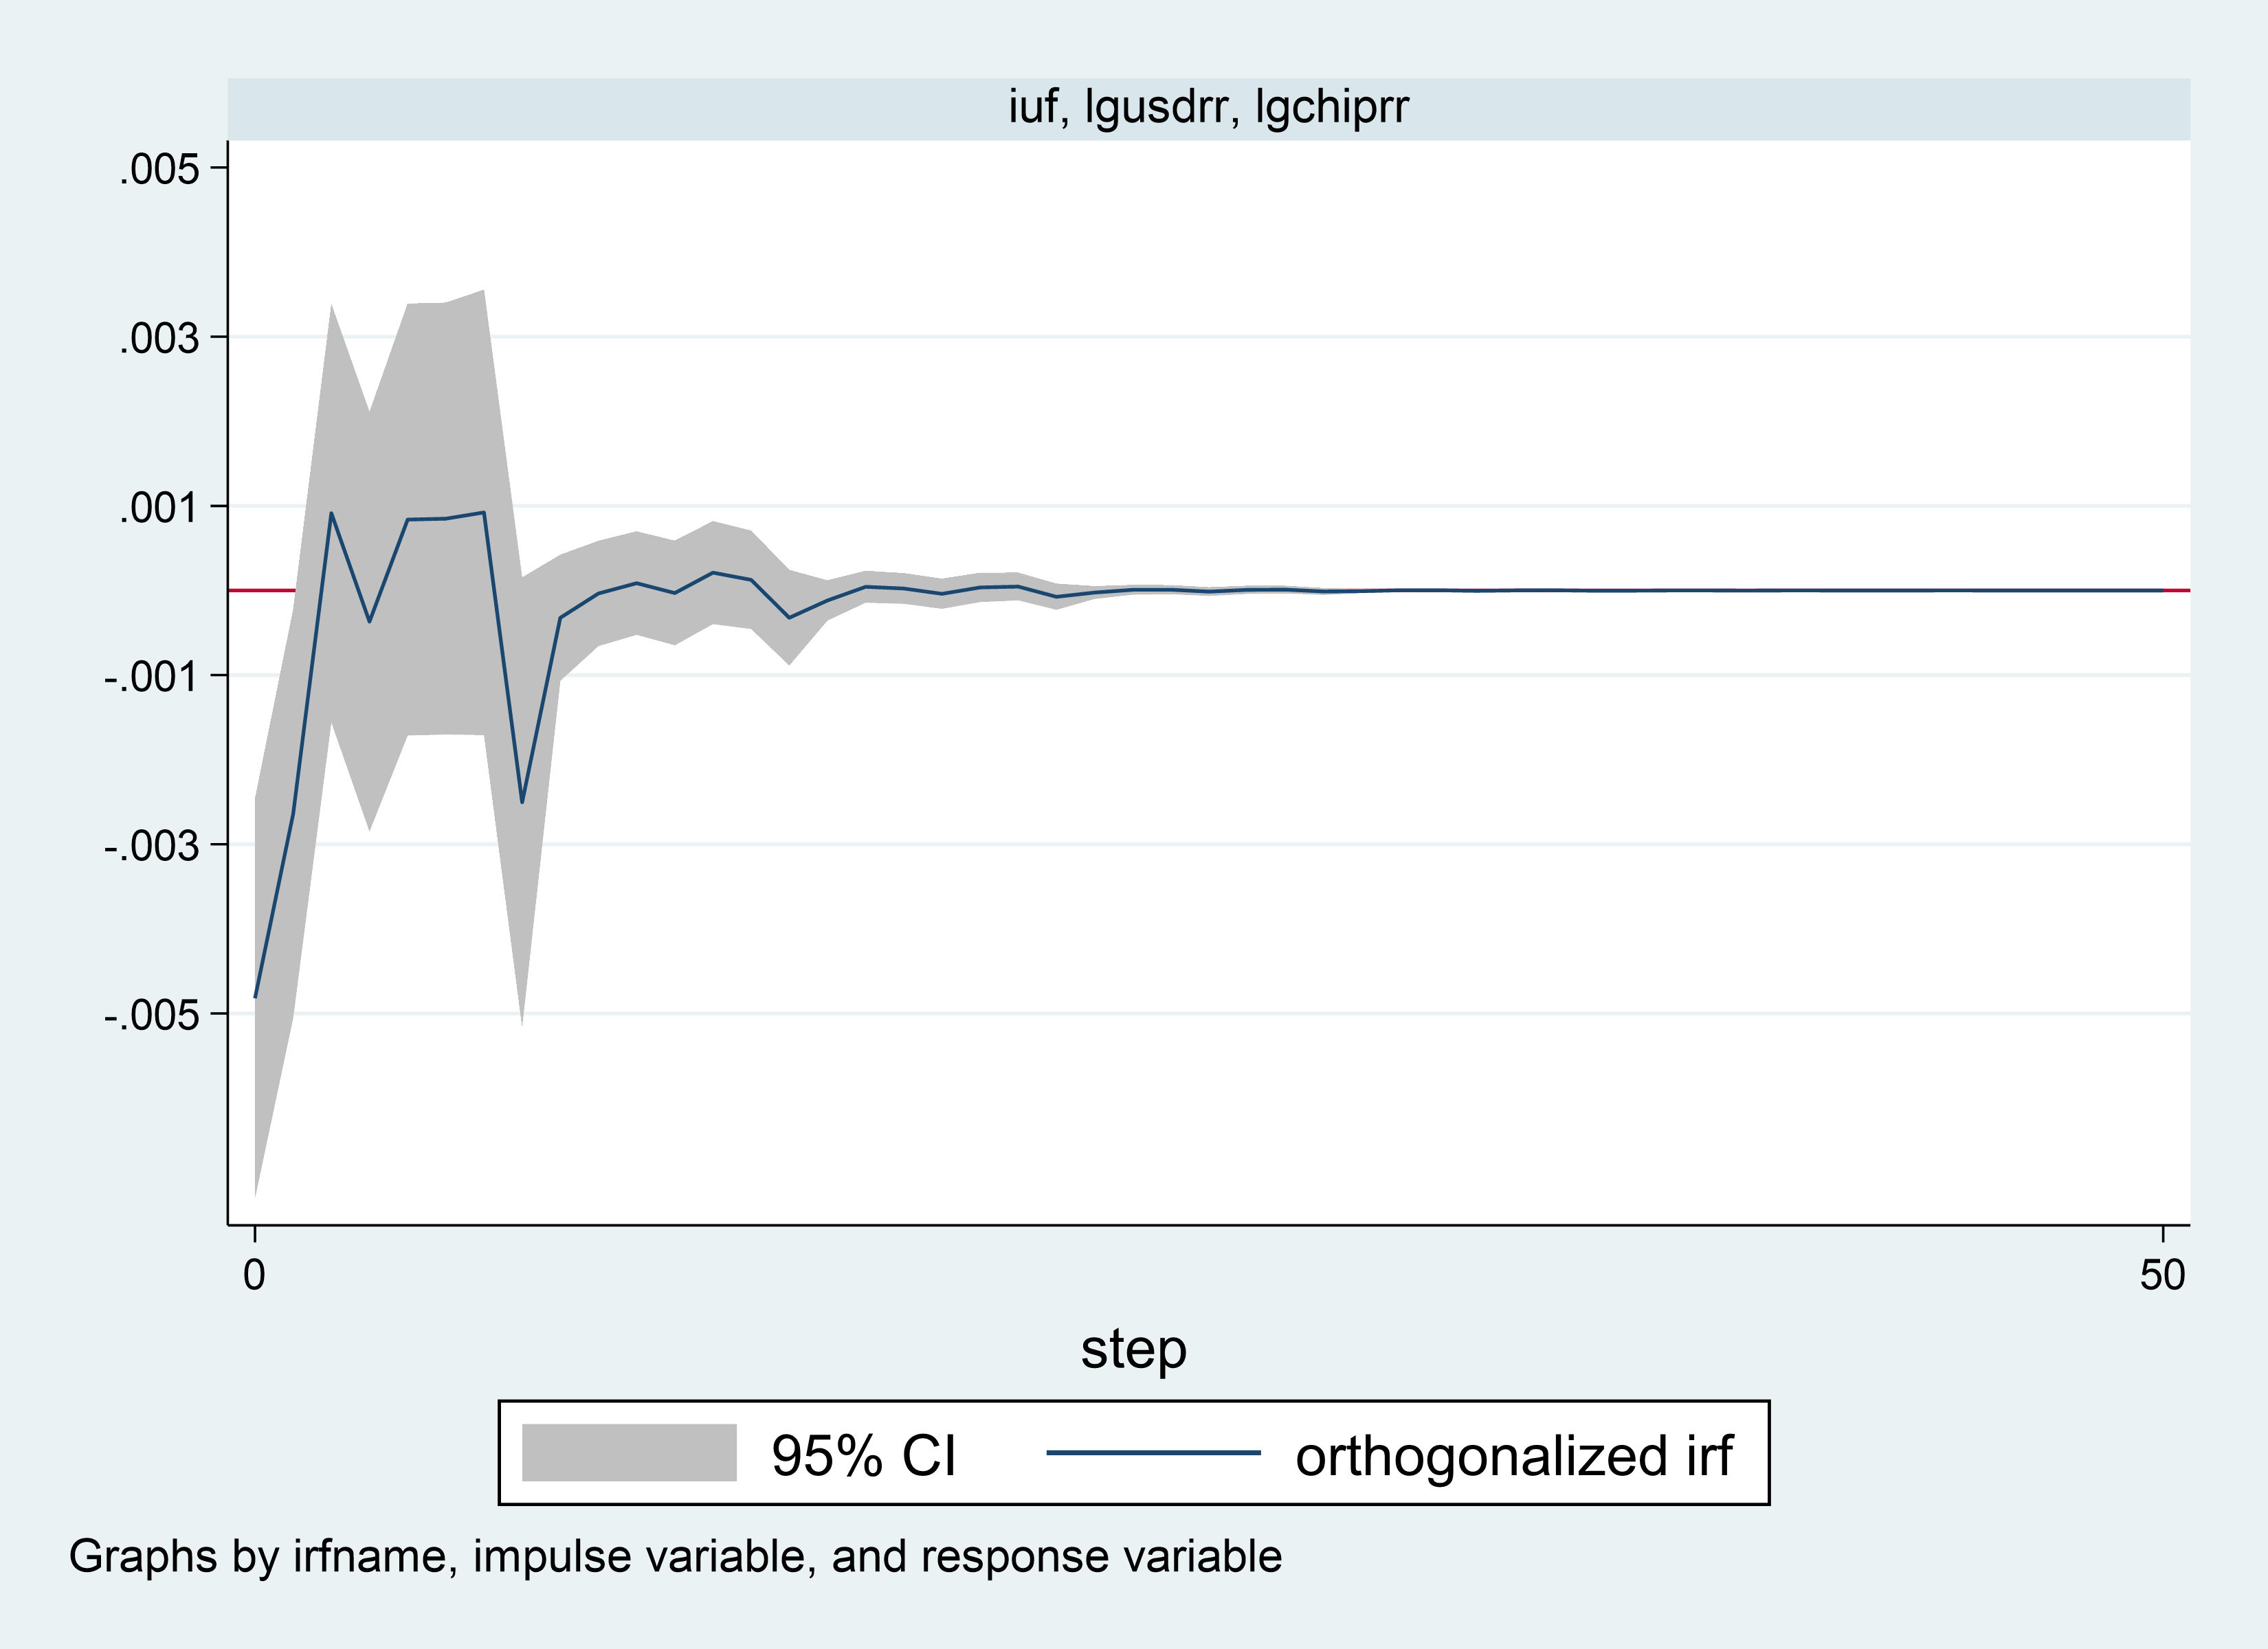
According to the estimated pulse response results (Figure 2), the impact of a one-unit exchange rate shock on the future semiconductor industry return in China is negative, the international capital flow dominates the effect, at time t=0. The maximum negative effect occurs at time t=0, and is approximately 0.5%. In the short term in the future, there is a period of time when the export effect is dominant, but in the longer term, the capital outflow still dominates. This paper argues that this result can explain the increase in the federal funds rate in the US in 2022 and the subsequent tightening of monetary policy.
|
Figure 2: Impulse and response. (Photo credit: Original) |
3.3. ARMA Specification
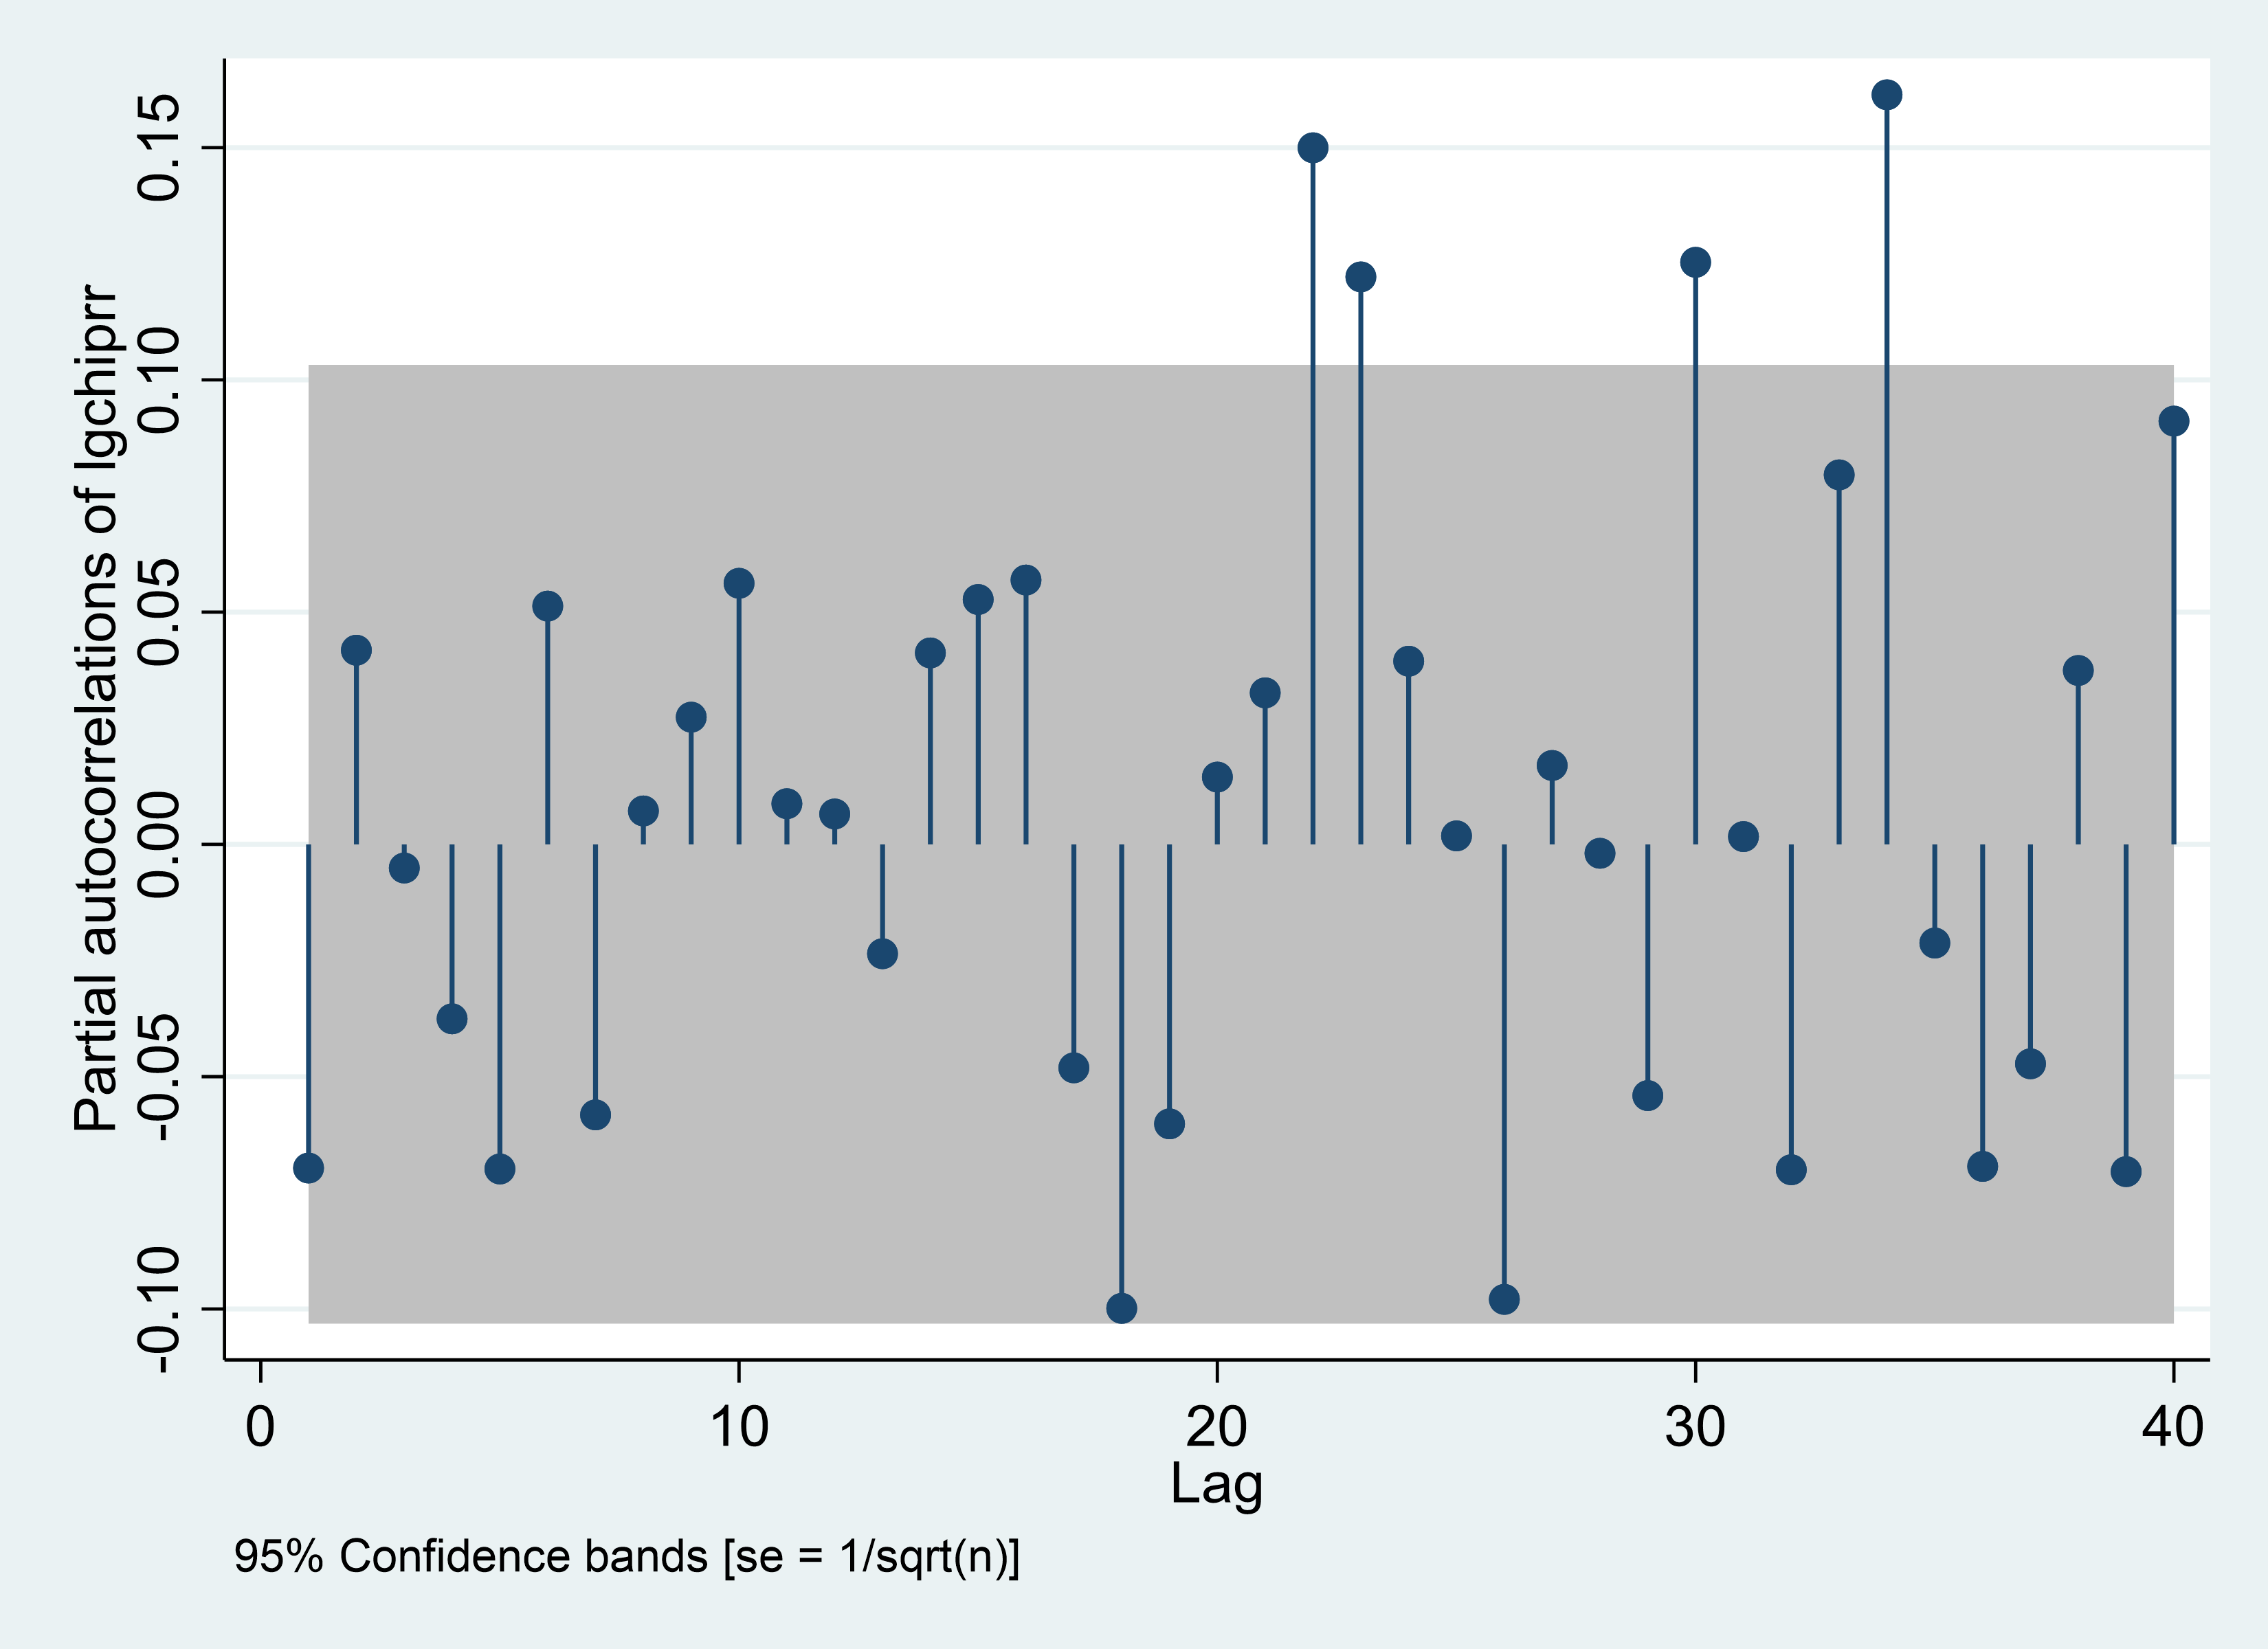
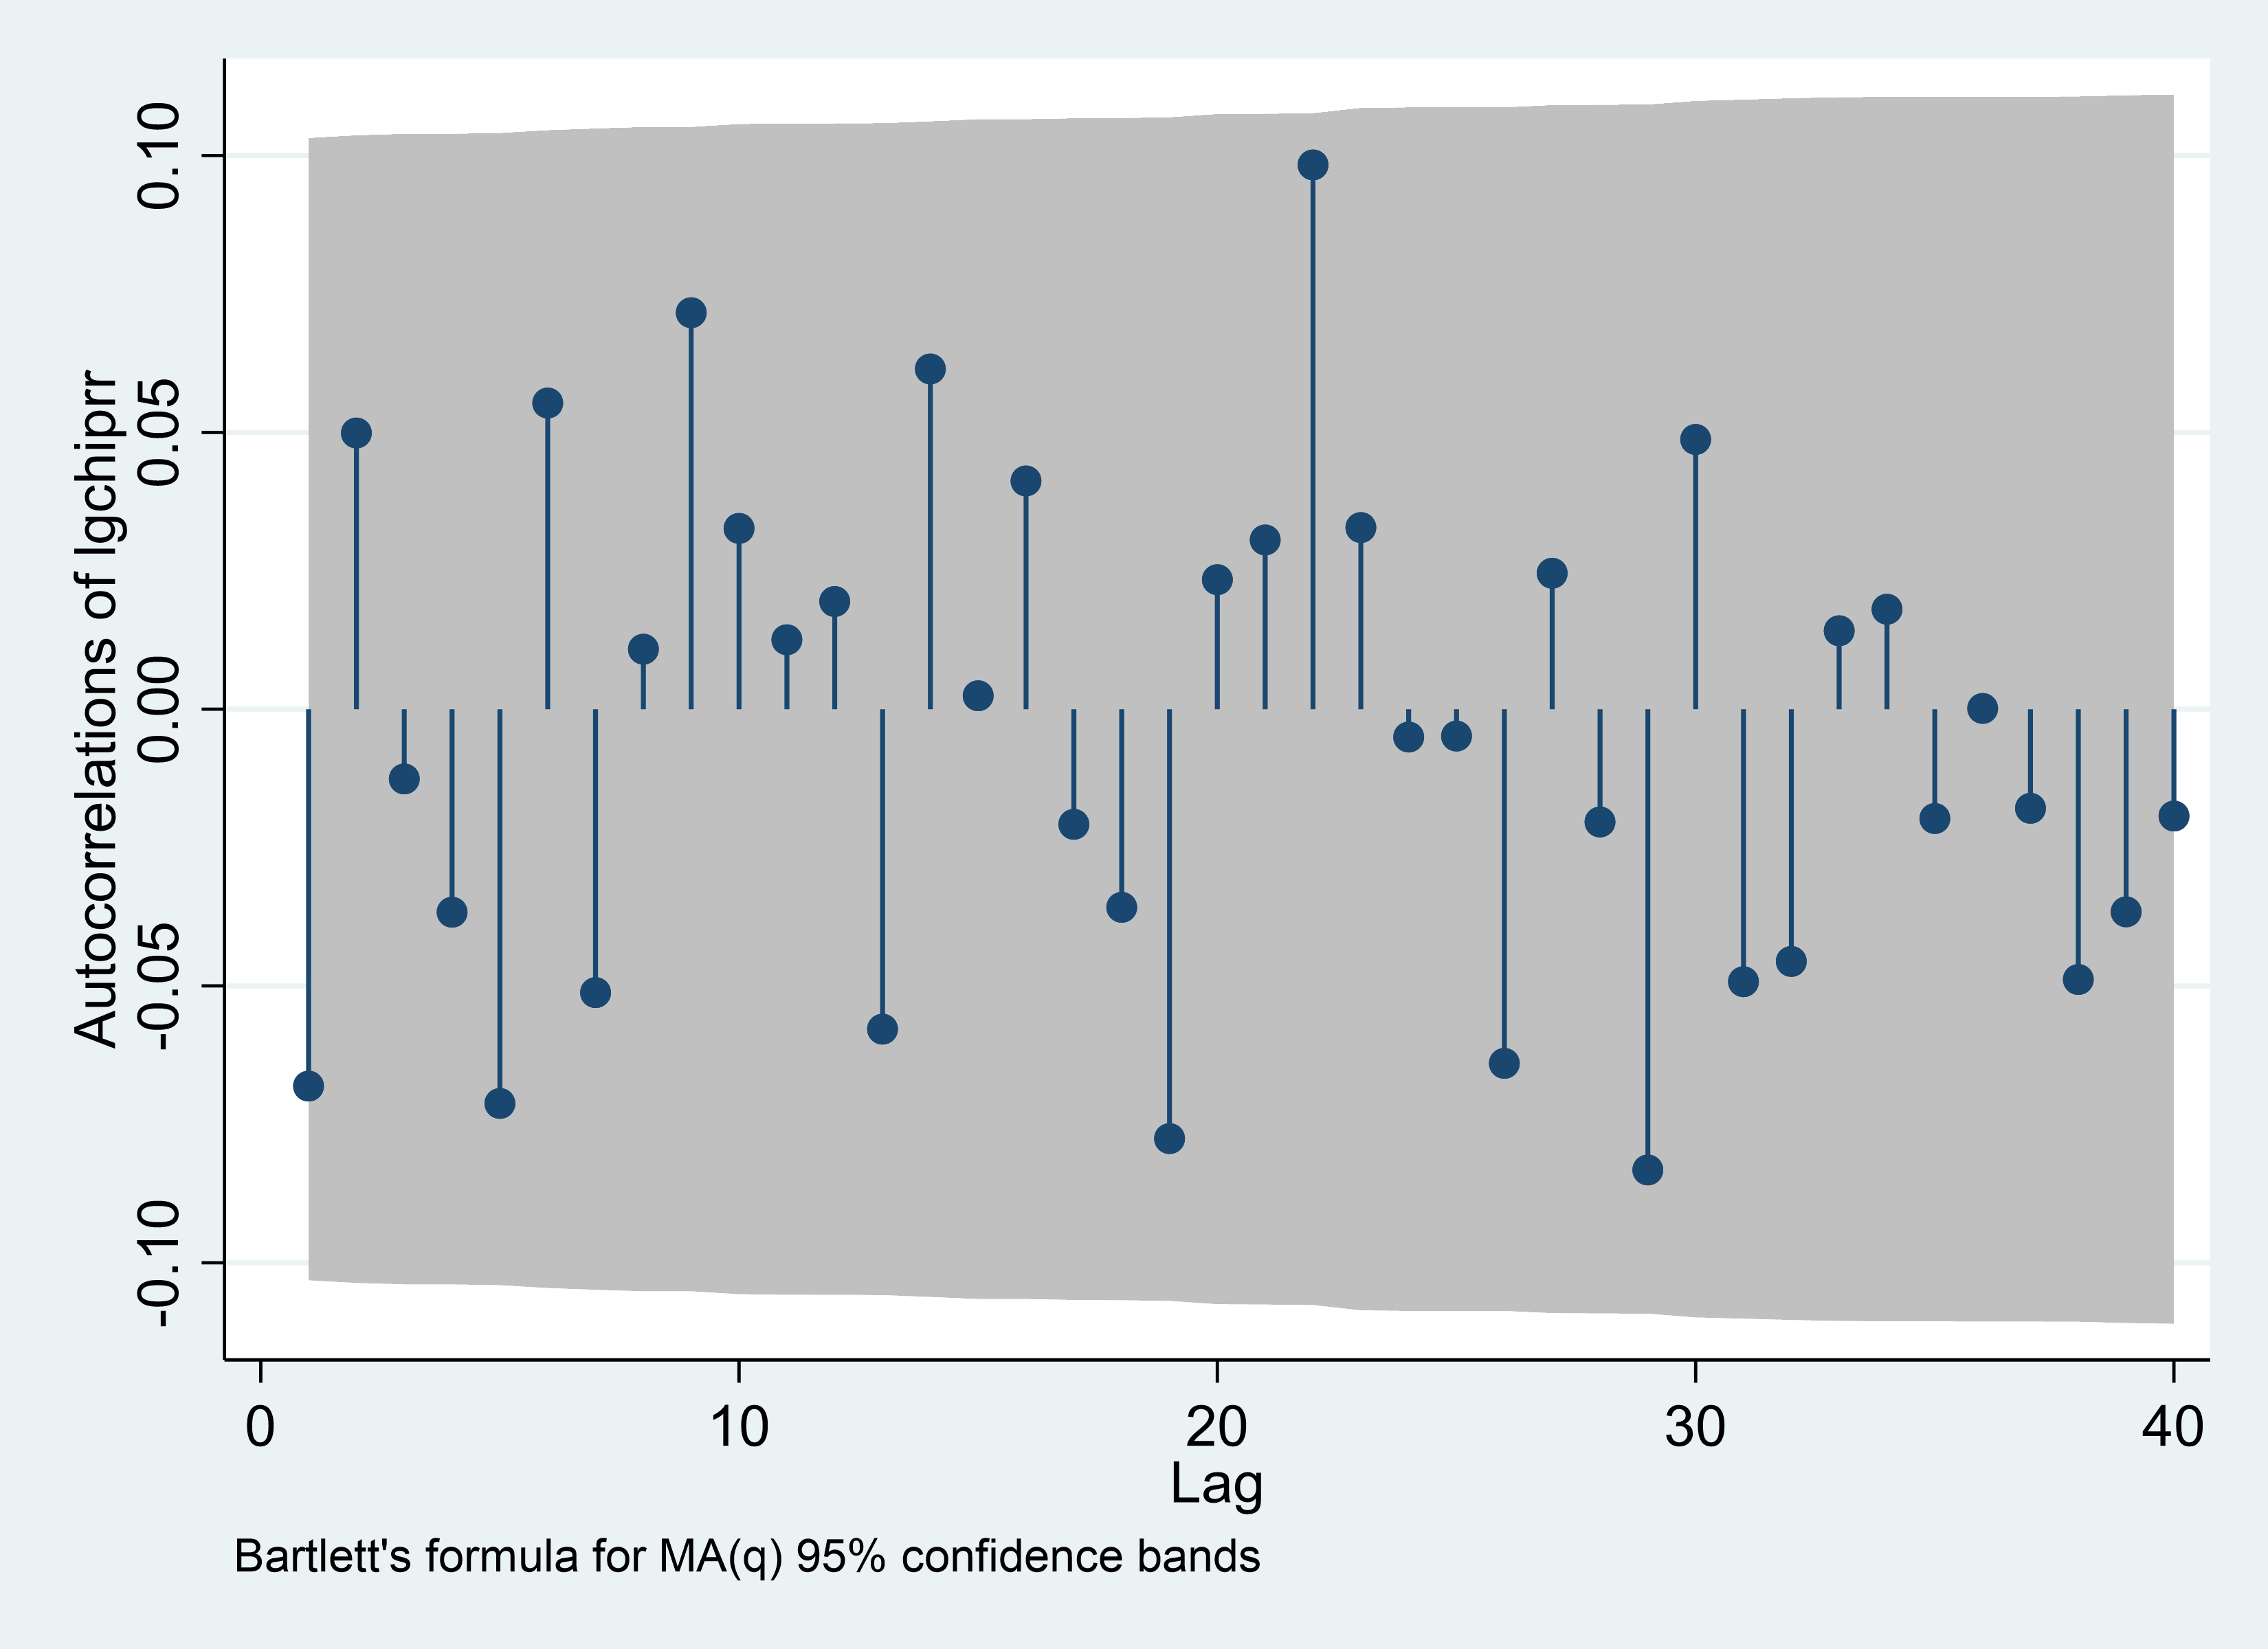
Regarding to the order of the stock return in logarithm, PACF and ACF can be helpful to derive the lag orders for AR(p) and MA(q). In the Figure 3, the first part beyond the critical value is 22 for PACF, which demonstrates that AR(p) has order 22 and value of p is equals to 22. This means that the current value of the time series is being predicted using the past 22 values of the time series. There is no lag beyond the critical value for ACF. It suggests that the lag order for the MA component of the time series is 0. This means that the current value of the time series is not being predicted using any lagged residuals.
PACF | ACF |
|
|
Figure 3: PACF and ACF. (Photo credit: Original) | |
3.4. ARMA-GARCH Estimation Results and Variance Equation
The results of Table 3 from the three column estimates show that, after controlling for the autocorrelation of chip index return in the mean equation, the GARCH term in the variance equation is significantly above the 1% level. This result indicates that there is a significant heteroskedasticity effect in chip industry returns, which can be modeled using GARCH. When examining the estimated coefficient of exchange rate log returns on chip industry returns, the exchange rate changes have a significant impact on the volatility of chip industry returns, but this impact is lagged. Specifically, a one-unit change in exchange rate log returns in period t=-2 leads to a 32.7963 unit increase in chip volatility.
Table 3: ARMA-GARCH estimation results.
(1) | (2) | (3) | ||||
Coefficient | p>|Z| | Coefficient | p>|Z| | Coefficient | p>|Z| | |
Mean equation | ||||||
AR, L22 | .0881 | 0.1370 | .1006 | 0.0980 | .1238 | 0.0370 |
Constant | -.0007 | 0.5280 | -.0008 | 0.5220 | -.0008 | 0.5470 |
Variance equation | ||||||
Exchange rate | ||||||
T=0 | 491.6562 | 0.5360 | 12.5134 | 0.1600 | 7.1409 | 0.4690 |
T=-1 | -4.9392 | 0.6460 | 1.6450 | -26.1712 | ||
T=-2 | 32.7963 | 0.0012 | ||||
GARCH (1, 1) | ||||||
ARCH, L1 | .0186 | 0.1480 | -.0323 | 0.2150 | -.0428 | 0.2250 |
GARCH, L1 | .9724 | 0.0000 | -.7752 | 0.0000 | -.5633 | 0.0000 |
Constant | -14.3357 | 0.0330 | -7.0277 | 0.0000 | -7.1599 | 0.0000 |
4. Conclusion
The object of this research paper is not only about retrospect the development of Chinese Chip industry, but also making scientific prediction toward the future of Chinese Chip market. As the trade war between US and China escalated, the forecast and recommendation of this paper could be even more important toward the direction and development of Chinese chip industry. The article mainly used VAR and ARMA-GARCH model to analyze data from 2016 to present, which correlate the Chinese mainland stock market’s Chip index and the US exchange rate. From the VAR model we can conclude that the international capital would take advantage, which would have negative influence toward Chinese chip industry, but in the long term, China mainland capital would take the lead back. The result also proved that the Federal reserve raising interest rate would cause the chip industry with a decline in the short term. The ARMA-GARCH model result shows that Exchange rate changes have a significant impact on the volatility of chip industry earnings, but this impact is lagging.
Looking behind, the US government restriction deed had significant strike toward Chinese Chip industry, but this has also stimulated Chinese chip companies and the government to putting more effort in developing the chip industry with more welfare toward targeted talents in the industry, and policies were made to cut tax for chip companies. Looking forward, the Biden administration would keep the tension between US and China in chip industry intensive, but still, as the world become more connected and emerging cutting-edge technology would foster the two countries settle down behind the community interest. What this paper could serve is to give a prediction toward the industry based on the passing data, and it is always better to plan ahead.
References
[1]. General admission of customs P.R. CHINA (2022), Table of main imported commodity volume and value in December 2021 (in US dollars)http://www.customs.gov.cn//customs/302249/zfxxgk/2799825/302274/302277/302276/4127373/index.html
[2]. IC Insights. (2021). Chinese Companies Hold Only 5% of Global IC Marketshare. https://www.design-reuse.com/news/49792/2020-worldwide-ic-marketshare.html
[3]. Choice Finance. Retrieved January 4, 2023, from https://www.eastmoney.com/
[4]. Stephanie. (2021). Unit root: Simple definition, unit root tests. Statistics How To. Retrieved January 4, 2023, from https://www.statisticshowto.com/unit-root/
[5]. Vector autoregressive models: Specification. Retrieved January 4, 2023, from https://onlinelibrary.wiley.com/doi/abs/10.1111/b.9780631215585.1999.00003.x
[6]. Ren, S. et al. (2022) ‘Polarization Domain Spectrum Sensing Algorithm Based on AlexNet’, Sensors (14248220), 22(22), p. 8946. doi:10.3390/s22228946.
[7]. Anderson, S. F. (2020). Misinterpreting p: The discrepancy between p values and the probability the nullhypothesis is true, the influence of multiple testing, and implications for the replication crisis. Psychological Methods, 25(5), 596–609. https://doi-org.ez.xjtlu.edu.cn/10.1037/met0000248
[8]. Yang, H. et al. (2022) ‘The Dynamic Impacts of Weather Changes on Vegetable Price Fluctuations in Shandong Province, China: An Analysis Based on VAR and TVP-VAR Models’, Agronomy, 12(11), p. 2680. doi:10.3390/agronomy12112680.
[9]. Zhaoyi Zhou (2010) ‘Analysis of Advantages and Disadvantages of the Appreciation of Current Renminbi against US Dollar’, JOURNAL OF JIANGXI FINANCE COLLEGE, 23(4), pp. 42–44.
[10]. Avdjiev, S., Bruno, V., Koch, C., & Shin, H. S. (2019). The Dollar Exchange Rate as a Global Risk Factor: Evidence from Investment. IMF Economic Review, 67(1), 151–173. https://doi-org.ez.xjtlu.edu.cn/10.1057/s41308-019-00074-4
Cite this article
Jiang,Q.;Tan,Y.;Wang,Y. (2023). Trend of Chip Industry under the Negative Interest Rate Policy: Based on Time Series Model. Advances in Economics, Management and Political Sciences,19,40-47.
Data availability
The datasets used and/or analyzed during the current study will be available from the authors upon reasonable request.
Disclaimer/Publisher's Note
The statements, opinions and data contained in all publications are solely those of the individual author(s) and contributor(s) and not of EWA Publishing and/or the editor(s). EWA Publishing and/or the editor(s) disclaim responsibility for any injury to people or property resulting from any ideas, methods, instructions or products referred to in the content.
About volume
Volume title: Proceedings of the 2023 International Conference on Management Research and Economic Development
© 2024 by the author(s). Licensee EWA Publishing, Oxford, UK. This article is an open access article distributed under the terms and
conditions of the Creative Commons Attribution (CC BY) license. Authors who
publish this series agree to the following terms:
1. Authors retain copyright and grant the series right of first publication with the work simultaneously licensed under a Creative Commons
Attribution License that allows others to share the work with an acknowledgment of the work's authorship and initial publication in this
series.
2. Authors are able to enter into separate, additional contractual arrangements for the non-exclusive distribution of the series's published
version of the work (e.g., post it to an institutional repository or publish it in a book), with an acknowledgment of its initial
publication in this series.
3. Authors are permitted and encouraged to post their work online (e.g., in institutional repositories or on their website) prior to and
during the submission process, as it can lead to productive exchanges, as well as earlier and greater citation of published work (See
Open access policy for details).
References
[1]. General admission of customs P.R. CHINA (2022), Table of main imported commodity volume and value in December 2021 (in US dollars)http://www.customs.gov.cn//customs/302249/zfxxgk/2799825/302274/302277/302276/4127373/index.html
[2]. IC Insights. (2021). Chinese Companies Hold Only 5% of Global IC Marketshare. https://www.design-reuse.com/news/49792/2020-worldwide-ic-marketshare.html
[3]. Choice Finance. Retrieved January 4, 2023, from https://www.eastmoney.com/
[4]. Stephanie. (2021). Unit root: Simple definition, unit root tests. Statistics How To. Retrieved January 4, 2023, from https://www.statisticshowto.com/unit-root/
[5]. Vector autoregressive models: Specification. Retrieved January 4, 2023, from https://onlinelibrary.wiley.com/doi/abs/10.1111/b.9780631215585.1999.00003.x
[6]. Ren, S. et al. (2022) ‘Polarization Domain Spectrum Sensing Algorithm Based on AlexNet’, Sensors (14248220), 22(22), p. 8946. doi:10.3390/s22228946.
[7]. Anderson, S. F. (2020). Misinterpreting p: The discrepancy between p values and the probability the nullhypothesis is true, the influence of multiple testing, and implications for the replication crisis. Psychological Methods, 25(5), 596–609. https://doi-org.ez.xjtlu.edu.cn/10.1037/met0000248
[8]. Yang, H. et al. (2022) ‘The Dynamic Impacts of Weather Changes on Vegetable Price Fluctuations in Shandong Province, China: An Analysis Based on VAR and TVP-VAR Models’, Agronomy, 12(11), p. 2680. doi:10.3390/agronomy12112680.
[9]. Zhaoyi Zhou (2010) ‘Analysis of Advantages and Disadvantages of the Appreciation of Current Renminbi against US Dollar’, JOURNAL OF JIANGXI FINANCE COLLEGE, 23(4), pp. 42–44.
[10]. Avdjiev, S., Bruno, V., Koch, C., & Shin, H. S. (2019). The Dollar Exchange Rate as a Global Risk Factor: Evidence from Investment. IMF Economic Review, 67(1), 151–173. https://doi-org.ez.xjtlu.edu.cn/10.1057/s41308-019-00074-4