


1. Introduction
The analysis of the correlation between Chinese and American stocks has always been a hot topic in financial studies. It represents the phenomenon in which the prices of various financial assets, represented by stocks, move in the same direction. As the first securities exchange in China, the establishment of the Shanghai Stock Exchange in 1990 marked the beginning of the modernization of the Chinese capital market. Thanks to the improvement of China's economic system and the opening-up of its capital market, the connection between the A-share market and overseas markets has become increasingly close. Since China's accession to the WTO in 2000, it has participated deeply in the formation of the global industrial chain and has joined the tide of economic globalization. International capital has participated in China's capital market. Due to the growth of China's capital market and the fact that it now has the second-largest economy in the world, the Chinese stock market has integrated into the global capital market. With the continuous trade frictions between China and the United States, the relationship between the stock markets of the two countries has become more and more important. Since 2020, the COVID-19 pandemic has swept the world, and the United States has frequently released various monetary policies and fiscal policies to regulate its domestic inflation and to expect the global flow of the US dollar. This has caused turbulence in the US stock market, with four circuit breakers triggered in nine trading days in March 2020. Subsequently, as a means of stimulating the stock market, the Fed cut interest rates to zero and promoted $5 trillion in quantitative easing, and the US stock market rebounded by 20% in April of that year [1]. Now, the US stock market has returned to normal trend, and the Fed has started to raise interest rates, with foreseeable future plans to continue pushing for rate hikes. Against the backdrop of economic globalization, the Fed's policies have brought more uncertainty to China's A-share market. Thus, researching how the US stock market affects the Chinese stock market has certain practical significance and provides theoretical support for further exploration of related issues. For example, can the US stock market, which is directly affected by Fed policy, serve as a barometer for the trend of Chinese stocks? Could the US stock market's turbulence create opportunities for arbitrage in the Chinese stock market? Does it have reference value for China to introduce policies targeting the stock market, etc.
Foreign academia has a profound understanding of the linkage effect between related events and the stock market. Adler found that similar economic fundamentals would lead to the correlation between stock markets [2]. Becker et al. found in their research that foreign traders participating in the UK stock market would respond to information from the US stock market, leading to a convergence of the UK stock market's response to the US stock market [3]. Dooley showed in his research that the Chinese stock market was not affected by the US initially during the subprime crisis, and the correlation appeared only after a period of time [4]. Tamakoshi found in his study of the European debt crisis that the linkage between the stock markets of various European countries decreased after Greece's debt default [5]. Yang showed in his article on the stock market and economic policies that a country's stock market would also respond to another country's economic policies, and the Chinese and American stock markets are somewhat interconnected [6]. At the same time, recent research has also explored the stock market's erratic behavior against a backdrop of the epidemic. Related scholars, such as Albulescu and Baig have proposed that COVID-19 has increased market liquidity and volatility, thereby increasing the correlation between different countries' capital markets [7, 8].
Chinese scholars have also explored the linkage between the stock markets of other nations and the Chinese stock market. Li et al. found some long-term equilibrium relationships by conducting Johansen cointegration tests on China's A-share market and other countries' stock markets [9]. Chen et al. analyzed the linkage of 12 stock markets including China, the US, Japan, and South Korea from 1991 to 2005 and believed that there was a certain relationship between the Chinese and US stock markets [10]. Dong Xiuliang studied the stock returns of multiple markets such as the Shanghai, Hong Kong, and the United States [11]. After applying the GARCH model, it was found that the volatility of the US stock market had a contagious effect on the Hong Kong stock market. Liu et al. used VAR model and cointegration analysis to explore the linkage between A-share and H-share [12]. Wu et al. examined the volatility patterns of the Chinese and US stock markets using GARCH models, and they discovered that the US stock market's tendency has a one-way Granger causal relationship with the Chinese stock market [13]. Shen et al. analyzed the volatility linkage between the two countries' stock markets based on ARMA-AVGARCH-X, ARMA-ARGAS, and DCC models [14]. They found that the volatility linkage between the stock markets of two countries significantly increased after the outbreak of COVID-19, and the three stage peaks were all related to the epidemic.
This paper selects two representative indexes, with a time span from the beginning of the COVID-19 epidemic to the present, namely January 2020 to November 2022. The VAR model will be used to conduct Granger causality tests, variance analysis, and other empirical methods on the selected data. Through analysis, it is possible to find the connection between the Chinese and American stock markets.
2. Methodology
The S&P 500 (P&S500) is an index compiled of representative stocks from 500 companies listed and traded on major exchanges such as NYSE and NASDAQ in New York. The CSI 300 (China Securities Index 300) is similar to the S&P 500 index, consisting of the most representative 300 active trading stocks in the Shanghai and Shenzhen markets. Both indices are calculated using the float-adjusted market capitalization-weighted index method. Due to their high market value, strong representativeness, and multi-market features, the academic community believes that both indices can well represent the overall trends of the Chinese and US stock markets. With increasing capital exchanges between China and the US, the CSI 300's trend is to some extent affected by the S&P 500 index's trend. As shown in Figure 1, the correlation between the two is evident. After processing non-trading day data, out of 1,046 samples, there were 567 days when both Chinese and US stocks rose or fell together. Therefore, the hypothesis of this paper is that the S&P 500 will have a correlation impact on the trend of the CSI 300, and the S&P 500's returns will have a positive impact on the returns of the CSI 300. This paper will construct a mathematical model investigate the impact response between these two indices.
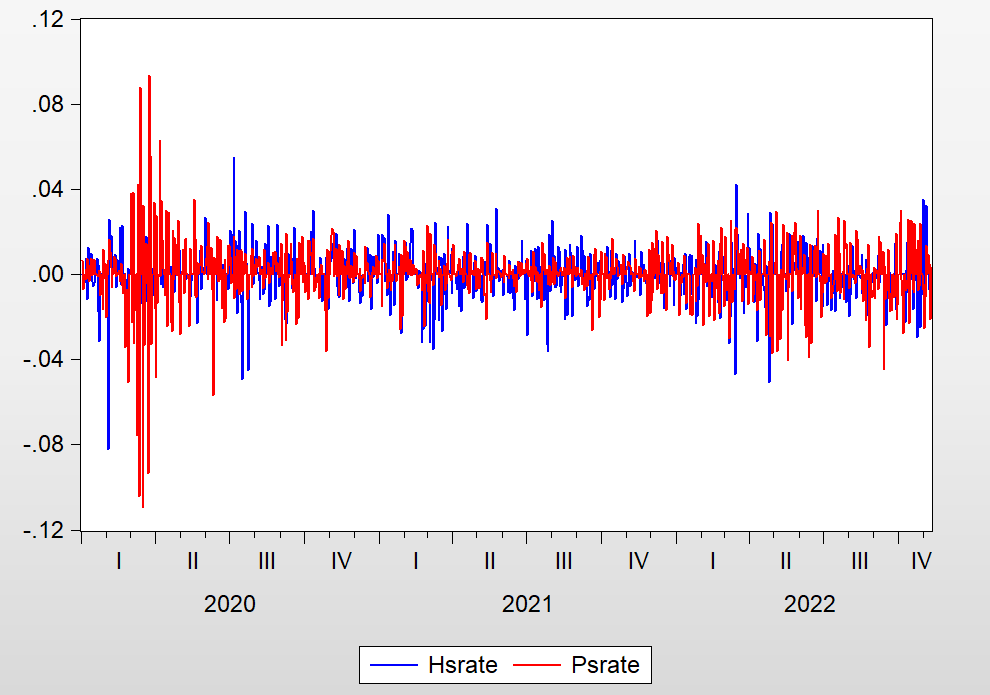
Figure 1: Correlation between CSI 300 and S&P 500.
2.1. VAR Model
The Vector Autoregression (VAR) model is commonly used in academia to determine the dynamic relationship between jointly endogenous variables, as follows.
\( {y_{t}}={φ_{1}}{y_{t-1}}+{φ_{2}}{y_{t-2}}+L+{φ_{p}}{y_{t-p}}+H{x_{t}}+{ε_{t}} ,t=1,2…T \) (1)
Where \( {y_{t}} \) is a column vector of endogenous variables, \( {x_{t}} \) is a column vector of exogenous variables, p is the number of lags, T is the number of observations. L, \( φ \) i are matrices to be estimated, H is a matrix of coefficients to be estimated, \( {ε_{t}} \) is the disturbance vector, which is contemporaneously uncorrelated with the other variables.
\( MSE[\hat{E}({Psrate_{t+s}}|{Psrate_{t}},{Psrate_{t-1}},…)]=MSE[\hat{E}{(Psrate_{t+s}}|{Psrate_{t}},{Psrate_{t-1}},…,{Hsrate_{t}},{Hsrate_{t-1}},…)] \) (2)
\( (\frac{{Hsrate_{t}}}{{Psrate_{t}}}) \) = \( (\begin{matrix}{φ_{10}} \\ {φ_{20}} \\ \end{matrix}) \) + \( (\begin{matrix}φ_{11}^{(1)} & φ_{12}^{(1)} \\ φ_{21}^{(1)} & φ_{22}^{(1)} \\ \end{matrix})(\frac{{Hsrate_{t-1}}}{{Psrate_{t-1}}}) \) +…+( \( \begin{matrix}φ_{11}^{(p)} & φ_{12}^{(p)} \\ φ_{21}^{(p)} & φ_{22}^{(p)} \\ \end{matrix}) (\frac{{Hsrate_{t-p}}}{{Psrate_{t-p}}}) \) + \( (\frac{{ε_{1t}}}{{ε_{2t}}}) \) (3)
When and only when all the coefficients \( φ_{12}^{(t)}(t=1,2,…,p) \) in the coefficient matrix are zero, it can be considered that there is no Granger causality between Hsrate and Psrate, that is, Psrate is an exogenous variable for Hsrate. In this case, the F-test can be used to directly determine the Granger causality.
2.2. GARCH-BEKK Model
The BEKK-GARCH model, as a univariate model in the multivariate GARCH family, is commonly used to study the volatility correlation of returns in multiple markets. It can impose constraint conditions to ensure the positive definiteness of the variance-covariance matrix, while avoiding the problem of too many parameters to be estimated in the GARCH model to some extent. In this paper, a bivariate BEKK-GARCH(1,1) model is employed to investigate the impacts of spillover between the CSI 300 and S&P 500 indices.
\( {H_{t}}=C{C^{ \prime }}+A{ε_{t}}ε_{t}^{ \prime }{A^{ \prime }}+B{H_{t-1}}{B^{ \prime }},t=1,2,…T \) (4)
Where \( {H_{t}}=(\begin{matrix}{h_{11,t}} & {h_{12,t}} \\ {h_{21,t}} & {h_{22,t}} \\ \end{matrix}), {C_{t}}=(\begin{matrix}{c_{11}} & 0 \\ {c_{21}} & {c_{22}} \\ \end{matrix}), {ε_{t}}=(\begin{matrix}{ε_{1t}} \\ {ε_{2t}} \\ \end{matrix}),A=(\begin{matrix}{a_{11}} & {a_{12}} \\ {a_{21}} & {a_{22}} \\ \end{matrix}),B=(\begin{matrix}{b_{11}} & {b_{12}} \\ {b_{21}} & {b_{22}} \\ \end{matrix}) \) .
In this paper, 1 represents the CSI 300 Index, and 2 represents the S&P 500 Index. Ht is the conditional variance-covariance matrix of the two time series. The matrices A and B contain the impact of lagged residuals and lagged conditional variances on the current volatility of each series (represented by \( {a_{11}},{a_{22}},{b_{11}},{b_{22}} \) ), while the remaining elements ( \( {a_{12}} \) , \( {a_{21}} \) , \( {b_{12}} \) , \( {b_{21}} \) ) represent the ARCH and GARCH spillover effects between the two indices.
3. Empirical Study
3.1. Sample Selection and Preprocessing
COVID-19 has been rampant around the world since early 2020, and after experiencing multiple circuit breakers and large fluctuations, the US government has implemented multiple policies in an attempt to stabilize the stock market. Therefore, this study selects daily changes in the two indices from January 1, 2020 to November 10, 2022. Non-trading days are filled with data from the previous trading day for further analysis. Logarithmic transformation is applied to the returns to eliminate heteroscedasticity, as follows.
\( {Psrate_{t}}=ln{(\frac{{Pclose_{t}}}{{Pclose_{t-1}}})} \) (5)
\( {Hsrate_{t}}=ln{(\frac{{Hclose_{t}}}{{Hclose_{t-1}}})} \) (6)
The final data has the format shown in Table 1.
Table 1: Daily percentage change of Hsrate and Psrate.
date | Pclose | Hclose | Psrate | Hsrate |
2020/1/5 | 3235.5 | 4144.964 | ||
2020/1/6 | 3243.5 | 4129.295 | 0.00247 | -0.00379 |
2020/1/7 | 3235.25 | 4160.227 | -0.00255 | 0.007463 |
2020/1/8 | 3260.25 | 4112.317 | 0.007698 | -0.01158 |
2020/1/9 | 3276 | 4164.369 | 0.004819 | 0.012578 |
Descriptive statistics are presented in Table 2. It can be seen that the average daily rate of change for the S&P 500 index is 0.044% since the outbreak of the COVID-19 pandemic, while the average daily rate of change for the CSI 300 index is -0.02%. However, as shown in the line chart above, there is a certain relationship between the trends of the two indices.
Table 2: Descriptive statistics of daily percentage change of of Hsrate and Psrate.
Stats | Hsrate | Psrate |
Mean | -0.000114 | 0.000146 |
Min | -0.082088 | -0.109552 |
Max | 0.055131 | 0.093446 |
Standard variance | 0.010727 | 0.013304 |
Skewness | -0.712912 | -1.049199 |
Kurtosis | 9.447463 | 19.32475 |
3.2. Simple Linear Regression
The simple linear regression can be used to determine the impact of Psrate on Hsrate. The specific results are shown in Table 3.
Table 3: Regression analysis of hsrate and psrate.
Variables | coefficient | P-Value |
Psrate | 0.1428 | 0.0000 |
Constant | -0.0001 | 0.5623 |
From the above regression results, it can be seen that the coefficient value is a positive number greater than 0, indicating that the impact of the S&P 500 index on the CSI 300 index is positively correlated, and it is significant at the 1% level of significance.
3.3. Stationary Test
The fluctuations of the S&P 500 index can cause the CSI 300 index to fluctuate. In this paper, Hsrate represents the fluctuation of the CSI 300 index, and Psrate represents the fluctuation of the S&P 500 index, and modeling analysis is conducted. When modeling a time series, the first thing to consider is the stationarity of its sequence. Considering that a large part of the time series is non-stationary, it is affected by the accumulation of variable trends. If the non-stationary sequence is directly used for regression analysis, there is a risk of producing the illusion that the regression model performs well due to "spurious regression". If the variable sequence is stationary, modeling analysis can be directly carried out; if the sequence is non-stationary, differencing processing, cointegration test, error correction model, etc. are required to further judge whether it has a long-term equilibrium relationship. In this paper, the ADF unit root test is used to test the stationarity of {Hsrate} and {Psrate}. The CSI 300 index and the S&P 500 index both cleared the test, as shown in Table 4, that is, they are stationary at the 1% critical level. Therefore, the Johansen cointegration test for handling non-stationary sequences is omitted.
Table 4: ADF test.
Variables | ADF statistic | 1% Threshold (Critical Value) | P-Value | Outcome |
Hsrate | -33.00998 | -3.343401 | 0.0000 | stationary |
Psrate | -9.267521 | -3.436462 | 0.0000 | stationary |
3.4. Determination of Lag Order
The lag order can affect the autocorrelation of the error terms and thus the VAR model. Therefore, it is necessary to find the optimal degree of fit and degree of freedom. In this paper, the commonly used method of information criterion such as AIC and SC are used to determine the lag order suitable for the model. As shown in the results in Table 5, according to the principle of majority, the lag orders selected by AIC and SC are consistent, both of which are 2.
Table 5: Determination of lag order.
Lag | LogL | LR | AIC | SC | HQ |
0 | 6254.69 | -12.07 | -12.06 | -12.07 | |
1 | 6282.20 | 54.87 | -12.11 | -12.06 | -12.10 |
2 | 6282.58 | 0.74 | -12.12* | -12.09* | -12.11* |
3 | 6284.81 | 4.44 | -12.11 | -12.04 | -12.08 |
4 | 6289.03 | 8.36 | -12.11 | -12.02 | -12.06 |
3.5. The Solution of VAR Model
The following VAR(2) model was established by fitting the relevant data.
\( {Psrate_{t}}=-0.1533*{Psrate_{t-1}}+0.0181*{Psrate_{t-2}}+(-0.0181)*{Hsrate_{t-1}}+(-0.0257)*{Hsrate_{t-2}}+{ε_{1t}} \) (7)
\( Hsrate=-0.1065*{Hsrate_{t-1}}+0.0059*{Hsrate_{t-2}}+0.0463* \) \( {Psrate_{t-1}}+(-0.0005)*{Psrate_{t-2}}+{ε_{2t}} \) (8)
Both AIC and SC values are relatively small, indicating a good fitting effect of the equation. At the same time, from the equation, a certain extent the relationship can be seen between the two variables, both of which are influenced by their own lagged values and the values of the other variable. It is also evident that both variables are mainly affected by the negative lagged values of their own variables, with coefficients of -0.1533 and -0.1065, respectively.
3.6. Granger Causality Test
The S&P 500 index and the CSI 300 index were compared to determine whether there is a direct connection, the Granger causality test was performed on the two sequences Hsrate and Psrate. The results are shown in Table 6. The first null hypothesis that "Psrate does not Granger-cause Hsrate" is rejected, while the second null hypothesis that "Hsrate does not Granger-cause Psrate" is not rejected. This means that the change in the S&P 500 index is the cause of the change in the CSI 300 index, and the S&P 500 index can provide useful information for predicting the CSI 300 index.
Table 6: Outcome of Granger causality test.
Null Hypothesis | LR statistic | P-value | Null Hypothesis | Granger causality |
Psrate does not Granger-cause Hsrate | 17.8498 | 0.0001 | Reject | Yes |
Hsrate does not Granger-cause Psrate | 0.6283 | 0.7303 | Not Rejected | No |
3.7. Impulse Response Analysis
To estimate the dynamic response of the system to a random shock in one of the endogenous variables, an impulse response function is constructed using Cholesky decomposition on the VAR model. Before doing the impulse response analysis, the model's stability is evaluated to prevent false regression results. Any VAR model is stable if all of the roots are found inside the unit circle; otherwise, the model is unstable if some roots are found outside the unit circle. Therefore, to establish a stable VAR model, a stationarity test is conducted as shown in Figure 2. It can be seen that every root is situated inside the unit circle, proving the stability of the VAR model.
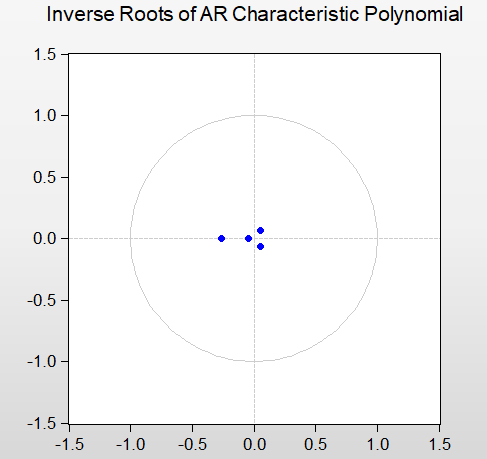
Figure 2: AR characteristic roots unit circle.
As shown in Figure 3, further impulse response function analysis was conducted. From the response of Hsrate to Psrate, a positive shock of one standard deviation to Psrate caused a positive response in Hsrate, reaching a maximum value of 0.002 in the first period, and then the effect weakened, gradually attenuating to 0. From the response of Psrate to Hsrate, a positive shock of one standard deviation to Hsrate caused a very small response in Psrate, basically close to 0. Based on this, it can be inferred that both indices are mainly influenced by their previous values; the rise in the S&P 500 index to some extent leads to the rise of the CSI 300 index, and when the US stock market experiences fluctuations represented by the component stocks of the S&P 500 index, It will exert pressure on the stocks that make up the CSI 300 index, which represent the Chinese stock market, impacting the direction of the Chinese stock market. The Chinese stock market has relatively little impact on the US stock market.
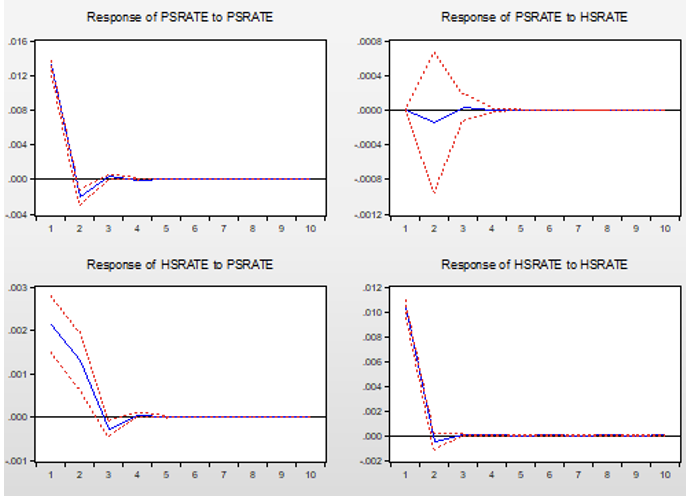
Figure 3: Impulse response function.
3.8. Variance Decomposition
The variance decomposition essentially decomposes the variance of a variable in a VAR system into various disturbance terms, and then judges the degree to which each disturbance factor affects the variables in the VAR model, which can be used to evaluate the dynamic correlation among the variables in the VAR system. From Figure 4, it can be seen that the fluctuation of the CSI 300 index is mainly influenced by its own lag effect, indicating that it has strong inertia and the decay is relatively slow. The S&P 500 index's variance increases from the first period to 5.48% and remains at this level, completely demonstrating that the S&P 500 index's movement has an impact on the CSI 300 index and that this impact will eventually reach a limit. It is also clear that the S&P 500 index has a significantly bigger impact on the CSI 300 index than the CSI 300 index has on the S&P 500 index.
The Chinese stock market, represented by the CSI 300 index, is primarily influenced by itself, with only a minor impact from the S&P 500 index, as shown in Figure 4. The influence of the US stock market on the Chinese stock market is significantly greater than the influence of the Chinese stock market on the US stock market. This is consistent with the results of the Granger causality test mentioned earlier.
Table 7: Variance decomposition.
Variance Decomposition of PSRATE | |||
Variance Period | Standard error | PSRATE | HSRATE |
1 | 0.013167 | 100.0000 | 0.000000 |
2 | 0.013328 | 99.97977 | 0.020225 |
3 | 0.013338 | 99.95001 | 0.049992 |
4 | 0.013339 | 99.94897 | 0.051028 |
5 | 0.013339 | 99.94889 | 0.051107 |
6 | 0.013339 | 99.94889 | 0.051113 |
7 | 0.013339 | 99.94889 | 0.051113 |
8 | 0.013339 | 99.94889 | 0.051113 |
9 | 0.013339 | 99.94889 | 0.051113 |
10 | 0.013339 | 99.94889 | 0.051113 |
Variance Decomposition of HSRATE | |||
Variance Period | Standard error | PSRATE | HSRATE |
1 | 0.010664 | 4.018175 | 95.98182 |
2 | 0.010754 | 5.420935 | 94.57906 |
3 | 0.010757 | 5.481742 | 94.51826 |
4 | 0.010758 | 5.485924 | 94.51408 |
5 | 0.010758 | 5.486246 | 94.51375 |
6 | 0.010758 | 5.486268 | 94.51373 |
7 | 0.010758 | 5.486269 | 94.51373 |
8 | 0.010758 | 5.486269 | 94.51373 |
9 | 0.010758 | 5.486269 | 94.51373 |
10 | 0.010758 | 5.486269 | 94.51373 |
3.9. Volatility Spillover Effect
Table 7 below lists the estimated parameters for the GARCH-BEKK model between the CSI 300 index and the S&P 500 index.
Table 8: Estimated outcome for GARCH-BEKK model.
Coefficient | Estimator | T-value | P-value |
\( {c_{11}} \) | 0.0506 | 3.3670 | 0.0008*** |
\( {c_{21}} \) | -0.0179 | -3.6130 | 0.0003*** |
\( {c_{22}} \) | 0.0140 | 1.5739 | 0.1155 |
\( {a_{11}} \) | -2.9642 | -4.2753 | 0.0000*** |
\( {a_{12}} \) | -1.2374 | -2.8216 | 0.0048*** |
\( {a_{21}} \) | 1.1078 | 4.1512 | 0.0000*** |
\( {a_{22}} \) | 6.7397 | 3.7493 | 0.0001*** |
\( {b_{11}} \) | 0.9632 | 87.1650 | 0.0000*** |
\( {b_{12}} \) | 0.0165 | 2.6197 | 0.0088*** |
\( {b_{21}} \) | -0.0030 | -0.5827 | 0.5601 |
Table 8 displays the results of the Wald test for correlations between the CSI 300 index and the S&P 500 index.
Table 9: Wald test.
Null hypothesis | F-Value | P-Value |
There is no volatility spillover effect from the CSI 300 to the S&P 500 ( \( {a_{12}} \) , \( {b_{12}} \) =0). | 8.9720 | 0.0001 |
There is no volatility spillover effect from the S&P 500 to the CSI 300 ( \( {a_{21}} \) , \( {b_{21}} \) =0). | 3.4314 | 0.0323 |
There is no spillover effect of volatility between S&P 500 and CSI 300 ( \( {a_{21}} \) , \( {b_{21}}, {a_{12}} \) , \( {b_{12}} \) =0). | 7.41078 | 0.0000 |
The majority of the elements in the ARCH effect matrix A and GARCH effect matrix B are significant at the 1% level, indicating that the model has a relatively good fit. The estimated values of \( {a_{11}} \) , \( {a_{22}} \) , \( {b_{11}} \) , \( {b_{22}} \) represent the degree to which the returns of the CSI 300 and S&P 500 are affected by their new and historical information, where \( {a_{11}} \) , \( {a_{22}} \) represent the self-ARCH effects and \( {b_{11}} \) , \( {b_{22}} \) represent the self-GARCH effects. From Table 8, it can be seen that both the CSI 300 and S&P 500 have significant ARCH and GARCH effects, indicating that the volatility of both is influenced by their new and historical information. In addition, by comparing the coefficients, it can be inferred that historical information has a greater impact on the volatility of both than new information. This phenomenon is relatively less pronounced for the CSI 300, possibly due to its shorter existence and limited historical information, whereas the S&P 500 has been in existence for over a century and has sufficient historical information.
For the remaining elements in matrices A and B, \( {a_{12}} \) , \( {a_{21}} \) , \( {b_{12}} \) , \( {b_{21}} \) , where \( {a_{12}} \) , \( {a_{21}} \) represent the ARCH impact spillover effects between the S&P 500 volatility and the CSI 300 index volatility, and \( {b_{12}} \) , \( {b_{21}} \) represent the GARCH variance spillover effects between the CSI 300 index volatility and the S&P 500 volatility. The coefficient \( {a_{12}} \) reflects the size of the S&P 500 index's short-term ARCH impact spillover effect on the CSI 300 index volatility, while the coefficient \( {b_{12}} \) reflects the strength of the S&P 500 index's persistence in spillover effect on the CSI 300 index volatility. On the other hand, \( {a_{21}} \) , \( {b_{21}} \) represent the impact and persistence effects of the CSI 300 index on the S&P 500 index volatility, respectively. It is obvious to see from the Table 8 that \( {a_{12}} \) , \( {a_{21}} \) , \( {b_{12}} \) are all significant. In particular, \( {b_{21}} \) is not significant, indicating that the S&P 500's persistence in spillover effect on the CSI 300 index volatility is not strong, which could be explained by the S&P 500's location on the US stock market's more efficient market, and by the CSI 300's volatility being less affected by its historical data. This helps to explain why the CSI 300 has a bigger impact on the S&P 500 than the S&P 500 has on the CSI 300, which is consistent with the conclusion of the VAR model in the previous section.
The empirical findings demonstrate that data from the CSI 300 index and the S&P 500 index can communicate with one another, and there exists significant bidirectional volatility spillover effects between them, but the intensity of the spillover effects is somewhat different. By comparing the absolute values of the coefficients \( {a_{12}} \) , \( {a_{21}} \) , \( {b_{12}} \) , \( {b_{21}} \) , it can be seen that the spillover effects of the S&P 500 on the CSI 300's volatility are stronger, both in terms of shock and persistence. The reasons for this are: first, the US is the world's largest economy, and the US stock market, as a representative of the US capital market, has a significant impact on the global financial market, acting as a barometer of global capital markets, and its fluctuations will affect the trend of global financial markets. Second, the Chinese stock market has a short history and its mechanisms are not yet mature, making it vulnerable to external interference. Finally, as the world's second-largest capital market, China's growing global influence, although limited, indicates that to some extent, the market's assessment of the trend of US equities will be impacted by the volatility of the Chinese stock market.
4. Robustness Test
This paper will conduct three robustness tests to further explore and ensure the reliability of the research conclusions.
Firstly, this article will change the fitted data and conduct a fitting test again with data from different dates. Considering the timeliness of information, this article will use VAR to fit the S&P 500 index with the CSI 300 index lagged by one day, three days, and one week, and test its regression results. The results show that the time lag effect of information is not significant in the phenomenon of linkage between Chinese and American stock indexes, and the correlation significantly decreases after lag processing. Considering the time difference between China and the United States due to regional differences, investors in the market have sufficient time to react to the information received from the US stock market and reflect it in their investments in the Chinese stock market on the same day.
Secondly, considering that the CSI 300 index can only represent the situation of some leading stocks in certain industries, some non-leading stocks' trends are not reflected. CSI 300 index is compiled based on the stocks of all non-ST and *ST securities listed on the Shanghai Stock Exchange and depositary receipts issued by enterprises, weighted by market value, which can better reflect the trends of all stocks and make up for some of the CSI 300 index's shortcomings. Therefore, this article chooses to use CSI 300 index and the S&P 500 index again for vector autoregression fitting to measure the impact of the S&P 500 index on the overall trend of the A-share market, and the results are basically consistent. The S&P 500 index will affect the trend of the Shanghai Composite Index, whereas the S&P 500 index's trend is not significantly impacted by the Shanghai Composite Index's trend.
Finally, considering that different methods of handling non-trading day data may affect the final empirical results, the second more commonly used data processing method is adopted. All non-trading day data in the Chinese and American stock markets are removed, leaving only the stock index data on days when both markets are trading. A total of 671 data points are obtained for the same empirical research. The volatility of the CSI 300's rate of return is recorded as HCHG, and the volatility of the S&P 500's rate of return is recorded as PCHG. The final results are basically the same as in the previous article, and the S&P 500's impact on the CSI 300 is more significant, as shown in Figure 5. The CSI 300 index responds to the S&P 500 index by reaching a maximum value of 0.003 in the first period and then slightly declining to 0, which shows that the S&P 500 index's rise will have a significant impact on the CSI 300 index's rise, and the S&P 500 index's trend will have a significant impact on the CSI 300 index's trend. You can disregard how the CSI 300 index's volatility affects the S&P 500 index.
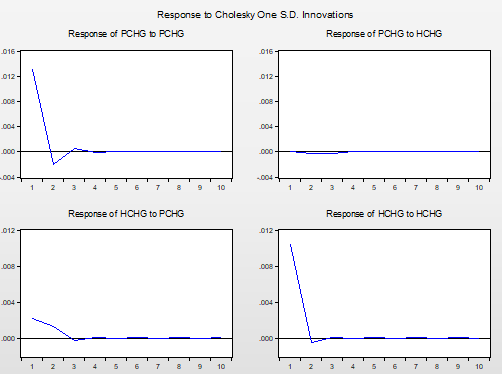
Figure 4: Impulse response function analysis (only two markets are reserved for trading days).
5. Conclusion
The S&P 500 Index and the CSI 300 Index from 2020 to 2022 are used as study samples in this article. It uses a web crawler program to gather the relevant index and price change data, then performs empirical analysis on the data using a VAR(2)-GARCH-BEKK model to examine the impact of the S&P 500 Index, which serves as a proxy for the US stock market, on the CSI 300 Index, which serves as a proxy for the Chinese stock market, and to explain the volatility relationship between the two. According to the empirical findings, the S&P 500 Index has a favorable impact on the CSI 300 Index's volatility. The volatility of the CSI 300 returns will increase if there is a favorable impact on the rise and fall of the S&P 500, and this impact will last longer on the CSI 300 returns. Ultimately, this impact will gradually approach zero, and there is a certain two-way spillover effect between the two. The CSI 300 Index is more significantly impacted by the S&P 500 Index's spillover effect. The CSI 300's trend is primarily impacted by its own prior era, and the volatility of the S&P 500 has a minimal effect on it. This experiment will more clearly show how the two are in an equilibrium relationship. The following examples show the pertinent guidelines.
Firstly, the risk contagion and spillover effects between different markets will become increasingly evident, which requires financial regulatory authorities to consider the impact of different countries' monetary policies, fiscal policies, and the fluctuations of different asset prices on China's capital market when formulating new policies in the future. This will help to improve regulatory efficiency and reduce potential financial risks in China. Secondly, in recent years, especially since the outbreak of the COVID-19 pandemic, various departments such as the Federal Reserve have implemented different and even conflicting policies to alleviate domestic contradictions, which indirectly led to various fluctuations in China's capital market. In response, China's financial regulatory authorities need to guide public opinion in a timely manner and prevent the overexpression of US stock market sentiment from affecting China's stock market.
Thirdly, the Chinese government should strengthen communication and cooperation with other countries, pay attention to the external effects caused by risk contagion, and respond to relevant policies of other countries in a timely manner to make reasonable adjustments, and even countermeasures to stabilize the capital market. Fourthly, limit the disorderly flow of international speculative capital. International speculative capital is a type of international short-term capital that looks for profit opportunities worldwide, characterized by short stay times and sensitive information response. According to IMF statistics, there are currently more than 7.2 trillion US dollars of active speculative capital worldwide. It is foreseeable that a large part of the speculative capital in China's A-share market is also waiting for opportunities. The flow of speculative capital will be somewhat impacted by the changes in the US stock market, which will result in a transfer of risk from the US stock market to the Chinese stock market. The government can therefore restrict the disorderly flow of some international speculative capital in accordance with the market's capacity to prevent the US stock market from having a negative spillover effect on the Chinese stock market. By doing this, it will be possible to stabilize market sentiment and the overall situation by reducing overall volatility and capital flow.
It is very important to research the relationships between the returns or volatility of the Chinese and US stock markets. With the trend towards economic globalization and China's ongoing adoption of the reform and opening-up policy, the interdependence between different national capital markets is becoming increasingly close. This is not only helpful for the macro-control of capital markets by countries, but also assists investors in selecting appropriate timing and predicting the overall trend in the future.
References
[1]. Rong, W.: U.S. stock roller coaster. State-Owned Enterprise Management, 9, 78-81 (2020).
[2]. Alder, M., Dumas, B. The international Portfolio Choice and Corporate Finance. Journal of Finance, 38, 925-984 (1983).
[3]. Becker, G., Finnerty, E., Friedman, J.: Economic News and Equity Market Linkage Between the U.S. and U.K. Journal of Banking and Finance, 19, 1911-1210 (1995).
[4]. Dooley, M., Hutchison, M.: Transmission of The US Subprime Crisis to Emerging Markets: Evidence on The Decoupling-Recoupling Hypothesis. Journal of International Money and Finance , 28(8): 1331-1349 (2009).
[5]. Tamakoshi, G., Hamor, S.: Transmission of Stock Prices Amongst European Counties Before and During The Greek Sovereign Debt Crisis,Economics Bulletin, 31(4), 3339-3353 (2011).
[6]. Yang, T., Zhou, F., Du, Q. et al: Fluctuation in the global oil market, stock market volatility, and economic policy uncertainty: A study of the US and China. Quarterly Review of Economics and Finance, 382(8), 727-733 (2021).
[7]. Albulescu, T.: COVID-19 and United States financial markets’ volatility. Finance Research Letters, 38(3), 10699 (2021).
[8]. Baig, S., Butt, A., Haroon, O., et al: Deaths, panic, lockdown, and US equity markets: The case of COVID-19 pandemic. Finance Research Letters, 38(4), 101701 (2020).
[9]. Li, S., Lv, G.: Cointegration of Stock Price Index Changes in China's Stock Market. Journal of Liaoning Normal University, 5, 33-35 (2001).
[10]. Chen, L., Wu P., Liu, N.: Empirical analysis of the degree of linkage of international securities market. Research on quantitative and technical economics, 11, 124—132 (2006).
[11]. Dong, X., Cao, F.: Spillover effect of domestic and foreign stock market fluctuations: An empirical study based on multivariate GARCH model. Mathematical Statistics and Management, 28(6), 1091-1099 (2009).
[12]. Liu, Y., Chen, Y., Zhou, Z.: Empirical research on the cointegration relationship and guidance relationship between A-share and H-share markets. Financial Theory and Practice, 19(02), 13-20 (2022).
[13]. Wu, L., Jiang, Z., Wang, F.: Discussion on the fluctuation trend of Sino-US stock market under the "black swan" of the new crown: An empirical study based on GARCH model. Journal of Hubei University of Economics, 19(02), 13-20 (2022).
[14]. Shen, L., Zhang J., Ye, Y.: An Empirical Study on Volatility, Leverage Effect and Linkage: Evidence from the Sino-US Stock Market under the Impact of the New Crown Epidemic. National circulation economy, 9, 32-37 (2022).
Cite this article
Yao,W. (2023). An Empirical Study on the Linkage between S&P 500 Index and CSI 300 Index under COVID-19. Advances in Economics, Management and Political Sciences,23,210-222.
Data availability
The datasets used and/or analyzed during the current study will be available from the authors upon reasonable request.
Disclaimer/Publisher's Note
The statements, opinions and data contained in all publications are solely those of the individual author(s) and contributor(s) and not of EWA Publishing and/or the editor(s). EWA Publishing and/or the editor(s) disclaim responsibility for any injury to people or property resulting from any ideas, methods, instructions or products referred to in the content.
About volume
Volume title: Proceedings of the 2023 International Conference on Management Research and Economic Development
© 2024 by the author(s). Licensee EWA Publishing, Oxford, UK. This article is an open access article distributed under the terms and
conditions of the Creative Commons Attribution (CC BY) license. Authors who
publish this series agree to the following terms:
1. Authors retain copyright and grant the series right of first publication with the work simultaneously licensed under a Creative Commons
Attribution License that allows others to share the work with an acknowledgment of the work's authorship and initial publication in this
series.
2. Authors are able to enter into separate, additional contractual arrangements for the non-exclusive distribution of the series's published
version of the work (e.g., post it to an institutional repository or publish it in a book), with an acknowledgment of its initial
publication in this series.
3. Authors are permitted and encouraged to post their work online (e.g., in institutional repositories or on their website) prior to and
during the submission process, as it can lead to productive exchanges, as well as earlier and greater citation of published work (See
Open access policy for details).
References
[1]. Rong, W.: U.S. stock roller coaster. State-Owned Enterprise Management, 9, 78-81 (2020).
[2]. Alder, M., Dumas, B. The international Portfolio Choice and Corporate Finance. Journal of Finance, 38, 925-984 (1983).
[3]. Becker, G., Finnerty, E., Friedman, J.: Economic News and Equity Market Linkage Between the U.S. and U.K. Journal of Banking and Finance, 19, 1911-1210 (1995).
[4]. Dooley, M., Hutchison, M.: Transmission of The US Subprime Crisis to Emerging Markets: Evidence on The Decoupling-Recoupling Hypothesis. Journal of International Money and Finance , 28(8): 1331-1349 (2009).
[5]. Tamakoshi, G., Hamor, S.: Transmission of Stock Prices Amongst European Counties Before and During The Greek Sovereign Debt Crisis,Economics Bulletin, 31(4), 3339-3353 (2011).
[6]. Yang, T., Zhou, F., Du, Q. et al: Fluctuation in the global oil market, stock market volatility, and economic policy uncertainty: A study of the US and China. Quarterly Review of Economics and Finance, 382(8), 727-733 (2021).
[7]. Albulescu, T.: COVID-19 and United States financial markets’ volatility. Finance Research Letters, 38(3), 10699 (2021).
[8]. Baig, S., Butt, A., Haroon, O., et al: Deaths, panic, lockdown, and US equity markets: The case of COVID-19 pandemic. Finance Research Letters, 38(4), 101701 (2020).
[9]. Li, S., Lv, G.: Cointegration of Stock Price Index Changes in China's Stock Market. Journal of Liaoning Normal University, 5, 33-35 (2001).
[10]. Chen, L., Wu P., Liu, N.: Empirical analysis of the degree of linkage of international securities market. Research on quantitative and technical economics, 11, 124—132 (2006).
[11]. Dong, X., Cao, F.: Spillover effect of domestic and foreign stock market fluctuations: An empirical study based on multivariate GARCH model. Mathematical Statistics and Management, 28(6), 1091-1099 (2009).
[12]. Liu, Y., Chen, Y., Zhou, Z.: Empirical research on the cointegration relationship and guidance relationship between A-share and H-share markets. Financial Theory and Practice, 19(02), 13-20 (2022).
[13]. Wu, L., Jiang, Z., Wang, F.: Discussion on the fluctuation trend of Sino-US stock market under the "black swan" of the new crown: An empirical study based on GARCH model. Journal of Hubei University of Economics, 19(02), 13-20 (2022).
[14]. Shen, L., Zhang J., Ye, Y.: An Empirical Study on Volatility, Leverage Effect and Linkage: Evidence from the Sino-US Stock Market under the Impact of the New Crown Epidemic. National circulation economy, 9, 32-37 (2022).