


1. Introduction
Finance has become a very important strategic discipline and technology in modern times. Among older people, finance and investment are only in the hands of large institutions and states. Individuals can also manage their wealth through financial literacy, investing in the stocks of promising companies and putting their spare cash to work to generate more wealth. There are many kinds of products such as stocks and derivatives that investors can choose to invest in. This article focuses on the stock portfolio, because it is more widely recognized by the public. Using straightforward expressions for different types of investors should be how to invest money. Many works of literature explain and analyze stock returns through the Capital pricing model (CAPM). Sharpe (1964)- Lintner (1965) once said that systemic risks should not be dispersed, but there will be excess returns as compensation for non-systemic risks [1]. In the CAPM formula, the intercept is the risk-free interest rate, and the systemic risk is the beta multiplied by excess risk. The formula assumes that only one systemic risk factor affects stock pricing. So the theory is simplistic and flawed.
According to the traditional Markowitz model (1952), the goal of portfolio construction is to assist investors in maximising their investment wealth [2]. The mean-standard deviation model is used to find the most appropriate wealth allocation portfolio to maximize profits and control and reduce risks. Chan (1999) indicates that a single time frame, is the best choice to use Markowitz's MV model in a specific time range [3].
The remainder of the essay is structured as follows. Part 2 is methodology. Part 3 provides the empirical results. Part 4 is about risk discussion and Part 5 is the conclusion.
2. Methodology
2.1. Data Selection
This article selects three stocks from there stock markets, two of which are based in US, and one is based in Australia, as follows.
QUALCOMM Incorporated (QCOM) is selected from Nasdaq, a radio communication technology research and development company. Its main business consists of intellectual property licencing, and chip products [4]. The company is one of the world's leading communications companies, and has been named a Fortune 500 company and a member of the S&P 500. ResMed Inc.(RMD) selected from NYSE, is a medical equipment company, which primarily focuses on sleep health and respiratory disease [5]. Their products are distributed across the globe and they have production facilities in four different nations. Broken Hill Proprietary Billiton Ltd (BHP) is selected from ASX, an Australian mining company with proprietary oil and mineral operations as the world's largest resource company [6]. BHP is the largest market cap company in Australia. The five-year US Treasury bond, which has the same length and frequency as stock data, was chosen as the risk-free asset in this case [7]. The risk associated with purchasing U.S. Treasury bonds is essentially zero because, as Ross (2021) noted, the American government has not recently experienced a debt default [8]. The frequency of selection of raw data is weekly data. Because the forecast with low frequency is daily data prone to huge deviation and noise due to the non-trading problems, a large standard deviation results. In addition, high-frequency forecasts perform better than low-frequency forecasts in a one-month forecast market and volatile market periods [9]. Yearly data are too wide to accurately reflect changes in returns. Hence, this article uses weekly data to calculate the portfolio.
The length of the data was selected using data from the last five years. According to Koller, et al. (2010), the stock risk can be accurately estimated by using the historical stock data of the past 4–6 years [10]. Using the data of the latest year, the data sample is not large enough, and the deviation is not objective. The data of the last 10–15 years is used, the sample is too old to reflect the recent performance of the stock. Thus, the article use of historical stock data from the past five years is appropriate.
2.2. Modelling
Data processing can be divided by four parts: calculating annual average returns, annual stander deviation and correlation between stocks; generating 500 portfolios; finding the capital allocation line and finding the minimum variance portfolio and optimal portfolio.
Arithmetic averages are used here rather than geometric averages because arithmetic averages are more suitable for forecasting because it does not consider the compound effect. So firstly, it calculates the return rate of the three companies from February 12th 2018 to February 12th 2023, then uses Excel to calculate the weekly average return and standard deviation, and annualized them. Weekly average return times 52 is equal to the annualized average return, weekly stander deviation times square root of 52 is equal to annualized stander deviation. Correlation represents the interrelationship between the stock price movement, which would affect the stander deviation of the portfolio.
Using the processed data through the Markowitz Model can generate 500 random portfolios. Then using solver to find the minimum variance portfolio and the optimal portfolio. Collects the risk-free point and the optimal portfolio and extent it, which is the capital allocation line. According to the investor's risk preference, the appropriate proportion of risk-free assets and the optimal portfolio investment strategy can be selected at the point of this capital allocation line.
3. Empirical Results
3.1. Data Processing
Table 1 reports the summary statistics of the annualized average return and the annualized stander deviation for the three companies over the last five years. The data here follows the rule that the greater the risk, the greater the return. The larger the annualized standard deviation means the higher risk of stocks, and the greater their average return. QCOM has the highest average return and most risky, 32.88% and 41.38% respectively. RMD has higher average return and lower standard deviation than BHP, which means RMD has higher sharp ratio, each additional unit of risk can earn higher return than BHP. Therefore, the subsequent portfolio will be more inclined to invest in RMD rather than BHP.
Table 1: Summary Statistics of each stock, Feb 2018 to Feb 2023.
QCOM | RMD | BHP | |
Annualized average return | 32.88% | 23.40% | 15.86% |
Annualized stander deviation | 41.38% | 26.48% | 33.88% |
Figure 1 below reports summary histogram of the three stocks’ return frequency. Figure 1 shows that the arithmetic average and standard deviation of the returns of the three companies constitute normal distribution, with 99.7% possibility falling within the mean+/- 3 standard deviation.
|
|
(a) QCOM | (b) RMD |
| |
(c) BHP | |
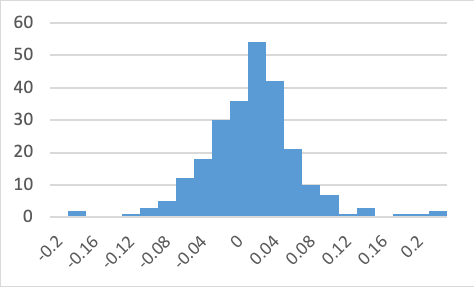
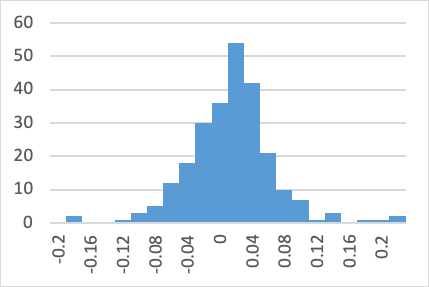
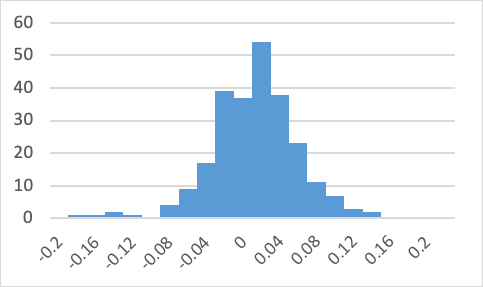
Figure 1: Histogram of the three stocks’ return frequency.
Table 2 shows the correlations between the three stocks. Correlation coefficients represent the degree of relationship between two stocks. The correlations between QCOM and RMD, RMD and BHP are positive but relatively small, which means one stock price changes the other stock would have tiny changes in the same direction. QCOM and BHP have negative correlations referring to one’s price changes the other one would move in the opposite direction.
Table 2: Correlation matrix.
QCOM | RMD | BHP | |
QCOM | 1 | ||
RMD | 0.067648 | 1 | |
BHP | -0.00506 | 0.004438 | 1 |
3.2. Portfolio Optimization
By using the Markowitz Model, randomly generates 500 portfolios shown in Figure 2. Table 3 shows the minimum variance portfolio and the optimal portfolio, which refers to the orange and purple dots in Figure 2. Based on the dense scatter, the trend of the effective frontier can be found, which is the line connecting the points with the maximum return at the same risk level above the minimum variance portfolio. The optimal portfolio is the point with maximum sharp ratio, which is 4.14. It has the steepest slope of capital market line which is capital allocation line. This line connects the risk-free rate point and tangency with the efficient frontier at the optimal portfolio point.
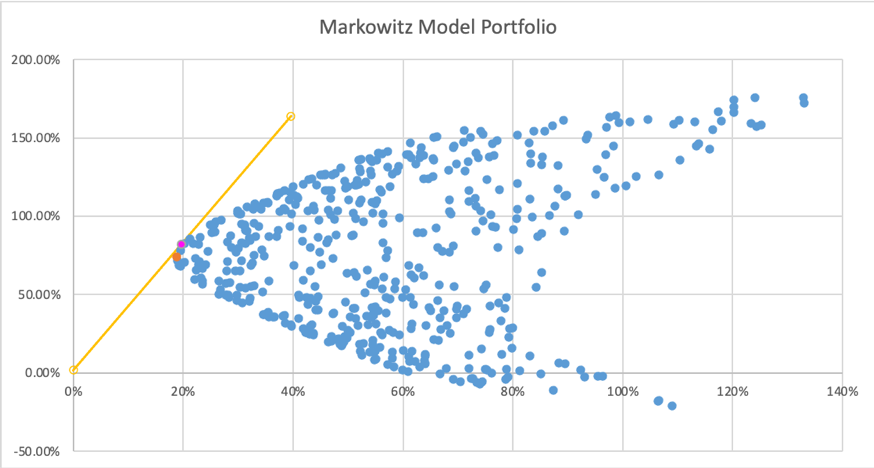
Figure 2: 500 portfolio scatter plot.
The optimal portfolio has higher return and risk than the minimum variance portfolio. The composition of the optimal portfolio proved the previous verdict that RMD has the largest weight accounting for 66.10%, BHP and QCOM accounted for a relatively small proportion, 14.92% and 18.89% respectively.
Table 3: Minimum variance portfolio and the optimal portfolio.
QCOM | RMD | BHP | Return | Standard deviation | Sharp | |
Minimum Standard Deviation | 0.1884 | 0.4972 | 0.3144 | 74.11% | 19% | 3.9377 |
Maximum Sharp ratio | 0.1492 | 0.6610 | 0.1898 | 81.91% | 20% | 4.1395 |
Table 4: S&P 500 Index annualized average return rate and standard deviation.
S&P 500 Index | |
annualized average return | -5.94% |
annualized standard deviation | 20.83% |
The optimal portfolio annualized return and annualized standard deviation based on the past 5 years’ data is 81.91% and 20% respectively. The historical data of the S&P 500 Index over the same period indicates that it is average annualized return and standard deviation over time are -5.94% and 20.83% respectively, as Table 4 shown [11]. The optimal portfolio of these three stocks is slightly less risky than the index, but returns are far superior to the index. Therefore, it has been proved that the selection of the investment portfolio can outperform the market index, making the investment risk reduced while the return performance is better.
4. Discussion
4.1. Portfolio Risk Analysis
Portfolios are subject to many risks and can be divided into two categories: systemic risk and firm-specific risk. Systemic risk is called non-dispersible risk, which is caused by macro-economy, technological updates and large-scale social events. Such risk is difficult to avoid. Firm-specific risks, also known as non-systemic risks, can be dispersed and exist for specific industries or companies. Such risks can be avoided by selecting industries and companies. This article focuses on the systemic risks posed by COVID-19 and the diversification of company-specific risks.
COVID-19 brought unprecedented blows and risks to the economy. Most cities around the world were in a state of panic and lockdown when it first gained popularity in 2020, which urged people to save money and cut back on unnecessary consumption. As the COVID spread, the government imposed strict regulations on the restaurant, travel, and other industries, which resulted in numerous job losses. Therefore, as a result of the policies and the pandemic, the global economy has been severely adverse impacted, the resulting unemployment leads to households lower or loss their incomes and limiting demand also leads to a shortage of supply, which is a vicious circle. These changes also are reflected in corporate performance and stock prices. The majority of businesses are now performing poorly on the market, and some small businesses are in danger of bankruptcy. Investors have become more risk-averse and would rather save their extra cash than invest it. Even in the face of a recession investors panic, causing markets to fall unexpectedly, and the degree of systemic risk sensitivity of each sector during COVID-19 is also different [12].
Specific risk is the risk that a particular company or industry has, and risk diversification can mitigate this risk by investing in various industries and choosing well perform companies. According to the industry correlation matrix of Bloomberg report, the internal correlation is small in energy, healthcare and information technology these three industries, with the correlation coefficients of 0.35, 0.37 and 0.39 respectively [13]. This means that price movements in one sector has little impact on other's sector’s prices, thus the risk can be diversified by allocation to stocks in the three sectors. Unique risk and correlation coefficient between companies and industries can be infinitesimal, but it cannot reach zero [14].
4.2. Choices for Different Risk-Averse Investors
In the Markowitz model, investors are assumed risk-averse, which means that the expected returns from different portfolios are equal, they will select the portfolio with the lowest level of risk. Investors would anticipate a higher return if they took on a higher level of risk. Hence, the investors would choose the point on the efficient frontier, which is the point with maximum expected return at the same level of risk or taking minimum risk when having the same level of expected return. Among all of the points on efficient frontier, rational investors would choose the point with the highest sharp ratio, because it measures the expected return from each additional unit of risk. The profitability increases as the ratio increases. The point with the highest sharp ratio is the optimal portfolio. Therefore, risk-averse investors with different degrees of aversion can choose the investment proportion in the capital allocation line, which is the line connected between risk-free assets and the optimal portfolio.
For the less risk averse investors they could choose the right side of the optimal portfolio on the capital allocation line in Figure 2. Due to their high risk tolerance, investors can choose to take more risks and get higher returns. So they can use leverage to buy more of the optimal portfolio by shorting risk-free assets, thus reaching a point on the right side of the optimal portfolio among the capital allocation line. Conversely, for investors with a high risk aversion, it is more appropriate to select the points on the capital allocation line to the left of optimal portfolio in Figure 2. Investors can invest part of the money in risk-free assets to reduce the overall risk, and invest the rest of the money in optimal portfolio. Although ensures the maximum sharp ratio and reduces part of risks, reduces the expected return of investment.
5. Conclusion
This paper mainly uses Markowitz model to calculate the optimal portfolio of three stocks. Using the selected data, it can be concluded that the historical stock prices are indeed normally distributed, and follow the principle of higher risk, higher expected return. Systemic risks cannot be avoided, but industries and companies with small correlation coefficients can be selected to effectively disperse non-systemic risks and thus outperform the market index. The minimum variance portfolio and optimal portfolio can be found on efficient frontier. The extension of risk-free assets and optimal portfolio is called the capital allocation line. Depending on the level of risk aversion of the investor, appropriate points can be found along the line and allocate money to different proportions of risk-free assets and to the optimal portfolio.
The defects of Markowitz's model are as follows: relying on historical data, it cannot accurately estimate the future stock price, and using mean and variance forecasts do not consider the related potential risk factors. The historical data in the past can only represent the changing trend in the past. The stock price should be subject to a random walk, and future change cannot be predicted, so this is also one of the defects of the model. There are many risk factors that Markowitz model does not take into account, such as interest rate risk, inflation risk, exchange rate risk and policy changes. Even major social events such as COIVD-19 have a great impact on stock performance but cannot be predicted. Some of these risk factors are not reflected in mathematical models, while others cannot be quantified temporarily. Therefore, Markowitz model can be used as a reference for investors, but it cannot accurately predict the future trend of stocks.
References
[1]. Sharpe, W. F.: Capital asset prices: a theory of market equilibrium under conditions of risk*. Journal of Finance 19(3), 425–442 (1964).
[2]. Markowitz, H. M. Portfolio Selection. Journal of Finance 7(1), 77 (1952).
[3]. Chan, L. K., Karceski, J., & Lakonishok, J. On Portfolio Optimization: Forecasting Covariances and Choosing the Risk Model. Review of Financial Studies 12(5), 937–974 (1999).
[4]. Wireless Technology & Innovation, Mobile Technology, Qualcomm. https://www.qualcomm.com/home, last accessed 2023/03/01.
[5]. Anz, R. ResMed, Sleep Apnea, Insomnia, CPAP & Snoring Solutions. ResMed. https://www.resmed.com.au/, last accessed 2023/03/01.
[6]. BHP Homepage, https://www.bhp.com, last accessed 2023/03/01.
[7]. Resource Center, U.S. Department of the Treasury. https://home.treasury.gov/resource-center/data-chart-center/interest-rates/, last accessed 2023/03/01.
[8]. Ross, S. What Are the Risks of Investing in Treasury Bonds? Investopedia. https://www.investopedia.com/ask/answers/042215/what-are-risks-associated-investing-treasury-bond.asp, last accessed 2023/03/01.
[9]. Hautsch, N., Kyj, L. M., & Malec, P. The Merit of High-Frequency Data in Portfolio Allocation. Social Science Research Network (2011).
[10]. Copeland, T. E., Koller, T., & Murrin, J. Valuation: Measuring and managing the value of companies. Long Range Planning 25(1), 125 (1992).
[11]. Yahoo Finance, https://finance.yahoo.com/, last accessed 2023/03/01.
[12]. Uyar, U., & Uyar, S. G. K. The Impact Of Covid-19 Pandemic on Systematic Risk of S&P 500 Sectors: A Wavelet Power Spectrum Analysis. Ege Academic Review, 59–74 (2022).
[13]. Undeniable Proof that You Need Diversification, Goela School of Finance. https://goelasf.com/undeniable-proof-that-you-need-diversification/, last accessed 2023/03/01.
[14]. Sukcharoen, K., & Leatham, D. J. Dependence and extreme correlation among US industry sectors. Studies in Economics and Finance, 33(1), 26–49 (2016).
Cite this article
Luo,Y. (2023). An Empirical Analysis of Portfolio Management. Advances in Economics, Management and Political Sciences,24,43-49.
Data availability
The datasets used and/or analyzed during the current study will be available from the authors upon reasonable request.
Disclaimer/Publisher's Note
The statements, opinions and data contained in all publications are solely those of the individual author(s) and contributor(s) and not of EWA Publishing and/or the editor(s). EWA Publishing and/or the editor(s) disclaim responsibility for any injury to people or property resulting from any ideas, methods, instructions or products referred to in the content.
About volume
Volume title: Proceedings of the 2023 International Conference on Management Research and Economic Development
© 2024 by the author(s). Licensee EWA Publishing, Oxford, UK. This article is an open access article distributed under the terms and
conditions of the Creative Commons Attribution (CC BY) license. Authors who
publish this series agree to the following terms:
1. Authors retain copyright and grant the series right of first publication with the work simultaneously licensed under a Creative Commons
Attribution License that allows others to share the work with an acknowledgment of the work's authorship and initial publication in this
series.
2. Authors are able to enter into separate, additional contractual arrangements for the non-exclusive distribution of the series's published
version of the work (e.g., post it to an institutional repository or publish it in a book), with an acknowledgment of its initial
publication in this series.
3. Authors are permitted and encouraged to post their work online (e.g., in institutional repositories or on their website) prior to and
during the submission process, as it can lead to productive exchanges, as well as earlier and greater citation of published work (See
Open access policy for details).
References
[1]. Sharpe, W. F.: Capital asset prices: a theory of market equilibrium under conditions of risk*. Journal of Finance 19(3), 425–442 (1964).
[2]. Markowitz, H. M. Portfolio Selection. Journal of Finance 7(1), 77 (1952).
[3]. Chan, L. K., Karceski, J., & Lakonishok, J. On Portfolio Optimization: Forecasting Covariances and Choosing the Risk Model. Review of Financial Studies 12(5), 937–974 (1999).
[4]. Wireless Technology & Innovation, Mobile Technology, Qualcomm. https://www.qualcomm.com/home, last accessed 2023/03/01.
[5]. Anz, R. ResMed, Sleep Apnea, Insomnia, CPAP & Snoring Solutions. ResMed. https://www.resmed.com.au/, last accessed 2023/03/01.
[6]. BHP Homepage, https://www.bhp.com, last accessed 2023/03/01.
[7]. Resource Center, U.S. Department of the Treasury. https://home.treasury.gov/resource-center/data-chart-center/interest-rates/, last accessed 2023/03/01.
[8]. Ross, S. What Are the Risks of Investing in Treasury Bonds? Investopedia. https://www.investopedia.com/ask/answers/042215/what-are-risks-associated-investing-treasury-bond.asp, last accessed 2023/03/01.
[9]. Hautsch, N., Kyj, L. M., & Malec, P. The Merit of High-Frequency Data in Portfolio Allocation. Social Science Research Network (2011).
[10]. Copeland, T. E., Koller, T., & Murrin, J. Valuation: Measuring and managing the value of companies. Long Range Planning 25(1), 125 (1992).
[11]. Yahoo Finance, https://finance.yahoo.com/, last accessed 2023/03/01.
[12]. Uyar, U., & Uyar, S. G. K. The Impact Of Covid-19 Pandemic on Systematic Risk of S&P 500 Sectors: A Wavelet Power Spectrum Analysis. Ege Academic Review, 59–74 (2022).
[13]. Undeniable Proof that You Need Diversification, Goela School of Finance. https://goelasf.com/undeniable-proof-that-you-need-diversification/, last accessed 2023/03/01.
[14]. Sukcharoen, K., & Leatham, D. J. Dependence and extreme correlation among US industry sectors. Studies in Economics and Finance, 33(1), 26–49 (2016).