


1 Introduction
Christopher, a famous American supply chain expert, once pointed out that "there are only supply chains without enterprises in the market". [1] Therefore, it is very necessary to form an efficient supply chain network at present. If the reliability of the supply chain structure cannot meet the requirements of enterprise development, the service level will be reduced, and the collapse of nodal enterprises will lead to the destruction of the whole supply chain network system.
This paper attempts to research the change of node structure feature caused by the uncertainty of information. Through the analysis of enterprise data, we use computer language to output the topological structure diagram of the supply chain network with the proportion of shares among enterprises, and output the value of structural characteristics to find ways to improve the stability and risk minimization of the supply chain network.
2 Literature review
2.1 Current Chinese supply network
Components. A supply chain is a logistics network composed of suppliers, manufacturers, warehouses, distribution centers, and distributors. An enterprise is a node, and there is a demand-supply relationship between the node enterprise and the node enterprise. The supply chain is complex, dynamic, driven by user demand, and intersecting.[2] The supply chain of the automobile industry selected in this paper belongs to a special kind of supply chain, which is also the most complete supply network. As a typical deeply processed product, the automobile will go through multiple steps, requiring the participation of multiple enterprises to provide raw materials or intermediate products.
Regulations. The network structure of the supply network and the diversity of enterprise nodes determine that it will face many uncertainties in a complex and changeable environment. If one node suffers from a risk, it will generate a chain reaction. Companies traditionally use multiple sources for material procurement and/or hold safety stocks to avoid unreliability. However, these strategies can negatively impact the supply chain performance, leading to higher purchase and logistics costs. [3]
The complex supply network between firms is a core feature of the modern economy. An airplane, for example, consists of multiple parts, each of which is critical to its production. And each part comes from a different supplier. The part itself is produced using multiple inputs, and so on. Due to the resulting interdependencies, heterogeneous shocks can lead to cascading failures and disrupt many firms. [4]
2.2 Introduction of Topology Structure of Supply Network
A topology diagram is a network diagram composed of network nodes and communication media. There is a simple topology structure figure:
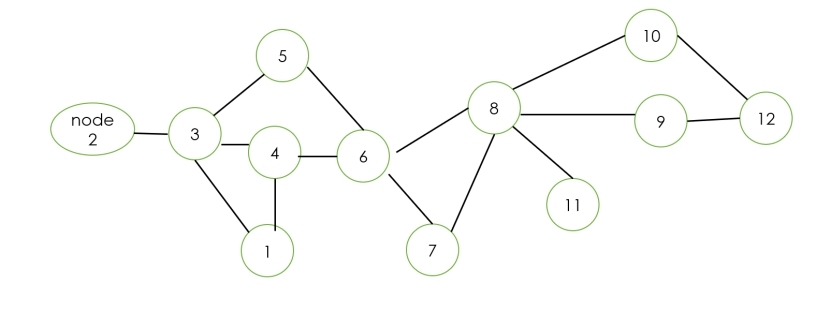
Figure 1: A Simple Topology Structure
3 Methodology
We can see the topology structure is very widespread in the supply network. Therefore, we will choose to use the topology structure to research on the reliability of the supply chain from the perspective of topology structure and output the structure features by using Python.
3.1 Topology structure in supply chain network of manufacture model
Automotive supply chain structure introduction. The automobile supply chain network is a complex multisource network structure centered on automobile enterprises, scattered from suppliers to provide raw materials to manufacturers to process products and finally to distributors to sell products to customers.
The characteristics of complex networks in supply chain system. An automotive supply chain is an undirected graph and an automotive supply chain is a set of non-empty finite nodes. To V (G) ={V1,V2,V3,....},N is expressed as the number of enterprise nodes in the supply complex network.E(G)={e1,e2,e3,...} denotes the dependence of supply chain network.[5]
A. The shortest path: connecting supply chain network nodes VI and V. The distance with the fewest edges between. This paper uses the Dijkstra algorithm in the Python environment to calculate the shortest path between each node in detail.
B. The average path length: node V in the network. The shortest path to node vj is the path length of the two points. The calculation formula is
L= \( \frac{1}{\frac{N(N−1)}{2}} \) (1)
Node importance: node importance reflects the influence of enterprise nodes in the entire supply chain network, and the calculation formula is
Cd= \( \frac{K(x)}{N−1} \) (2)
Clustering coefficient: Clustering coefficient is an index to evaluate the intimacy degree between complex networks, and the calculation formula is
Ci= \( \frac{2Ei}{[ki(ki−1)]} \) (3)
Scale factor: r of the fitting result is taken as a scale factor to indicate the degree of fitting power law distribution.
Degree distribution: The degree of a point refers to the number of edges connected to the node and other nodes. Intuitively, the greater the degree of a node is, the node occupies a relatively important position in the complex hybrid network. We rely on the characteristics of degree distribution to determine which network supply chain networks belong to. Previous studies have identified supply chain networks as having the characteristics of both small world networks and scale-free networks. [6]
Object selection. This paper selects the data from the "China Automobile Industry Yearbook" in 2018 and 2020, and draws the network topology of the enterprise. This paper uses the Networkx complex network analysis toolkit in the python language environment to draw the supply chain topology diagram of the two major companies in 2018 and 2020 and return the characteristic values.
3.2 Python networkx codes details
This paper employs Python networkx to output the topology structures of these two enterprises’ supply complex networks.
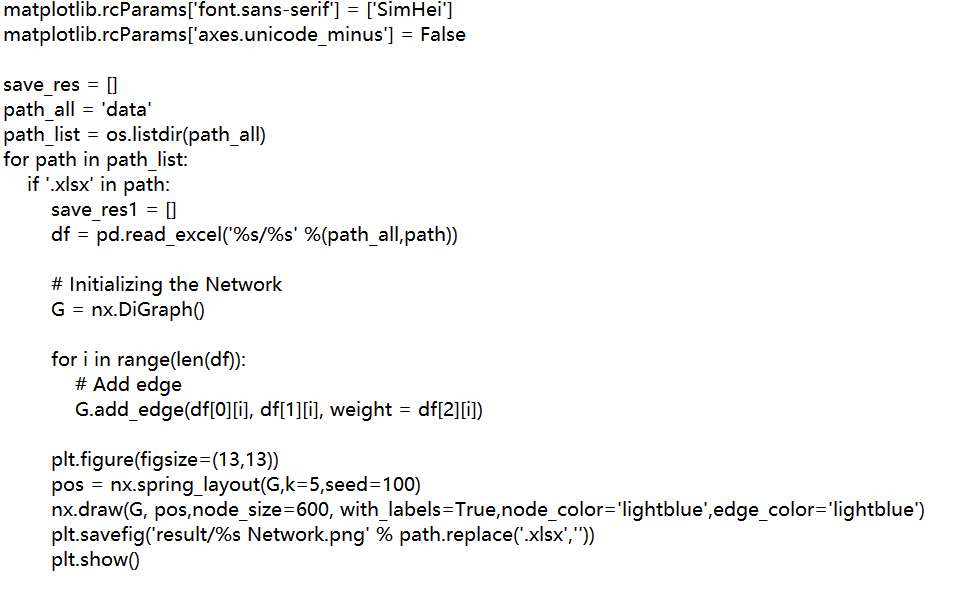
Figure2: Python codes of initializing the Network
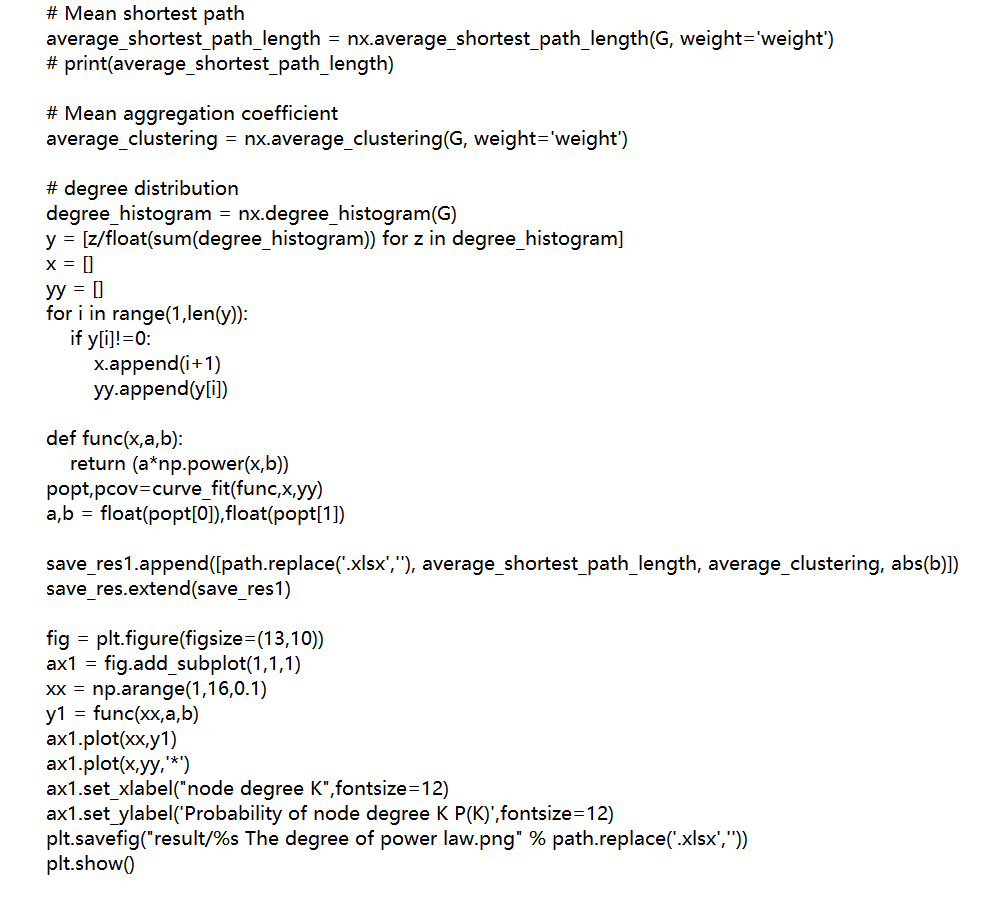
Figure3: Python codes of outputting feature values
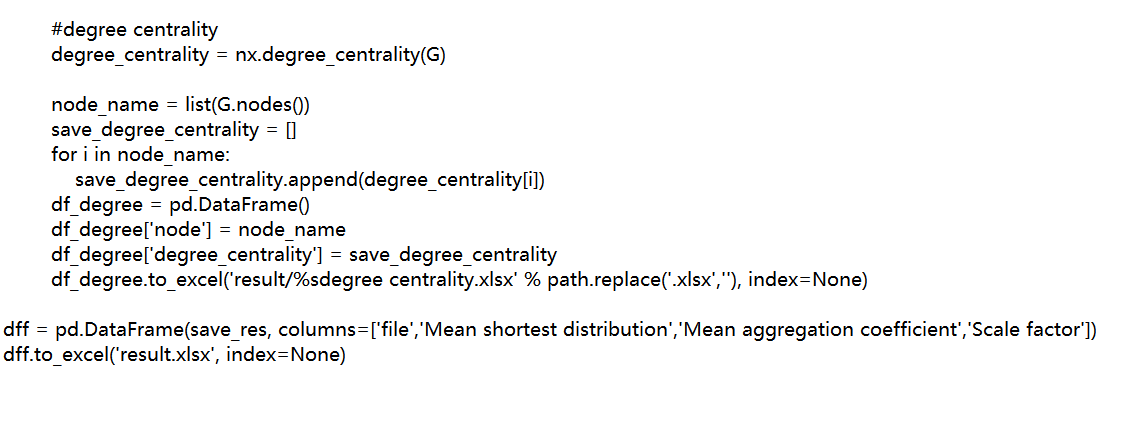
Figure4: Python codes of outputting feature values
After running the codes, we can output some topology structure pictures and structure feature table. We list one topology structure as below:
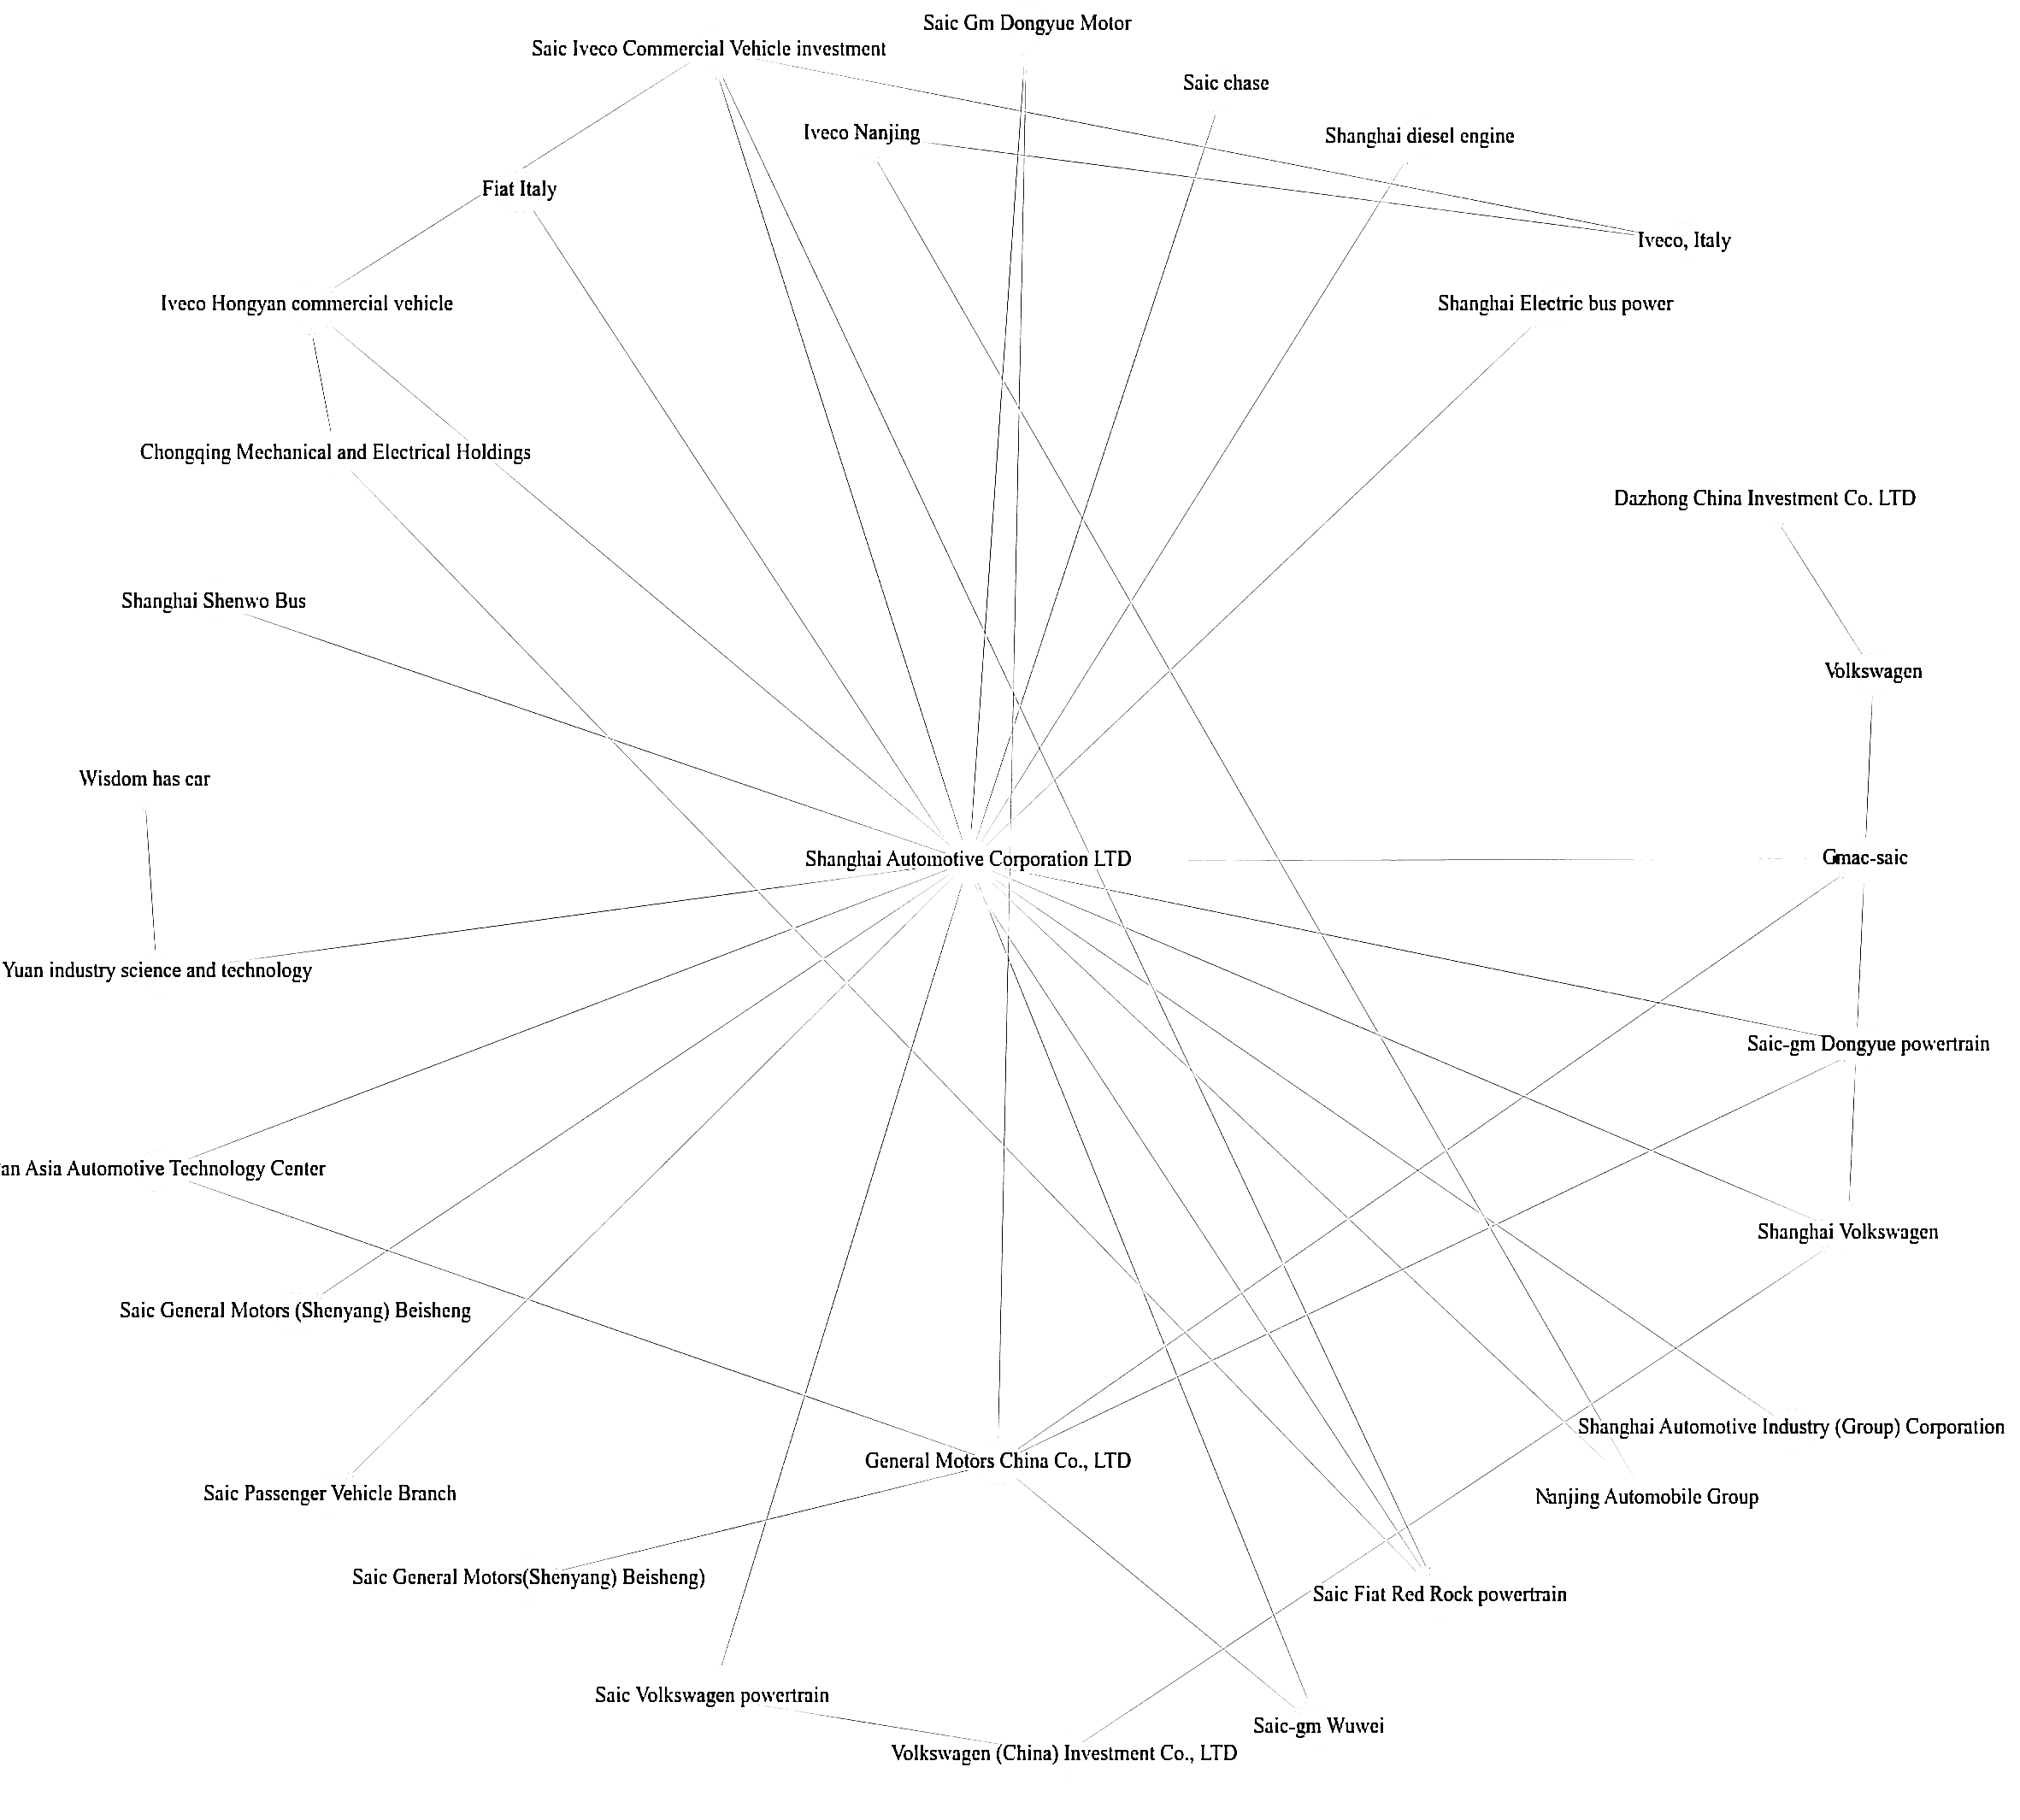
Figure5: Network topology of vehicle and engine enterprises affiliated to Shanghai Motor in 2018
Table1: Structural characteristics of supply chain network
Mean shortest path | Clustering coefficient | Scale factor | Significant nodes | |
Dongfeng 2018 | 5.45230 | 0.013130 | 1.10192 | Shanghai Automotive Corporation; General Motors; Volkswagen Investment |
Dongfeng 2020 | 7.24661 | 0.012677 | 2.59554 | Shanghai Automotive Corporation; General Motors; Shanghai Iveco Commercial Vehicle investment |
Shangqi 2018 | 6.87072 | 0.008486 | 2.17304 | Dongfeng Motor Group; Honda |
Shangqi 2020 | 7.41532 | 0.013657 | 1.04016 | Dongfeng Motor Group; |
3.3 Analysis of the data results
Through the rapid development of the manufacturing industry in recent years, the average shortest path of both Shanghai and Dongfeng has increased slightly, which not only means that the supply chain network of these two automobile companies is constantly expanding, but also affects the logistics and transportation of the supply chain. With the cost bringing more pressure, they put forward higher requirements. At the same time, we observe from Table 1 that the clustering factor of Dongfeng Motor has decreased from 0.13 in 2018 to 0.12 in 2020. Most enterprises in the supply chain network of Dongfeng Motor have a small node degree, and only a small number of enterprises have an increased node degree. . And we can also observe that most of the enterprises in Shanghai Motor's supply chain network have increased node degrees, which has strengthened the connection between enterprises and made the entire supply chain system more solid. When a risk occurs in a core enterprise, the entire supply chain will have better liquidity, the vulnerability will decrease, and the reliability will increase. However, if the risk occurs in the core enterprises in the supply chain network of Dongfeng Motor, the circulation of the supply chain network cannot be maintained well, which has obvious vulnerability and relatively low reliability. Therefore, it is essential and urgent for Dongfeng Motor to establish a supply chain network with high aggregation factors and high degree of nodes.
The average shortest path of Dongfeng Motor and SAIC Motor has increased, which not only means the expansion of the entire automotive supply chain network, but also puts forward higher requirements on the transmission speed and time of supply chain information flow. What we are concerned about is how to avoid the bullwhip effect from having a greater impact on the supply chain. Likewise, the reduced aggregation coefficient also poses a challenge to the survival of SMEs. Important nodes are closely linked because the supply network has the characteristics of a small world. If a risk is encountered, the transmission rate of important nodes will also affect other important nodes. In this way, the risks continue to expand, and the important nodes of the supply chain network become more vulnerable.
From 2018 to 2020, we can observe that the average distance and scale factor of Dongfeng Motor’s supply chain increased, which may be due to the direct cooperation between Shanghai Iveco and Nanjing Iveco in 2020. It also changes the significant nodes. Once one of the nodes is connected to each other, its burden will be distributed to other enterprises. Due to the impact of the effects of the small world, the transmission efficiency will increase so that the obstacles will not be broken and spread.
Then, we use MATLAB to analyze and process the results obtained by Python, and finally get the degree distribution curve, and the fitting result is similar to the power law distribution.
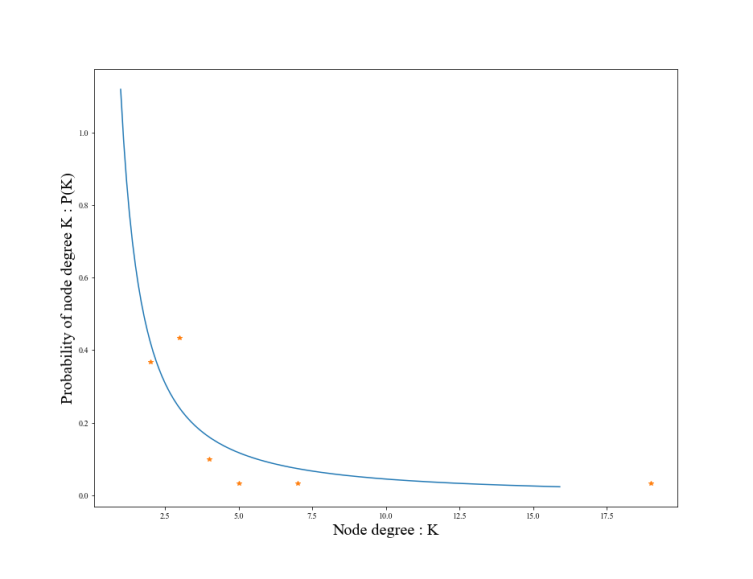
Figure6: Shanghai Automotive Network structure distribution fitting curve in 2018
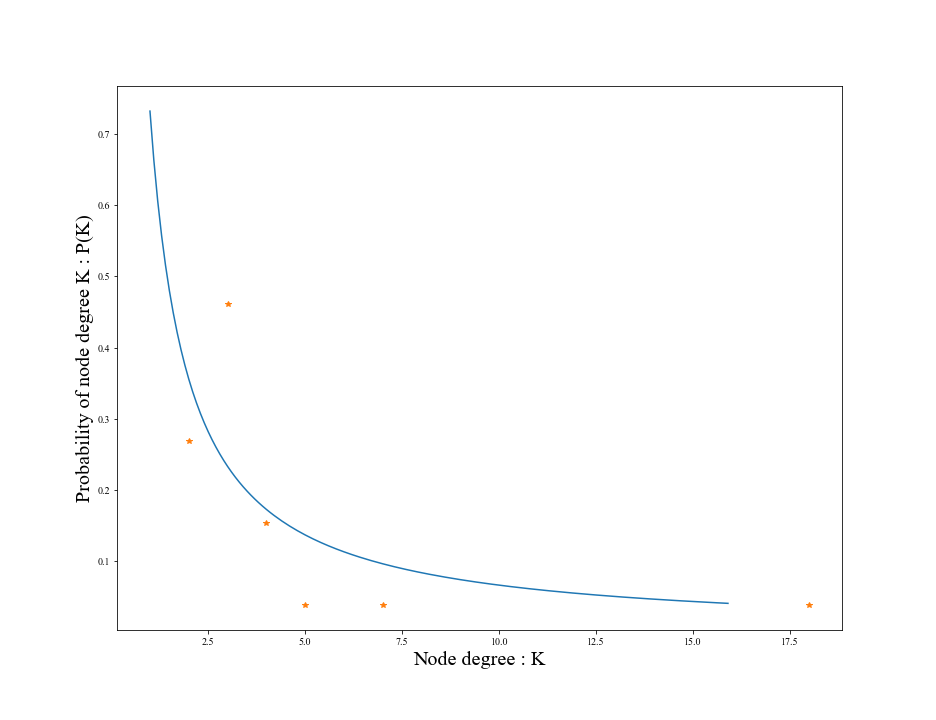
Figure7: Shanghai Automotive Network structure distribution fitting curve in 2020
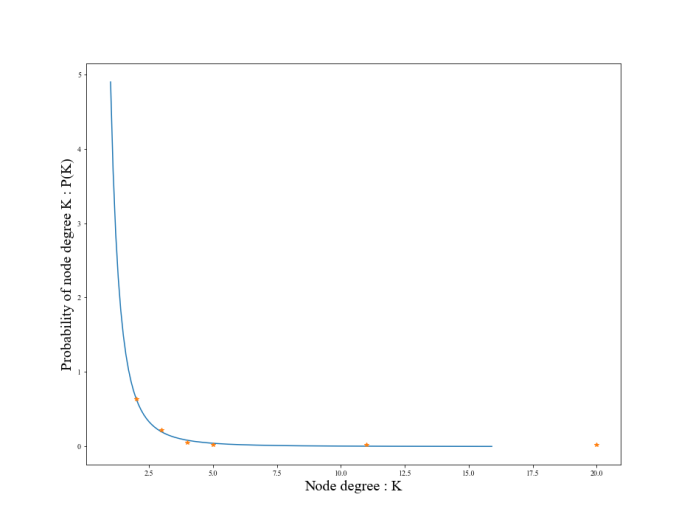
Figure8: Dongfeng Automotive Network structure distribution fitting curve in 2018
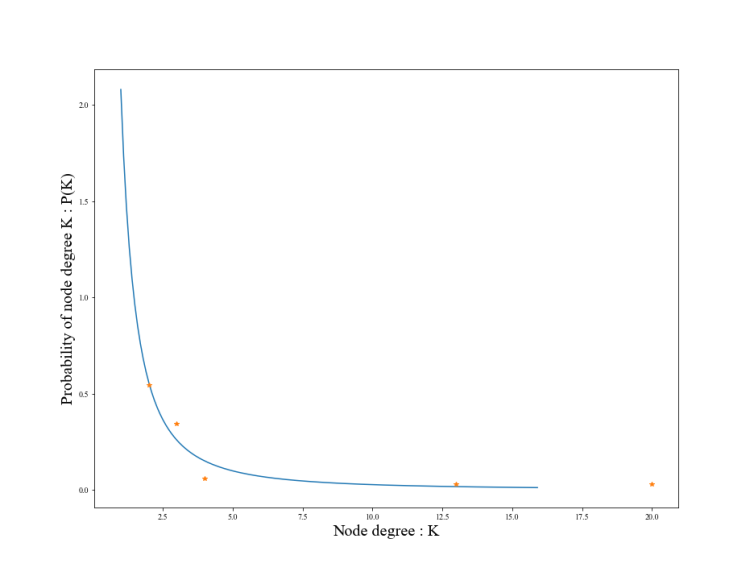
Figure9: Dongfeng Automotive Network structure distribution fitting curve in 2020
From the figures from Matlab output, it can be seen that the scaling factor of Dongfeng Motor decreased in 2020, reflecting the decline of scale-free degree, which to some extent can indicate the enhanced reliability of the supply chain. However, the scaling factor of Shanghai Automobile will increase in 2020, which reflects the increase in scale-free degree, and also indicates the decline of supply chain reliability to some extent. At the same time, it should also be appropriate to add supply chain redundancy to promote the recovery of the supply chain after the interruption, thereby forming an elastic supply chain and reducing the vulnerability of the supply chain network.
4 Conclusion
We find that the complexity dimensions negatively affect supply network performance with the performance decrease depending on the scope of control.[7]
Next, we use the Networkx algorithm and Matlab software in Phython to analyze the supply chain network characteristics of Changan Automobile and Shanghai Automobile in 2018 and 2020. Through analysis, we find that the domestic automotive supply chain network is still in the stage of growth, node dependence is strong, and there is a lack of flexibility. It is necessary to constantly evolve and absorb new enterprise nodes, and strengthen cooperation with small and medium-sized enterprises to prevent the interruption of important node enterprises from causing the collapse of the whole supply chain network. At the same time, we can also find the vulnerable nodes of the entire supply chain network through the importance of nodes, and the topology structure can well reflect the characteristics of the automotive supply chain network.
Due to the very limited data, the scope of this study is not sufficiently detailed. Future works that provide a more rigorous understanding of the structure of supply chain systems, how these structures differ across industries and how these structures are affected by shocks and changes would be very welcome. If more data could be collected, we would gain insight into how to improve supply chain networks.
References
[1]. Lokhman, H. O., Ahmad Raflis, C. O., & Ishak, S. (2021). Assessing supply network complexity in maritime industry in malaysia: Inter-firms’ relations drives pattern of supply network structure. LogForum, 17(1) Retrieved from https://www.proquest.com/scholarly-journals/assessing-supply-network-complexity-maritime/docview/2537688865/se-2.
[2]. Pathak S D, Day J M, Nair A, et al. Complexity and Adaptivity in Supply Networks: Building Supply Network Theory Using a Complex Adaptive Systems Perspective*[J]. Decision Sciences, 2007, 38(4): 547-580.
[3]. Zhong Qiu Yu A System Approach to Risk Management in the Age of Supply Chain Complexity[J] Advanced Materials Research, 2012, 1700(490-495)
[4]. Elliott, M., C.-P. Georg, and J. Hazell (2021a): “Supply Network Foundation and Fragility” , Journal of Economic Theory, 2.
[5]. M., B. Golub, and M. O. Jackson (2014): “Financial Networks and Contagion,” American Economic Review, 104, 3115–53.
[6]. Giannoccaro, Ilaria, Anand Nair, and Thomas Choi. "The Impact of Control and Complexity on Supply Network Performance: An Empirically Informed Investigation Using NK Simulation Analysis." Decision Sciences 49.4 (2018): 625-59. Web.
[7]. Adenso-Diaz,Belarmino Mena,Carlos Garcia-Carbajal,et al.The impact of supply network characteristics on reliability[J].Supply Chain Management:An International Journal,2012,17(3):263-276.
Cite this article
Huang,L. (2023). Research on Structure Features of Supply Chain from the Perspective of Complex Network. Advances in Economics, Management and Political Sciences,4,459-467.
Data availability
The datasets used and/or analyzed during the current study will be available from the authors upon reasonable request.
Disclaimer/Publisher's Note
The statements, opinions and data contained in all publications are solely those of the individual author(s) and contributor(s) and not of EWA Publishing and/or the editor(s). EWA Publishing and/or the editor(s) disclaim responsibility for any injury to people or property resulting from any ideas, methods, instructions or products referred to in the content.
About volume
Volume title: Proceedings of the 6th International Conference on Economic Management and Green Development (ICEMGD 2022), Part Ⅱ
© 2024 by the author(s). Licensee EWA Publishing, Oxford, UK. This article is an open access article distributed under the terms and
conditions of the Creative Commons Attribution (CC BY) license. Authors who
publish this series agree to the following terms:
1. Authors retain copyright and grant the series right of first publication with the work simultaneously licensed under a Creative Commons
Attribution License that allows others to share the work with an acknowledgment of the work's authorship and initial publication in this
series.
2. Authors are able to enter into separate, additional contractual arrangements for the non-exclusive distribution of the series's published
version of the work (e.g., post it to an institutional repository or publish it in a book), with an acknowledgment of its initial
publication in this series.
3. Authors are permitted and encouraged to post their work online (e.g., in institutional repositories or on their website) prior to and
during the submission process, as it can lead to productive exchanges, as well as earlier and greater citation of published work (See
Open access policy for details).
References
[1]. Lokhman, H. O., Ahmad Raflis, C. O., & Ishak, S. (2021). Assessing supply network complexity in maritime industry in malaysia: Inter-firms’ relations drives pattern of supply network structure. LogForum, 17(1) Retrieved from https://www.proquest.com/scholarly-journals/assessing-supply-network-complexity-maritime/docview/2537688865/se-2.
[2]. Pathak S D, Day J M, Nair A, et al. Complexity and Adaptivity in Supply Networks: Building Supply Network Theory Using a Complex Adaptive Systems Perspective*[J]. Decision Sciences, 2007, 38(4): 547-580.
[3]. Zhong Qiu Yu A System Approach to Risk Management in the Age of Supply Chain Complexity[J] Advanced Materials Research, 2012, 1700(490-495)
[4]. Elliott, M., C.-P. Georg, and J. Hazell (2021a): “Supply Network Foundation and Fragility” , Journal of Economic Theory, 2.
[5]. M., B. Golub, and M. O. Jackson (2014): “Financial Networks and Contagion,” American Economic Review, 104, 3115–53.
[6]. Giannoccaro, Ilaria, Anand Nair, and Thomas Choi. "The Impact of Control and Complexity on Supply Network Performance: An Empirically Informed Investigation Using NK Simulation Analysis." Decision Sciences 49.4 (2018): 625-59. Web.
[7]. Adenso-Diaz,Belarmino Mena,Carlos Garcia-Carbajal,et al.The impact of supply network characteristics on reliability[J].Supply Chain Management:An International Journal,2012,17(3):263-276.