


1. Introduction
Starbucks is a transnational American network of coffee shops that was founded in Seattle in 1971. It is the largest coffee chain shop in the world. Their declaration is: To inspire and nurture the human spirit - one person, one cup and one neighborhood at a time.
54% of Americans over the age of eighteen consume coffee every day in the United States, and they spend more than $40 billion per year on this beverage [1], indicating that this market has huge potential and is profitable. Starbucks has always been in an excellent position in the industry. In 2020, Covid-19 will greatly affect the global economy, especially the food and beverage industry. Starbucks has also made strategic adjustments to survive the crisis. It was also selected by Fobes Magazine as the No. 1 Most Admired Company in the food service industry in 2023 [2], which is based on a comprehensive evaluation of Starbucks covering nine criteria including product value and investment quality.
This paper will figure out the performance of Starbucks in the past five years by analyzing its business model, strategy, and ratio.
2. Literature Review
2.1 Business Strategy
A business strategy is an outline of the actions and decisions a corporate plans to take to achieve its business goals. Business strategy determines what a company needs to do and when, which can help guide the decision-making process for resource allocation and hiring. The success of a firm is dependent on its business plan, which determines various business factors such as prices, suppliers, recruitment and resource allocation. A company cannot produce value without a defined business plan, and it is unlikely to succeed without one [3].
2.2 Financial Ratios Analysis
A financial ratio is the relative size of two values selected from a company's financial statements and is used to evaluate the overall financial status of a company or other organization. The first level of business ratio analysis considers operating levels and earnings, returns, and assets. There are two main drivers of operational performance at this level: Profit margin refers to profit as a percentage of sales, and the ratio of assets to total sales indicates how well a company is operating. The degree of financial leverage is the second level of ratio analysis. The fundamental concept is to increase ROE while maintaining ROA by using external financial resources rather than internal ones [4]. At this stage, maintaining the right balance between profit and risk is crucial. The stock market level is the third level, considering NPV, WACC, NOPAT and other ratios to judge whether a company has good market growth prospects [5]. Sustainability assessment is one of the purposes of using financial ratios. Financial ratios, for instance, are used in agricultural accounting analysis to evaluate a farm's financial situation. Research provided by the financial sector utilizes economic indicators and financial ratios to assess firm capabilities and risks of failure [6].
2.3 COVID-19 Pandemic
Severe Acute Respiratory Syndrome Coronavirus, the viral illness COVID-19, emerged in late 2019 and has since spread rapidly across the globe. The COVID-19 pandemic has immediate public health implications. As of April, 2023, More than 680,000,000 people have been infected with COVID-19, and more than 6,800,000 have died as a result. In addition, the epidemic has affected supply chain operations, economic growth and environmental performance [7]. Many industries, such as aviation, tourism, food processing and retail industries, have been severely affected. For example, in Turkey, the industries with the largest reduction in employment are the tourism and food and beverage industries, with 205,000 job losses a year [8]. And, in 2020, Starbucks also closed more than 200 stores in China due to the coronavirus. However, with the development of vaccines and the improvement of targeted medical services, the new crown epidemic has been effectively controlled, and most countries have lifted restrictions by the end of 2022.
3. Analysis of Starbucks Strategy
3.1 Starbucks’ Business Model
Starbucks' value proposition is to allow customers to enjoy the world's best coffee tasting experience through the pursuit of innovation, quality, convenience, variety and brand. The main resources are store distribution network, high-quality coffee grower centers. The main activities are product development, marketing, supply chain management, etc. Starbucks has a variety of channels, including self-operated and franchised stores, grocery stores, apps and social media [9].
Starbucks' key partners are mainly coffee bean suppliers, which are mainly divided into three growing regions: the Asia-Pacific region Africa and Latin America, , especially Brazil, Colombia and Ethiopia, but also Guatemala, Indonesia and other countries. Starbucks' purchasing teams travel the world to visit coffee farms and meet growers to collaborate on improving the quality of their coffee beans. Another key partner is equipment maker Mastrena, which supplies equipment exclusively for Starbucks coffee.
Regarding customer segmentation, the first is age. Starbucks' main target customers are men and women aged 25-40, customers in this age group tend to have higher socioeconomic status, and secondary targets are young people aged 18-24, most of whom are on campus. Starbucks locations on university campuses are particularly attractive because they tend to be chosen as places for learning and socializing in addition to serving food [10]. Through psychographic segmentation, it is shown that Starbucks' customers belong to the upper middle class and are generally college educated [11]. Starbucks is more likely to succeed through individuals in the single and newlywed stages when differentiated by the family life cycle (FLC), which includes single, newlywed, full nest, empty nest, and solitary stages. Regarding the geographical location, most of the stores are located in the North America, mainly the United States, Canada, and Brazil, with a total of 9,684 stores. This is followed by the Asia-Pacific region, which includes China, Japan and Thailand, with a total of 5,159 stores.
Starbucks maintains customer relationships in several ways. Starbucks released a mobile app in 2009, provided in-app payment in 2011, and launched mobile reservation and payment in 2014, allowing customers to place orders anytime, anywhere and avoid waiting in line. At the same time, Starbucks also launched a loyalty program. As part of the rewards program, customers are awarded stars for completing purchases. After earning stars, customers can enjoy rewards such as free coffee, membership day and exclusive games. The program is linked to a mobile app, and customers can check their points at any time through their mobile devices. In addition, Starbucks also provides a good in-store experience and 1:1 customer personalized service, for instance, they write the customer's name on the cup they give them.According to statistics, the vast majority of purchases are fairly frequent repeated decisions, and even 20% of loyal customers will visit the store 16 times within four weeks [12], saying Starbucks has a very strong customer stickiness.
Regarding the income structure of Starbucks, it is mainly divided into company-operated stores and licensed stores. For example, in 2022, 82% of the total revenue came from the company's self-operated stores, of which beverages accounted for about 75% of self-operated stores' revenue, food accounted for about 20%, and 5% included ready-to-eat beverages, packaged and single- serve coffees and teas and Starbucks water glasses and other items. Licensing store revenue accounted for about 11% of total revenue, and the rest was other revenue, mainly from the sale of packaged coffee, tea and ready-to-eat beverages [13]. As for the cost structure, it mainly included rent, employee salaries, food raw materials such as coffee beans, milk, management expenses.
3.2 Special Strategy Changes during and after Covid-19
The Covid-19 outbreak has made it impossible for Starbucks to adopt its traditional operating model. The most significant change in its operating model is the closure of outlets. For example, in China, Starbucks closed more than 2,000 stores in early 2020. In order to cope with the impact of the epidemic, Starbucks provides users with an advance order service, which is convenient for customers to pick up in-store, take-out, and curbside pick-up. Some stores provide drive-thru, drive-thru, and take-out services [14]. Since Starbucks has been conducting far-reaching experiments in the background, concepts such as automatic applications and self-pickup stores are far ahead of its contemporaries, so it can quickly adapt to the changes in business models brought about by covid-19 [15].
Currently, as Covid-19's influence on the world is waning, almost all stores have resumed business. Flexible online models such as drive-thru and curbside pickup have been able to parallel well with offline store models. Plus, Starbucks insisted on growing its size. Interim CEO Howard says Starbucks aims to have 45,000 stores worldwide by the end of 2025.
4. Financial Analysis of Starbucks
4.1 Ratio Analysis on the Operation Level
Liquidity Index. Figure 1 shows the Starbucks current ratio and quick ratio every six months for the past five years, both of which are liquidity indicators. The ability of a business to pay its short-term debts is assessed using the current ratio, which is determined from current assets/current liabilities. It can be seen from the figure that after rising to the highest point of 2.2 in September 2018, it began to decline sharply, and dropped to the lowest point of 0.7 in March 2020, and then rebounded, but did not return to the highest point level, and In 2022 there will be a small volatility drop. Due to the fact that it solely takes into account a company's more liquid fast assets, the quick ratio is a more sensible indicator of its short-term solvency, which include cash and its equivalents, accounts receivable, and marketable securities. The trend of Starbucks' quick ratio in the past five years is almost exactly the same as that of the current ratio. They all fell sharply after reaching the highest point of 1.95 in September 2019, and fell to the lowest point of 0.52 in March 2020. After that, it rebounded, but in 2021 Then it dropped slightly. This means that the liquidity of Starbucks has deteriorated rapidly since 2019. From the comparison of Starbucks' annual report, it can be seen that in 2019, among Starbucks' assets, the current assets decreased by one-half. Cash and its equivalents have decreased significantly from 8,756,300 in 2018 to 2,686,600, and short-term investments have also decreased from 181,500 to 70,500, but current liabilities have increased from 5,684,200 to 6,168,700 [16]. In 2020, due to the negative impact of the pandemic, liquidity has dropped to the lowest point. Liquidity picked up in 2021 but still deteriorated in 2022.
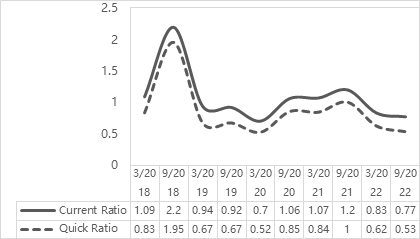
Figure 1: Starbucks’ current ratio and quick ratio in 2018-2022.
Profitability Index. From Figure 2, we can see Starbucks' operating profit margin, pre-tax profit margin and net profit margin in the past five years, which can measure the company's profitability. The ratio of operating profit to net sales is known as the operating margin. The operating profit margin in March 2018 was 0.17, which has been stable, and fell sharply to the lowest point of 0.07 in September 2020. It did not recover to 0.17 until September 2021, but dropped slightly in 2022. Pre-tax profit margin is calculated as EBT/Revenue. Margin before tax was 0.26 in March 2018. The company has declined in 2019, with a profit before tax of 0.15 in March. It then drops sharply to 0.05 in September 2020 before recovering in September 2021, but then fell again in 2022. A company's net profit margin, which measures its revenue-to-profit ratio, has followed a similar trend for Starbucks over the past five years as its pre-tax profit margin. In March 2018, the net profit ratio was the highest at 0.19, and it dropped slightly by March 2019, and dropped sharply to the lowest point of 0.04 in September 2020, until it rebounded in September 2021, but it still declined slightly in 2022. Starbucks' profitability fell slightly in 2019, mainly due to Starbucks' growth in leadership experience, wages, and benefits. Profitability dramatically decreased once more in 2020 as a result of the unfavourable effects of COVID-19. In 2021 and beyond, as the epidemic passes, Starbucks' profitability recovered substantially. Profitability grew further as the Starbucks loyalty program attracted more members due to increased foot traffic. Profitability fluctuated slightly in 2022.
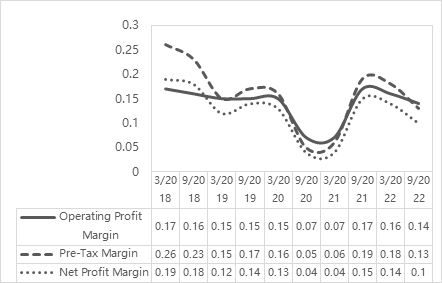
Figure 2: Starbucks’s operating profit margin, pre-tax margin and net profit margin in 2018-2022.
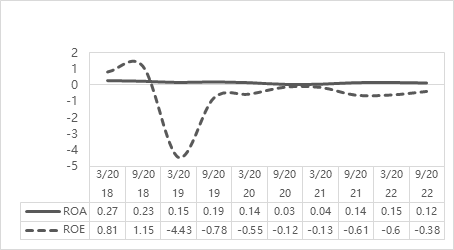
Figure 3: Starbucks’ ROA and ROE in 2018-2022.
Figure 3 shows Starbucks' ROA and ROE ratios over the past five years and also shows the company's profitability. Net income divided by total assets is known as ROA. The semiannual ROA from March 2018 to March 2020 were 0.27, 0.23, 0.15, 0.19, and 0.14. In September 2020, the ROA dropped sharply to 0.03, and did not recover until 2021 to 0.14, after which it remained relatively stable. To determine ROE, divide net income by total equity. Over the past five years, Starbucks' ROE has fluctuated wildly. It was 0.81 in March 2018, and rose to 1.15 in September. In March 2019, the index fell sharply to the lowest point of negative value -4.43, and then recovered. After 2021, there will be a small decline again. In 2019, the ROE plummeted to a negative number. In that year, Starbucks spent huge sums of money to repurchase shares, spending more than income, resulting in negative retained earnings and shareholder equity. Although the ROE has rebounded since then, it has maintained a negative value. It may be that Starbucks is insisting on a large amount of leverage, resulting in assets less than liabilities, resulting in negative shareholders' equity.
4.2 Ratio Analysis on the Financial Leverage Level
Figure 4 shows the debt/assets and debt/equity ratios of Starbucks in the past five years. Debt/assets is the total debt of the company divided by the total assets that can measure how much of the company's assets were purchased using borrowed funds. In the past five years, the D/A ratios of Starbucks were 0.39, 0.58, 0.86, 0.75, and 0.85 respectively, showing a slight upward trend overall. It means that the proportion of assets acquired through liabilities in Starbucks' total assets was increasing. Debt/equity is debt divided by equity, indicating how much debt the company needs to finance its operations. In 2018-2022, Starbucks' D/E ratios are 1.31, -1.82, -1.55, -1.91 and -1.6. This also shows that since 2019, Starbucks' shareholders' equity has been negative, and the company's liabilities exceed its assets. At the same time, in terms of absolute value, the D/E ratio has generally increased from 2018 to 2021, indicating that the capital structure of the company now has a greater percentage of liabilities.
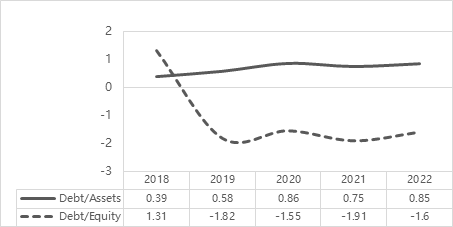
Figure 4: Starbucks’s debt/assets ratio and debt/equity ratio in 2018-2022.
4.3 Ratio Analysis on the Stock Market Level
From figure5, the P/E and EV/EBITDA ratios of Starbucks can be seen. P/E ratio, or price-earnings ratio, can be used to detect whether a stock is overvalued or undervalued. The P/E ratio of Starbucks in the past five years is 17.2, 28.9, 110, 31.9, and 29.8. It can be seen that it has reached a very exaggerated peak in 2020, which means that investors have to pay $110 to get a dollar of income. It also indicates that Starbucks' stock is seriously overvalued in 2020 and will not be favored by investors. EV/EBITDA is the company's market value divided by EBITDA, which is often used to judge the valuation of enterprises. The EV/EBITDA of Starbucks in the past five years is 13.2, 19.1, 33.7, 21.7 and 17.7. It can also be seen that it began to rise in 2018, reached its peak in 2020, and then declined year by year. That said Starbucks may have gone through a period of overvaluation in 2020.
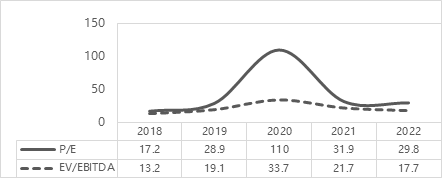
Figure 5: Starbucks’ P/E and EV/EBITDA ratios in 2018-2022.
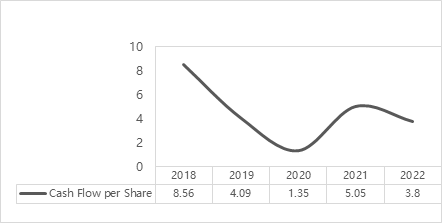
Figure6: Starbucks’ cash flow per share in 2018-2022.
Figure 6 shows the cash flow per share of Starbucks in the past five years, which can show the company's ability to engage in capital expenditures and pay dividends. This means that the maximum amount of cash dividends that Starbucks can distribute to shareholders from 2018 to 2020 is declining. Although it has rebounded in 2021, it declined again in 2022.
5. Conclusion
Starbucks' business model has many advantages. High-quality partners can provide continuous support. A clear value positioning helps the company have a clear goal. A variety of customer segments help the brand to target different groups of people marketing. Innovative special programs and customer service can also maintain a solid customer relationship. There is no doubt that these have helped Starbucks become a leader in the industry. It can also be seen from the relevant ratios in and before 2019 that Starbucks has a very good and healthy performance in terms of liquidity, profitability, stock and corporate valuation. From the various ratios in 2020, it can be seen that covid-19 has brought negative impacts on all aspects of Starbucks, but Starbucks changed its strategy in a timely manner, actively developed online takeaway, drive-thru and other services, and was able to turn the crisis into safety. It can also be seen that the liquidity, profitability and valuation ratio will gradually pick up in the next year and later. At the same time, because of Starbucks' vigorous development of online services during the epidemic, they have stronger business capabilities than before when they resume offline business today. However, since 2019, Starbucks' shareholders' equity has been negative, indicating that liabilities are greater than assets. This may be why Starbucks has been insisting on expansion and increasing leverage. However, long-term negative shareholder returns are a dangerous signal for shareholders, so Starbucks should appropriately reduce bond issuance and optimize capital structure.
References
[1]. HSPH.: Coffee by the Numbers. Harvard School of Public Health [Online] (2014). http://www.hsph.harvard.edu/news/multimedia-article/facts/
[2]. ONE.STARBUCKS.: The world’s most admired for more than two decades (2023). https://one.starbucks.com/get-the-facts/starbucks-named-worlds-most-admired/,last accessed:14/04/2023
[3]. Michael B.: WHAT IS BUSINESS STRATEGY & WHY IS IT IMPORTANT?. Harvard Business School Online (2022).
[4]. Walsh, C.: Key management ratios. Harlow: Published by Prentice Hall Financial Times (2003).
[5]. Sergejs Hilkevics, Valentina Semakina.: The classification and comparison of business ratios analysis methods. Insights into Regional Development 1(1), 47-56 (2019).
[6]. Zorn, Alexander, Michele Esteves, Ivo Baur, and Markus Lips.: Financial Ratios as Indicators of Economic Sustainability: A Quantitative Analysis for Swiss Dairy Farms. Sustainability, 10 (8), 2942 (2018).
[7]. Worldometers. COVID-19 Coronavirus Pandemic. (2023) https://www.worldometers.info/coronavirus/ , last accessed: 8/04/2023
[8]. Turgay Bucak, Serkan Yiğit.: The future of the chef occupation and the food and beverage sector after the COVID-19 outbreak: Opinions of Turkish chefs”,International Journal of Hospitality Management 92, 102682, ISSN 0278-4319 (2021) .
[9]. Daniel P.: Starbucks Business Model (2023). https://businessmodelanalyst.com/starbucks-business-model/#Starbucks%E2%80%99_Ke Activities , last accessed:13/04/2023
[10]. Lombardi, C. V., Chidiac, N. T., Record, B. C.: Starbucks coffee corporation’s marketing response to the COVID-19 pandemic. Innovative Marketing 17(2), 177(2021)
[11]. Rafii, L.: The Starbucks or McCafé Crowd: Who Counts More Politically? (2014). https://www.huffpost.com/entry/the-starbucks-or-mccafe-c_b_4262104, last accessed:14/04/2023
[12]. Lepore, M.: 15 Facts About Starbucks That WillBlow Your Mind. Insider (2011). https://www.businessinsider.com/15-facts-aboutstarbucks-that-will-blow-yourmind-2011-3
[13]. Starbucks. Annual Report.(2022). https://s22.q4cdn.com/869488222/files/doc_financials/2023/ar/Starbucks-FY22-Annual-Report.pdf , last accessed:15/04/2023
[14]. Heidi P.: At a glance: What you need to know about Starbucks response to COVID-19(2022). https://stories.starbucks.com/press/2022/what-customers-need-to-know-about-starbucks-response-to-covid-19/ , last accessed:14/04/2023
[15]. Chris W.: 3 Ways Starbucks Will Emerge From COVID-19 Stronger Than Before (2020). https://www.forbes.com/sites/christopherwalton/2020/04/03/3-ways-starbucks-will-emerge-from-covid-19-stronger-than-before/?sh=313bf5a11844
[16]. Starbucks. Annual Report (2019). https://s22.q4cdn.com/869488222/files/doc_financials/2023/ar/Starbucks-FY22-Annual-Report.pdf , last accessed:20/04/2023
Cite this article
Zhang,Y. (2023). The Performance Research of Starbucks in the Past Five Years Applying Business Strategy Analysis and Ratio Analysis. Advances in Economics, Management and Political Sciences,34,59-66.
Data availability
The datasets used and/or analyzed during the current study will be available from the authors upon reasonable request.
Disclaimer/Publisher's Note
The statements, opinions and data contained in all publications are solely those of the individual author(s) and contributor(s) and not of EWA Publishing and/or the editor(s). EWA Publishing and/or the editor(s) disclaim responsibility for any injury to people or property resulting from any ideas, methods, instructions or products referred to in the content.
About volume
Volume title: Proceedings of the 7th International Conference on Economic Management and Green Development
© 2024 by the author(s). Licensee EWA Publishing, Oxford, UK. This article is an open access article distributed under the terms and
conditions of the Creative Commons Attribution (CC BY) license. Authors who
publish this series agree to the following terms:
1. Authors retain copyright and grant the series right of first publication with the work simultaneously licensed under a Creative Commons
Attribution License that allows others to share the work with an acknowledgment of the work's authorship and initial publication in this
series.
2. Authors are able to enter into separate, additional contractual arrangements for the non-exclusive distribution of the series's published
version of the work (e.g., post it to an institutional repository or publish it in a book), with an acknowledgment of its initial
publication in this series.
3. Authors are permitted and encouraged to post their work online (e.g., in institutional repositories or on their website) prior to and
during the submission process, as it can lead to productive exchanges, as well as earlier and greater citation of published work (See
Open access policy for details).
References
[1]. HSPH.: Coffee by the Numbers. Harvard School of Public Health [Online] (2014). http://www.hsph.harvard.edu/news/multimedia-article/facts/
[2]. ONE.STARBUCKS.: The world’s most admired for more than two decades (2023). https://one.starbucks.com/get-the-facts/starbucks-named-worlds-most-admired/,last accessed:14/04/2023
[3]. Michael B.: WHAT IS BUSINESS STRATEGY & WHY IS IT IMPORTANT?. Harvard Business School Online (2022).
[4]. Walsh, C.: Key management ratios. Harlow: Published by Prentice Hall Financial Times (2003).
[5]. Sergejs Hilkevics, Valentina Semakina.: The classification and comparison of business ratios analysis methods. Insights into Regional Development 1(1), 47-56 (2019).
[6]. Zorn, Alexander, Michele Esteves, Ivo Baur, and Markus Lips.: Financial Ratios as Indicators of Economic Sustainability: A Quantitative Analysis for Swiss Dairy Farms. Sustainability, 10 (8), 2942 (2018).
[7]. Worldometers. COVID-19 Coronavirus Pandemic. (2023) https://www.worldometers.info/coronavirus/ , last accessed: 8/04/2023
[8]. Turgay Bucak, Serkan Yiğit.: The future of the chef occupation and the food and beverage sector after the COVID-19 outbreak: Opinions of Turkish chefs”,International Journal of Hospitality Management 92, 102682, ISSN 0278-4319 (2021) .
[9]. Daniel P.: Starbucks Business Model (2023). https://businessmodelanalyst.com/starbucks-business-model/#Starbucks%E2%80%99_Ke Activities , last accessed:13/04/2023
[10]. Lombardi, C. V., Chidiac, N. T., Record, B. C.: Starbucks coffee corporation’s marketing response to the COVID-19 pandemic. Innovative Marketing 17(2), 177(2021)
[11]. Rafii, L.: The Starbucks or McCafé Crowd: Who Counts More Politically? (2014). https://www.huffpost.com/entry/the-starbucks-or-mccafe-c_b_4262104, last accessed:14/04/2023
[12]. Lepore, M.: 15 Facts About Starbucks That WillBlow Your Mind. Insider (2011). https://www.businessinsider.com/15-facts-aboutstarbucks-that-will-blow-yourmind-2011-3
[13]. Starbucks. Annual Report.(2022). https://s22.q4cdn.com/869488222/files/doc_financials/2023/ar/Starbucks-FY22-Annual-Report.pdf , last accessed:15/04/2023
[14]. Heidi P.: At a glance: What you need to know about Starbucks response to COVID-19(2022). https://stories.starbucks.com/press/2022/what-customers-need-to-know-about-starbucks-response-to-covid-19/ , last accessed:14/04/2023
[15]. Chris W.: 3 Ways Starbucks Will Emerge From COVID-19 Stronger Than Before (2020). https://www.forbes.com/sites/christopherwalton/2020/04/03/3-ways-starbucks-will-emerge-from-covid-19-stronger-than-before/?sh=313bf5a11844
[16]. Starbucks. Annual Report (2019). https://s22.q4cdn.com/869488222/files/doc_financials/2023/ar/Starbucks-FY22-Annual-Report.pdf , last accessed:20/04/2023