


1. Introduction
As a result of inadequate financial resources, investors tend to have a low tolerance for risk and are strongly averse to losses. For the purpose, the importance of portfolio construction cannot be overstated, as it is the foundation upon which an investor’s financial success is built. Proper portfolio construction entails the selection of appropriate asset classes, allocation of assets within those classes [1-5].
In recent years, AI has emerged as a highly promising industry with broad applications in finance. AI-based approaches are well suited to capturing complex patterns in large datasets and can offer a more robust and accurate means of predicting asset performance and optimizing allocation than traditional methods. At the same time, the employment of AI enables investors to intimately associate AI’s applications in predicting investment returns and volatility, for AI is ultimately able to forecast and display the desired outcomes by means of continuous learning and advancement. Concurrently, the utilization of AI is analogous to that of advanced predictive models and machine learning methods in investment portfolio applications. Numerous studies have examined the use of neural networks, decision trees, and other techniques for predicting portfolio performance and optimizing asset allocation. For example, a study by Liu conducted a deep learning neural network and found the model outperformed traditional methods such as linear regression and random forest in terms of portfolio returns prediction [6]. Decision trees enable the examination of intricate data collections and the recognition of essential elements that affect investment results. Birbil, Frenk, & Gürkan in the study successfully applied to a variety of asset classes and can be adapted to different investment horizons and risk preferences [7]. In addition, each algorithm for predicting portfolio performance had varying levels of success in predicting returns. And a combination of several algorithms (support vector machines, random forests, and neural networks) may be the most beneficial in accurately forecasting future portfolio performance [8]. The potential for machine learning to revolutionize investment management and improve portfolio returns over traditional methods is phenomenon. However, an acknowledged drawback of these systems is that they are highly responsive to modifications in the inputs, leading to unstable or perplexing outcomes. This flaw can be efficiently handled by utilizing appropriate machine learning methods, which are adept at forecasting future surplus returns. In this context, this paper proposes to apply LSTM networks to the construction of investment portfolios in the AI market. By leveraging the powerful predictive capabilities of LSTMs and the larger datasets and complex interdependencies present in AI, it is believed that this approach holds great promise for improved investment returns and risk management.
The empirical process in this paper can be summarized as follow. Firstly, the paper selected five major companies from the AI industry, namely Microsoft, Google, Amazon, IBM, and NVIDIA, and collected their closing prices between January 1st, 2012, and May 1st, 2022. Secondly, the paper performed data cleaning to ensure that the financial time series were synchronized. Thirdly, it employed the LSTM model to forecast the selected time series, and the results demonstrated that the LSTM model was effective in predicting the financial time series. Subsequently, the portfolios consist of the chosen securities are created, and based on the maximum sharpe ratio and minimum volatility portfolios, discovered that NVIDIA had the highest weightage in maximum sharpe ratio portfolio, and IBM had the largest share in minimum volatility portfolio. Ultimately, the paper compared the performance of LSTM-based portfolio and the market index and concluded that the LSTM approach was superior.
2. Methodology
2.1. LSTM
Initially introduced by Schmidhuber, LSTM have been effectively employed in a variety of applications such as natural language processing, speech recognition and images classification [9]. As a type of recurrent neural network (RNN) enhancement model, LSTM assists capture the temporal dependencies and long-range correlations of time series data, which are often essential for financial forecasting. Besides, LSTM is well-known for its ability to handle vanishing gradients and exploding gradients problems, which can occur in traditional RNN and lead to unstable training.
In the research, it explores the computational framework of forecasting stock index prices using the time series augmented neural network LSTM model. The schematic provided in the Figure 1 demonstrates the proposed research framework. Initially, incorporating with fundamental, macroeconomic, and technological data. Then, the LSTM model is configured to take in a sequence of data points as input and predict the future stock price as output. In this step, the data is standardized to ensure the values of the variables are within the common scale. And homogenous group of data can be classified with more accuracy. After that, feature selection is applied, mainly based on embedded method. The study is capable of filtering unnecessary variables and data by including regularization penalty on volatility of the return. The step is to provide more accurate and efficient prediction result. Subsequently, The LSTM network architecture is designed, which typically includes several layers of LSTM cells with varying numbers of hidden units. The model employs hyperparameters such as the number of neurons, period, learning rate, batch size, and time step. In forward pass, the input sequence is fed into the LSTM network in a forward pass, which means the network processes one data point at a time and updates its internal states and outputs. In backward pass, the output of the LSTM network is compared to the actual stock price, and the error is propagated back through the network via backpropagation. The weights of the network are then updated based on the calculated error. Afterwards, the LSTM model forecasts the closing price of the chosen five stocks. Finally, the RMSE, R square statistics and more cutoffs are used to evaluate the model's overall performance.
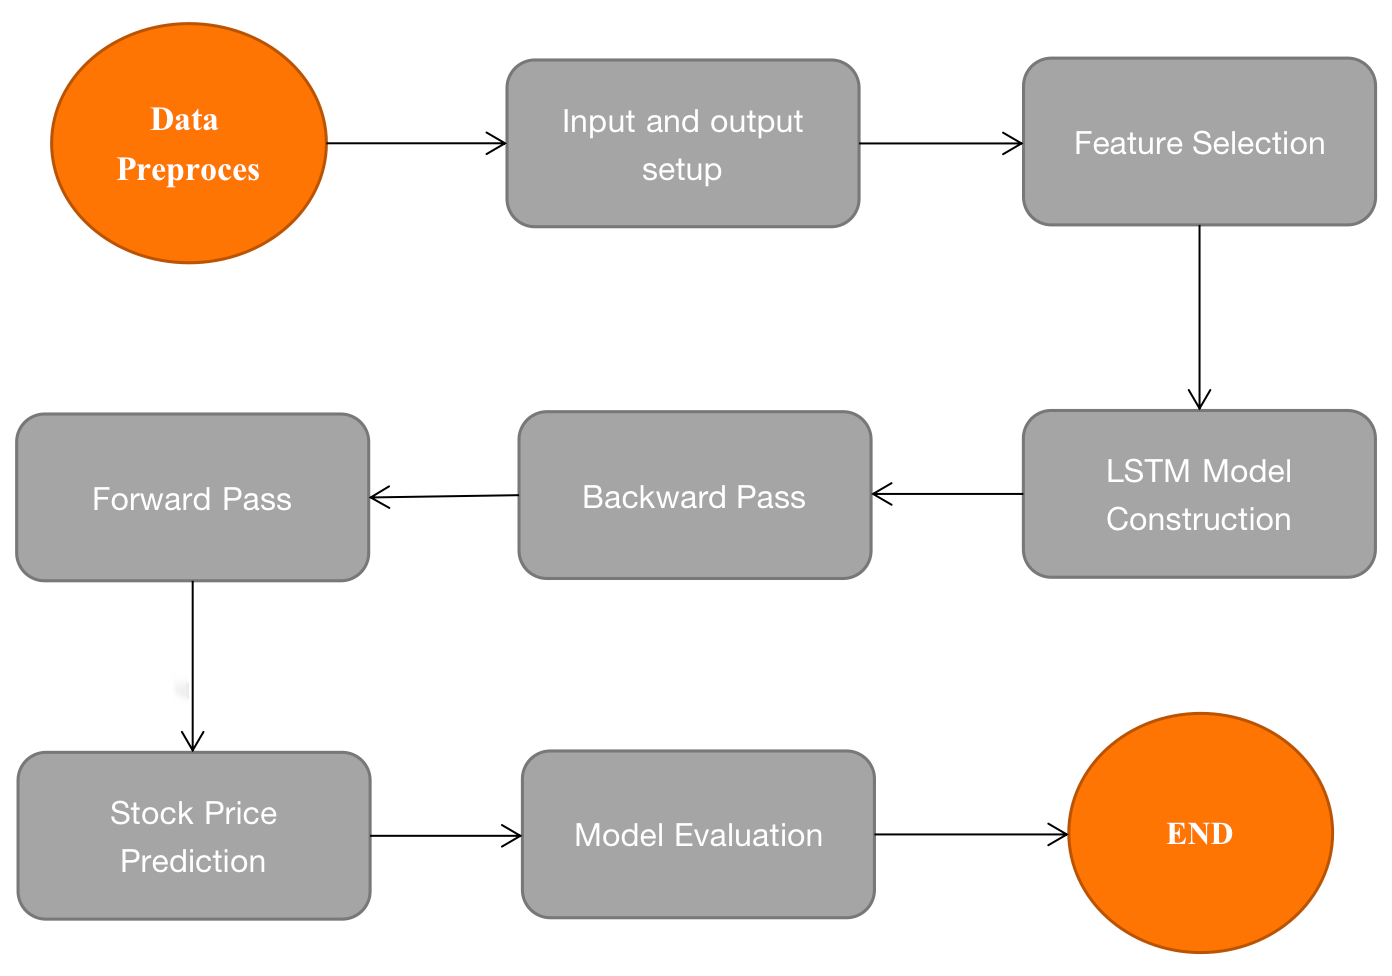
Figure 1: Flow chart.
2.2. Mean-Variance-Model
The mean-variance model is based on the assumption that investors seek to maximize their portfolio return while minimizing risk [10]. The model finds the optimal portfolio allocation by balancing the expected return and variance of the portfolio using a set of linear equations.
To implement the mean-variance model, this study collects historical return and volatility data of the selected assets over a specific time period. Then, the expected returns and covariances among the assets are estimated using statistical techniques based on the historical data. The mean-variance model then solves for the portfolio weights for each asset that will maximize the portfolio's expected return subject to a specified level of risk. To evaluate the performance of the mean-variance model, this study uses two commonly used performance metrics: the Sharpe ratio and the Sortino ratio. The Sharpe ratio expresses the amount of excess return per unit of risk and is often used to compare the performance of investments with similar risk levels. The higher the Sharpe ratio, the better the investment opportunity is considered to be.
\( Sharpe Ratio = \frac{E[{R_{p}}]-{r_{f}}}{SD({R_{p}})} \) (1)
Where:
\( E[{R_{p}}] \) = expected return of the portfolio = \( \sum Asset Weight * Asset Return \) (2)
\( {r_{f}} \) = risk-free rate
\( E[{R_{p}}] \) - \( {r_{f}} \) = risk premium
\( SD({R_{p}}) \) = standard deviation of the expected return of the portfolio
3. Data
The datasets were obtained from Yahoo Finance (https://finance.yahoo.com/). The dataset consists of 2599 records for each company spanning from 2012-01-01 to 2022-05-01 and comprises six columns labelled High, Low, Open, Close, Volume, and Adj Close. Based on how well the company make use of artificial intelligence, the study chose the top 5 companies whose artificial intelligence technology is the best and most efficient. They are NVIDIA, Google, Amazon, Microsoft and IBM. In order to do additional research, datatypes, missing values, and a great many other insights into the dataset and its properties will be retrieved. After then, the descriptive summary statistics will be illustrated below in Table 1.
Table 1: Summary statistics.
Amazon | IBM | NVIDIA | Microsoft | ||
Mean | 75.77 | 61.17 | 112.67 | 69.48 | 122.32 |
std | 52.54 | 35.06 | 11.41 | 76.7 | 91.63 |
Max | 186.57 | 150.71 | 146.74 | 333.35 | 338.33 |
Min | 12.41 | 19.07 | 76.9 | 2.82 | 23.63 |
It is of note that solely IBM and Microsoft exhibited daily compounded returns of over 100, whereas the remaining entities yielded returns below 76. A cursory examination of the summary statistics indicates that IBM's asset returns possessed the least amount of variance on a standardized basis, whereas Microsoft's returns had the greatest degree of variability. Nevertheless, when observing the maximum returns, Microsoft boasted a value of 338.33, whereas IBM's highest return was 146.74. Regarding the minimum returns, NVIDIA acquired the least, while IBM garnered the most.
4. Results
4.1. Prediction Results
The research incorporated multiple layers consisting of sequential, dense, and LSTM units, with the latter being utilized more than once within the network. The proficiency of the prognostications on the test set was quantified by utilizing the Mean Square Error (MSE) and R-squared. The outcome of the MSE was recorded as 13.67, while the algorithm produced an R-square of 0.74. The following Figure 2 shows the prediction results on NVIDIA as an example.
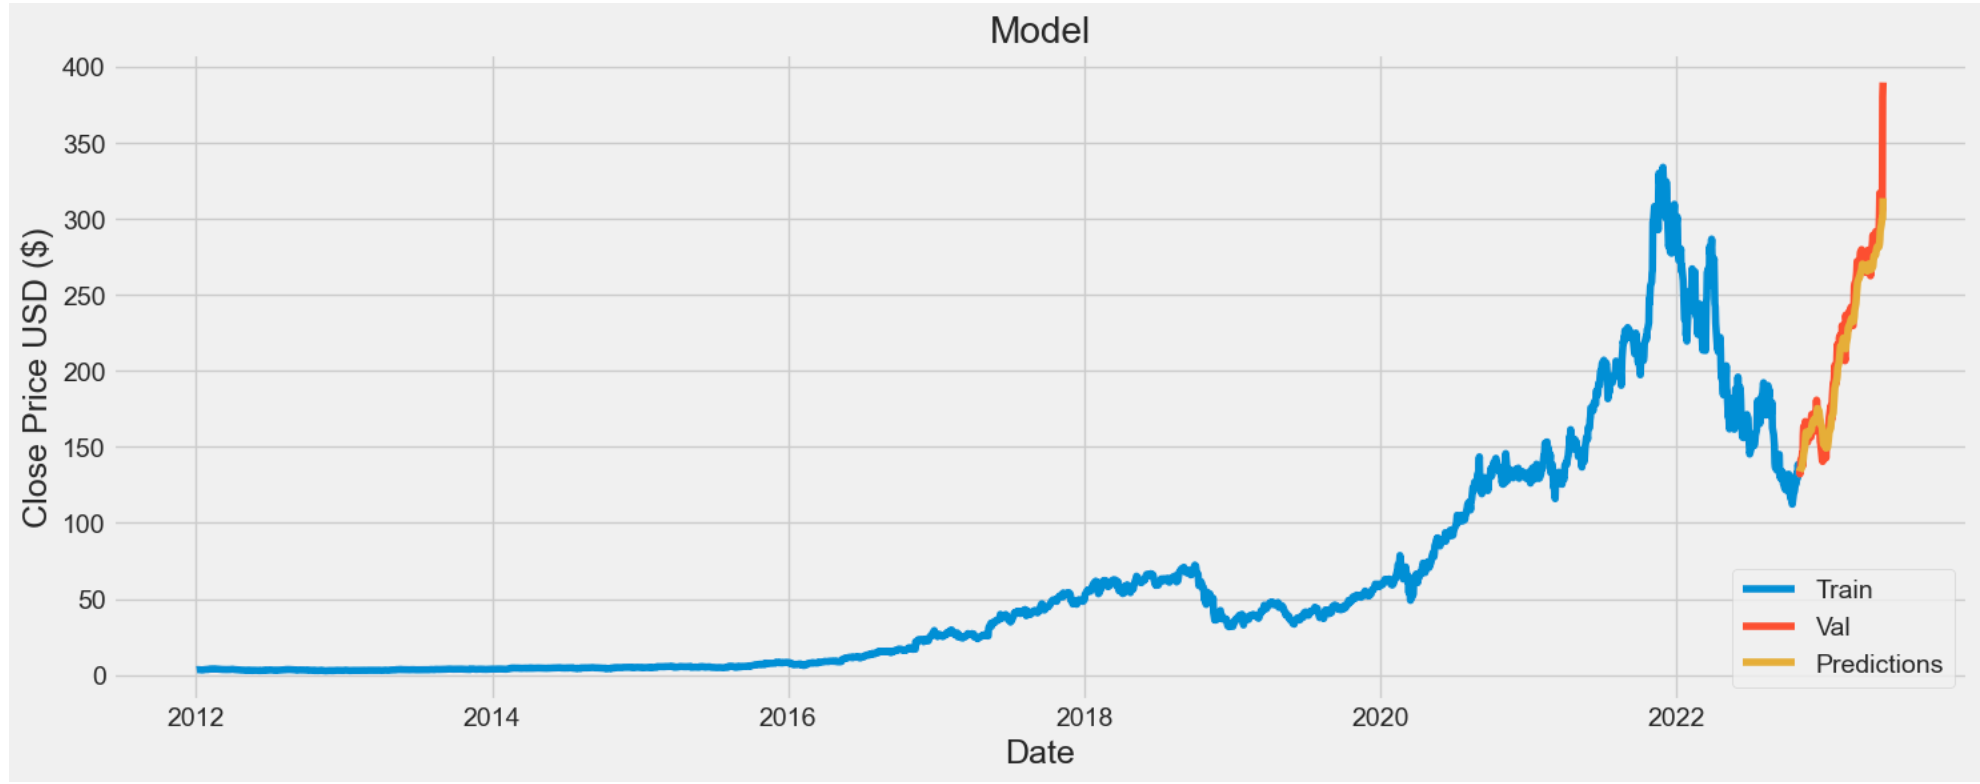
Figure 2: Prediction based on LSTM of NVIDIA.
Figure 2 demonstrates the closing price for NVIDIA stock based on LSTM model. It is forecasted that the closing price will be expecting dramatic rises after May 2022.
4.2. Portfolio Optimization
Table 2 illustrates the co-variation between the stocks of Amazon, Google, IBM, NVIDIA, and Microsoft, with NVIDIA exhibiting the most significant volatility at 0.202521 and IBM displaying the least at 0.554515. Amazon-NVIDIA demonstrates the highest covariance, while Google-IBM shows the lowest covariance.
Table 2: Covariance matrix for chosen assets.
Amazon | IBM | NVIDIA | Microsoft | ||
Amazon | 0.1080 | 0.0582 | 0.0227 | 0.0749 | 0.0544 |
0.0582 | 0.0763 | 0.0262 | 0.0677 | 0.0529 | |
IBM | 0.0227 | 0.0262 | 0.0554 | 0.0347 | 0.0287 |
NVIDIA | 0.0749 | 0.0677 | 0.0347 | 0.2025 | 0.0732 |
Microsoft | 0.0543 | 0.0529 | 0.0287 | 0.0732 | 0.0749 |
The maximize sharpe ratio portfolio and the minimum variance portfolio are shown in the following Table 3.
Table 3: Maximum sharpe ratio and minimum volatility portfolio.
Amazon | IBM | NVIDIA | Microsoft | ||
Maximum Sharpe Ratio | 0 | 0 | 0 | 61.9483% | 38.0517% |
Minimum Volatility | 5.89% | 8.67% | 42.49% | 18.63% | 24.32% |
Table 3 highlights that the portfolio with the highest Sharpe Ratio is primarily comprised of NVIDIA (61.9483%) and Microsoft (38.0517%). Conversely, the portfolio with the lowest volatility is primarily composed of IBM (42.49%), NVIDIA (18.63%) and Microsoft (24.32%). This is due to NVIDIA's high volatility and reasonably high expected return. The Sharpe Ratio serves as an important tool for investors to evaluate investment options, as it represents the slope of the capital market line. In this regard, investors tend to opt for the highest Sharpe Ratio portfolio options on the capital market line, to achieve an efficient equilibrium by combining risky assets with the risk-free rate (See Figure 3 and Figure 4).
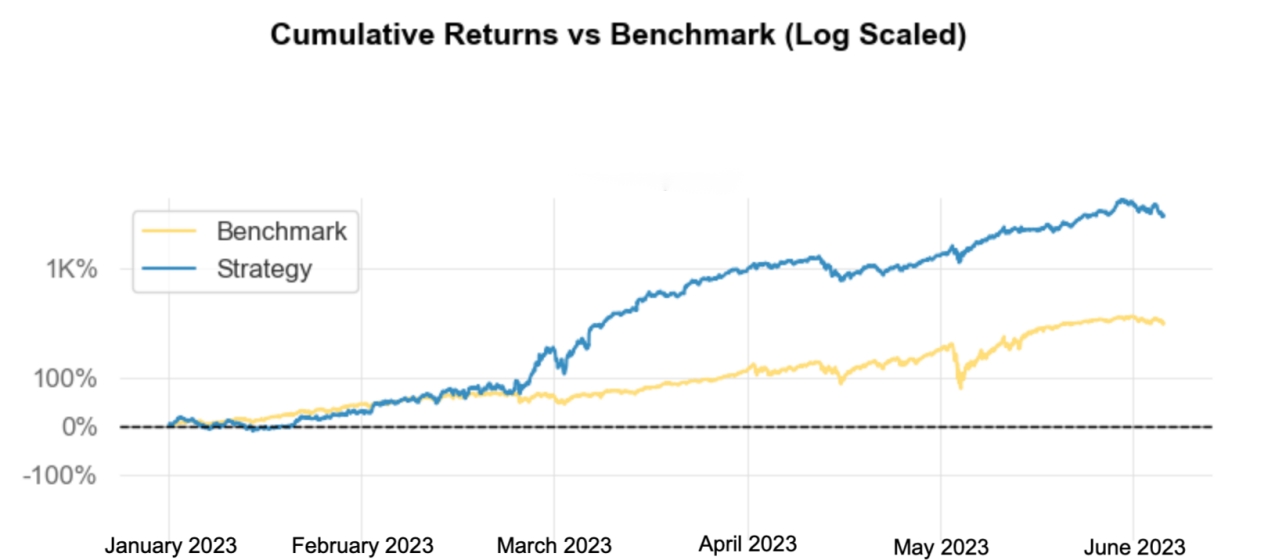
Figure 3: Comparison between maximum sharpe ratio portfolio and the market index.
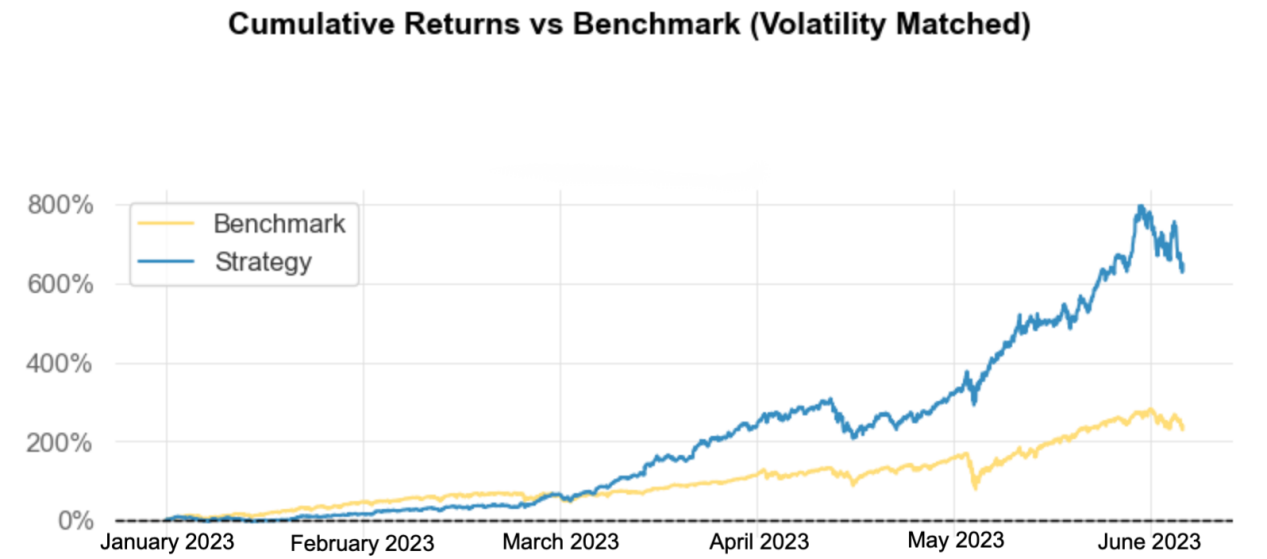
Figure 4: Comparison between minimum volatility portfolio and the market index.
Figure 3 shows the predictive log cumulative returns of maximized sharpe ratio portfolio from January 2023 to June 2023. Figure 4 shows the forecasted cumulative returns of minimized volatility portfolio from January 2023 to June 2023. Blue line ‘Strategy’ indicates the constructed portfolio for each scenario, while yellow line ‘Benchmark’ indicates the market performance (SP500).
5. Conclusion
This study centers on conducting a portfolio analysis of Artificial Intelligence based companies, in order to provide beneficial guidance to potential investors when making investment decisions. Specifically, this paper introduces LSTM to portfolio optimization. The detailed results are summarized as follows. First, LSTM model is well applied for predicting future returns of the financial assets, and the paper showed NVIDIA as an example that the closing price increase during 2023. Second, it is reported that NVIDIA has about 62% in maximum sharpe ratio portfolio, while IBM has the largest share in minimum volatility portfolio (42.49%). Third, two constructed portfolios (max sharpe and min volatility) all outperformed the market index (SP500).
However, potential deficiencies exist. For example, the family for LSTM contains several model specifications, in this paper, the basic LSTM is adopted. Comparing different LSTM-based models may be comprehensively researched in the future.
References
[1]. Barberis, N., Thaler, R.: A survey of behavioral finance. Handbook of the Economics of Finance 1B, 1053-1128 (2003).
[2]. Lu, Z., Liang, M.: Integrated intellectual investment portfolio as an efficient instrument to manage personal financial investment. Journal of Business Research 96, 165-175 (2019).
[3]. Omisore, I., Yusuf, M., Christopher, N.: The modern portfolio theory as an investment decision tool. Journal of Accounting and Taxation 4(2), 19-28 (2012).
[4]. Smith, J.: Organizing Information: A Key Obstacle When Building an Investment Portfolio. Journal of Finance and Investment Analysis 10(2), 75-85 (2021).
[5]. Mustafa, M., Thomas, D., John, B.: The Construction of Efficient Portfolios: A Verification of Risk Models for Investment Making. The Journal of Finance and Data Science 6, 272-288 (2020).
[6]. Wang, W., Li, W., Zhang, N. Liu, K.: Portfolio formation with preselection using deep learning from long-term financial data. Expert Systems with Applications 143. 113042 (2019).
[7]. Birbil, Ş. İ., Frenk, J. B., Gürkan, G.: Asset allocation via decision trees. European Journal of Operational Research 180(1), 246-258 (2007).
[8]. Wu, Y., Wang, J., Liu, H.: Predicting portfolio performance by machine learning: Evidence from China. Asia-Pacific Journal of Financial Studies 49(1), 48-68 (2020).
[9]. Hochreiter, S., Schmidhuber, J.: Long short-term memory. Neural computation 9(8), 1735-1780 (1997).
[10]. Markowitz, H.: Portfolio selection. The Journal of Finance 7(1), 77-91 (1952).
Cite this article
Jiang,X. (2023). LSTM Prediction and Portfolio Optimization for Artificial Intelligence Industry. Advances in Economics, Management and Political Sciences,38,192-197.
Data availability
The datasets used and/or analyzed during the current study will be available from the authors upon reasonable request.
Disclaimer/Publisher's Note
The statements, opinions and data contained in all publications are solely those of the individual author(s) and contributor(s) and not of EWA Publishing and/or the editor(s). EWA Publishing and/or the editor(s) disclaim responsibility for any injury to people or property resulting from any ideas, methods, instructions or products referred to in the content.
About volume
Volume title: Proceedings of the 7th International Conference on Economic Management and Green Development
© 2024 by the author(s). Licensee EWA Publishing, Oxford, UK. This article is an open access article distributed under the terms and
conditions of the Creative Commons Attribution (CC BY) license. Authors who
publish this series agree to the following terms:
1. Authors retain copyright and grant the series right of first publication with the work simultaneously licensed under a Creative Commons
Attribution License that allows others to share the work with an acknowledgment of the work's authorship and initial publication in this
series.
2. Authors are able to enter into separate, additional contractual arrangements for the non-exclusive distribution of the series's published
version of the work (e.g., post it to an institutional repository or publish it in a book), with an acknowledgment of its initial
publication in this series.
3. Authors are permitted and encouraged to post their work online (e.g., in institutional repositories or on their website) prior to and
during the submission process, as it can lead to productive exchanges, as well as earlier and greater citation of published work (See
Open access policy for details).
References
[1]. Barberis, N., Thaler, R.: A survey of behavioral finance. Handbook of the Economics of Finance 1B, 1053-1128 (2003).
[2]. Lu, Z., Liang, M.: Integrated intellectual investment portfolio as an efficient instrument to manage personal financial investment. Journal of Business Research 96, 165-175 (2019).
[3]. Omisore, I., Yusuf, M., Christopher, N.: The modern portfolio theory as an investment decision tool. Journal of Accounting and Taxation 4(2), 19-28 (2012).
[4]. Smith, J.: Organizing Information: A Key Obstacle When Building an Investment Portfolio. Journal of Finance and Investment Analysis 10(2), 75-85 (2021).
[5]. Mustafa, M., Thomas, D., John, B.: The Construction of Efficient Portfolios: A Verification of Risk Models for Investment Making. The Journal of Finance and Data Science 6, 272-288 (2020).
[6]. Wang, W., Li, W., Zhang, N. Liu, K.: Portfolio formation with preselection using deep learning from long-term financial data. Expert Systems with Applications 143. 113042 (2019).
[7]. Birbil, Ş. İ., Frenk, J. B., Gürkan, G.: Asset allocation via decision trees. European Journal of Operational Research 180(1), 246-258 (2007).
[8]. Wu, Y., Wang, J., Liu, H.: Predicting portfolio performance by machine learning: Evidence from China. Asia-Pacific Journal of Financial Studies 49(1), 48-68 (2020).
[9]. Hochreiter, S., Schmidhuber, J.: Long short-term memory. Neural computation 9(8), 1735-1780 (1997).
[10]. Markowitz, H.: Portfolio selection. The Journal of Finance 7(1), 77-91 (1952).