


1. Introduction
The Chinese stock market, being one of the largest in the world, has garnered significant attention from experts due to the frequent occurrence of sector rotation phenomenon. Sector rotation refers to the dynamic changes in relative strength or weakness observed among different industries and sectors at different times. Accurately predicting sector rotation trends is crucial for making informed investment decisions. Thus, this paper focuses on detecting and predicting the A-share market sector rotation problem using machine learning and deep learning methods.
In their seminal work, Narasimhan Jegadeesh and Sheridan Titman [1] examined the returns obtained over a one-year period by comparing historically well-performing stocks with historically underperforming stocks. They concluded that price transmission between sectors does not significantly impact strategy returns. Similarly, Lee and Swaminthan [2] argue that industry effects generally do not explain stock price behavior in developed stock markets, and the main reason may be that developed stock markets are already semi-strong or weakly efficient markets with weak correlations between stock prices. However, in a more realistic setting, this outperformance quickly dissipates, leading to the suggestion that the sector rotation phenomenon may not exist. Bradley T. Ewing [3] examines the stock price rotation effect of different industry segments in the U.S. stock market. This includes analyzing the indexes of Capital Goods, Financials, Industrials, Transportation and Utilities in the U.S. Standard & Poor's Index using the ANOVA method, and ultimately found that there is a significant sectoral rotation effect among different sectors. Subsequently, scholars such as Mateus et al. [4] argued against this notion. They employed alpha analysis within the FAMA-French five-factor model to study the risk performance and sector rotation strategies of U.S. sector rotation portfolios, revealing significant alpha returns.
In the Chinese A-share securities market, Chinese scholars have reached a consensus on the existence of sector rotation. In 2020, ZHANG Xin [5] divides the study period from 2008 to 2018 into nine stages, and selects Shenyin Wanguo's primary industry-related indices to use cluster analysis to test the existence of industry sector rotation effect in China's A-share market. This consensus is supported by the influence of macro policies and other factors, which often result in companies within the same industry sector exhibiting similar operating trends. JIN Xiu et al. [6] firstly study inter-industry risk spillovers from the perspective of investors' safe investment transfer behavior, analyze the impact of inter-industry risk spillovers and sector rotation effects on asset allocation, in order to improve investors' returns and effectively avoid extreme risks.
In recent years, the rapid development of artificial intelligence technology has shown promising potential in the field of financial forecasting. Models based on machine learning and deep learning, such as decision trees, random forests, artificial neural networks (ANN), and support vector machines (SVM), have found wide application in financial forecasting (Shuai Wang et al.) [7]. One such model used in this paper is the random forest model, an integrated learning method that combines multiple decision trees to make predictions. It offers advantages in feature selection, handling missing values, and capturing nonlinear relationships, making it suitable for exploring potential factors and features in sector rotation. Furthermore, numerous scholars have found that random forest generally yields high prediction accuracy for stocks. When dealing with time series problems,researchers like Rubio and Alba [8] forecast selected Colombian Shares using a Hybrid ARIMA-SVR Model. However, the long short-term memory network (LSTM) model used by Hansun, S. and Young, J.C [9] and S. Liu et al. [10], a type of deep learning algorithm, presents distinct advantages as a recurrent neural network structure. It can effectively capture the long-term dependencies present in sequential data, making it suitable for predicting time series data. By training on historical stock market data, LSTM models can learn the intricate dynamics of sector rotation patterns and predict future sector performance. Given the time series nature of stock data, which includes nonlinear factors, this study compares and combines the prediction of LSTM model, known for its superior predictive value in time series, with the random forest model, which excels in stock forecasting.
Additionally, this study mainly selects factors for feature selection, including different periods of rates factors. The study covers all sectors composed of A-shares over a 5-year period (2018-2022) using reliable data. It constructs a random forest model to identify key features and elucidate the drivers of sector rotation based on historical sector data and other relevant factors. By comparing the forecasting performance of these two models, the research aims to provide a more accurate forecast and a deeper understanding of the Chinese stock market's sector rotation phenomenon.
The main work of this paper is to collect A-share sector data from the past five years (2018-2022) and establish LSTM and random forest models to predict sector rotation trends. Different debugging methods are employed to enhance the prediction accuracy of the models and improve their forecasting capabilities. The analysis of the prediction results reveals that the LSTM model achieves an accuracy of 88%, while the random forest model achieves 86%. Building upon these results, the paper proposes the bagging algorithm model (more precisely LSTM-RM bagging), which combines the two aforementioned models. As a result, the prediction accuracy is further improved, reaching 89%. Through the insights gained from this study, investors and market regulators can better grasp the dynamics of sector rotation, enabling them to make more informed investment decisions and develop effective regulatory strategies.
The remaining of this paper is organized as follows: Section 2 provides an overview of the data and pre-processing methods utilized in this study. Section 3 presents a comprehensive introduction to the two forecasting models employed, and section 4 presents the experimental results and their analysis. The model improvement of innovative LSTM-RF Bagging model using the bagging algorithm is detailed in Section 5. Eventually, Section 6 discusses and concludes the study.
2. Data Collection and Processing
Data in the paper contain adjusted stock sector percentage of daily increase and decrease of A-share stock market from the period of January 2018 to January 2022 in stock trading day (Including ST, ST* and delisted companies). In order to predict the pattern of stock sector rotation, 19 stock sectors specified by the CSRC (China's Securities Regulatory Commission) were selected for this study, and the specific sector names will be listed in Table 1. All the data is obtained from <https://wind.com.cn> website.
In the data pre-processing stage, because the rise and fall data of stock is in a certain range, and there is no data of different magnitudes, so only clip process is needed, which means the original data is clipped so data greater than 10 is treated as 10, while those less than -10 will be treated as -10.
Table 1: Introduction sectors of CSRC.
Code Name | Sector Name |
A | agriculture, forestry, animal husbandry and fishery |
B | mining |
C | manufacturing |
D | electricity, heat, gas and water production and supply |
E | construction |
F | wholesale and retail trade |
G | transportation, storage and postal services |
H | accommodation and catering |
I | Information transmission, software and information technology services |
J | finance |
K | real estate |
L | leasing and Business Services |
M | Scientific Research and Technical Services |
N | Water, Environment and Public Facilities Management |
O | Residential Services, Repairs and Other Services |
P | Education |
Q | Health and Social Work |
R | Culture, Sports and Entertainment |
S | General |
Simple moving averages allow for a method of calculating sequential averages containing a certain number of terms in sequence based on time series information, item by item, to reflect long-term trends (see Eq1). By calculating the average of each data point and the two data points before and after it, moving averages smooth out short-term fluctuations in the original data series, providing a smoother series so that long-term trends in the data can be more easily observed. Since the LSTM model has a better performance for medium- and long-term prediction, in order to improve its prediction accuracy and increase the interpretability of the results. This paper adds the 5th-order moving average (5 days) of up and down data to the indicator selection to test its effect on accuracy. In addition, because the standard deviation is often used to measure the degree of volatility of the data, this paper uses the 5-day standard deviation of the ups and downs as the third indicator to increase the scope of the model consideration, allowing it to take into account the volatility data of the ups and downs of a certain period.
\( F=\frac{{A_{t}}+{A_{t-1}}+...+{A_{t-n+1}}}{n} \)
Where \( {A_{t}} \) denotes the current data point, data point \( {A_{t-1}} \) denotes the previous data point, and so on. n denotes the window size of the moving average, i.e., the number of data points covered by the calculation of the average.
3. Prediction Models
3.1. Random Forest
Decision tree learning is one of the most popular techniques for classification. Its classification accuracy is comparable with other classification methods, and it is very efficient. It is a tree structure-based supervised learning model that constructs a tree structure by recursively performing feature partitioning for classification and regression tasks. Each decision tree is an independent classifier that progressively traverses the branches of the tree based on the values taken by the features and makes predictions based on the class or predictive values of the leaf nodes. Random Forest is an integrated learning method built on top of Decision Tree to improve prediction performance and generalization by combining multiple decision trees. It constructs multiple training sets by bootstrap sampling of training data and uses each training set to train a decision tree.
In addition, random forests consider only a randomly selected fraction of features when each node is selected to divide the features. This randomness makes each decision tree different and increases the diversity of the whole random forest. In the classification problem, the random forest determines the final prediction class through a voting mechanism. In regression problems, random forests determine the final prediction by taking the average of the predicted values of all decision trees. Random forest has higher accuracy and better generalization ability compared to individual decision trees. By combining the prediction results of multiple decision trees, random forests can reduce the risk of overfitting, improve the robustness of the model, and be applicable to more complex problems and large-scale data sets. According to Jigar P. et al.[11], random forest has outstanding contribution in stock prediction, which is the most accurate among common machine learning. Lili Yin et al.[12] use historical trading data of four companies in the USA stock market, to improve the performance of random forest model in medium-and long-term stock trend prediction. The underlying random forest model is shown in Figure 1.
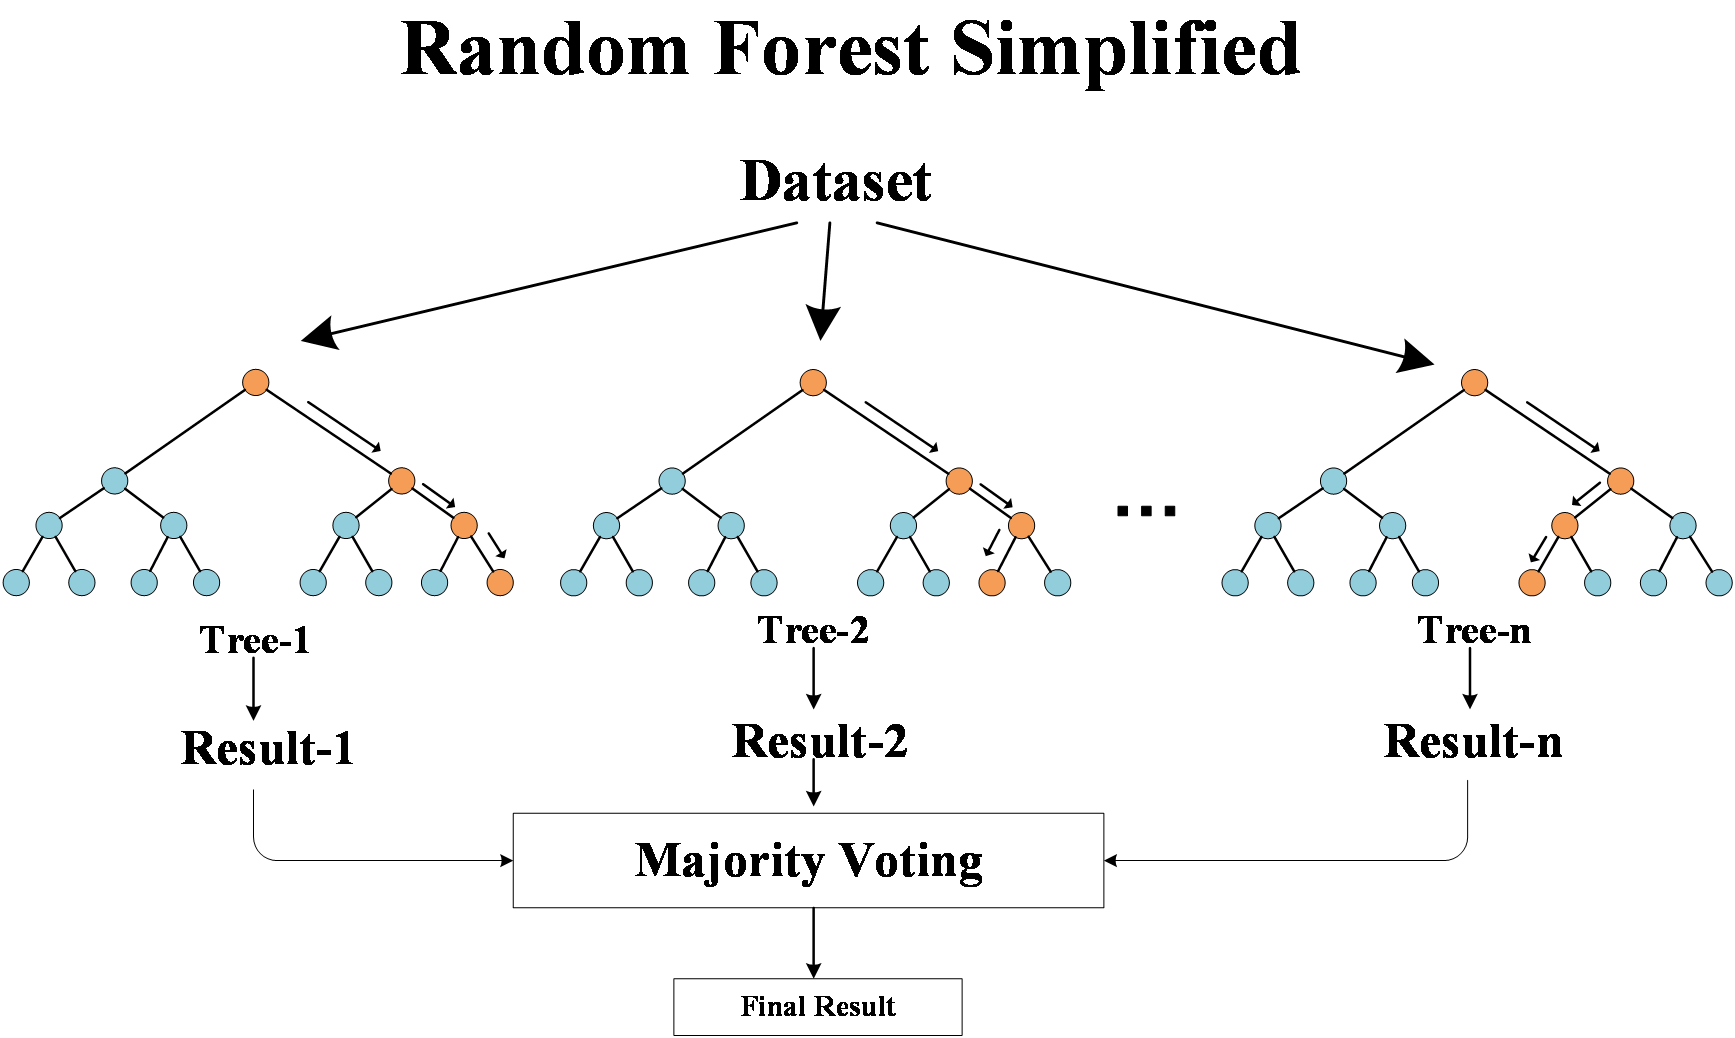
Figure 1: Simple schematic diagram of Random Forest.
For the parameter setting part of the random forest, the number of date periods taken for the independent variables in the training and test sets will be chosen to vary between 1 and 100, increasing by 10 each time. the number of trees in the tree population n is considered as a parameter of the random forest. For the number of trees in the random forest, in order to fully consider the 3 features and the 19 industry segments, 20 to 200 are chosen for testing with an interval of 20, for a total of 10 treatment sets is valid. To prevent overfitting, the depth of each decision tree in the random forest was set to a total of 9 numbers from 2 to 10. And each of the 3 indicators was introduced as a combination, 19 for using only up and down, 38 for adding moving average features, and 57 for adding volatility on top of again. Finally, the best prediction accuracy was found among all combinations. All parameters were determined following the principle that the highest forecasts occur in the region of non-marginal parameters, i.e., the parameters were always chosen at the convergence point of the forecast.
Finally, in the voting session, the plural is chosen as the final result, i.e., the category that receives the most votes are the final result.
3.2. Long-Short Term Memory (LSTM)
Long Short-Term Memory (LSTM) is a recurrent neural network (RNN) variant that excels in processing and predicting time-series data, and LSTM models have made significant progress in solving the gradient disappearance and gradient explosion problems in traditional RNNs, making it one of the preferred models for many sequence modeling tasks. The core idea of LSTM is the introduction of components called "gating mechanisms", which help the model to better remember and understand long-term dependencies. Compared to traditional RNN units, LSTM units have a more complex internal structure and contain three key gating units: forgetting gates, input gates and output gates.Zaheer, s. et al.[13] use LSTM and Deep Learning Model for Stock Time Series Data to attain results that can validate the effectiveness of the proposed model, and this will assist investors in increasing their profits by making good decisions. The LSTM cell containing these three gates is shown in Figure 2.
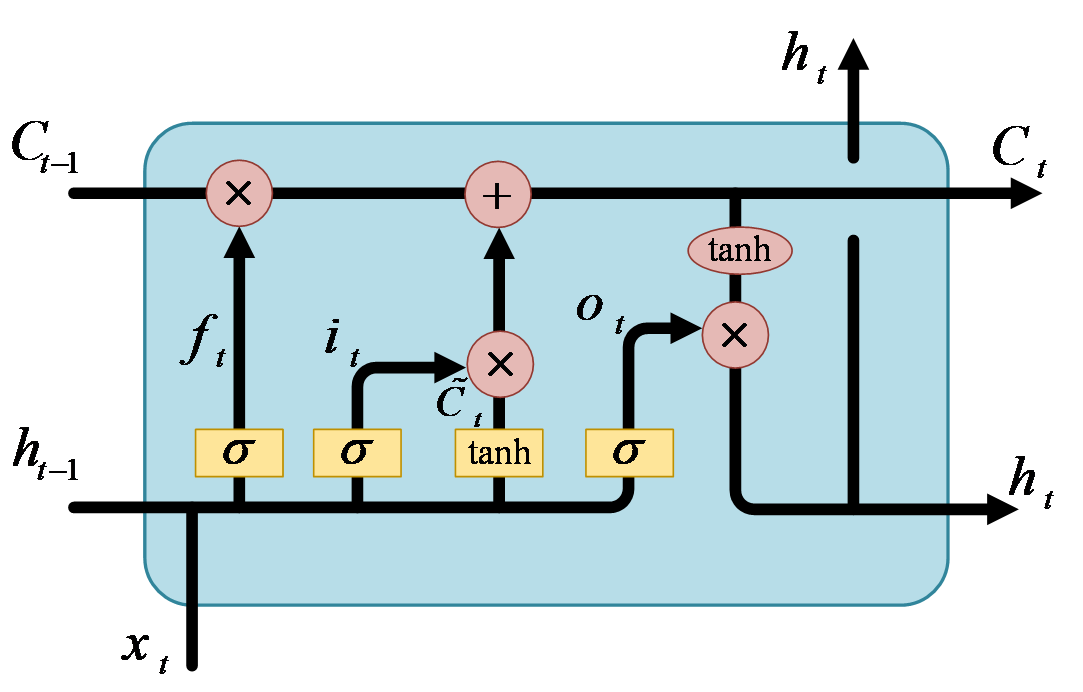
Figure 2 A basic LSTM unit with three gates.
Some equations related to this mechanism in an LSTM cell are given below.
\( {f_{t}}=σ({W_{xf}}{x_{t}}+{W_{hf}}{h_{t-1}}+{b_{f}}) \)
\( {i_{t}}=σ({W_{xi}}{x_{t}}+{W_{hi}}{h_{t-1}}+{b_{i}}) \)
\( {\widetilde{C}_{t}}=tanh{(}{W_{xC}}{x_{t}}+{W_{C}}{h_{t-1}}+{b_{C}}) \)
\( {C_{t}}={f_{t}}⊙{C_{t-1}}+{i_{t}}⊙{\widetilde{C}_{t}} \)
\( {o_{t}}=σ({W_{xo}}{x_{t}}+{W_{o}}{h_{t-1}}+{b_{o}}) \)
\( {h_{t}}={o_{t}}⊙tanh{(}{C_{t}}) \)
where \( {f_{t}} \) is the forget gate value at the current cell, \( {i_{t}} \) is the input gate value, \( {C_{t}} \) is the current cell state, \( {\widetilde{C}_{t}} \) is the cell candidate value, \( {o_{t}} \) is the output gate value, \( {W_{hf}} \) , \( {W_{hi}} \) , \( {W_{C}} \) , \( {W_{o}} \) and \( {W_{xf}} \) , \( {W_{xi}} \) , \( {W_{xC}} \) , \( {W_{xo}} \) are weights of the networks, \( {b_{f}} \) , \( {b_{i}} \) , \( {b_{C}} \) , \( {b_{o}} \) are bias variable values, \( {h_{t}} \) is the current hidden state value, \( {h_{t-1}} \) is the prior hidden state value, and \( {x_{t}} \) is the new input value at the current cell. The notation \( ⊙ \) means pointwise multiplication. Besides, there are two activation functions (AFs) being used in the study, namely the sigmoid activation function (σ) and the tanh activation function. Both of them are the most frequently used nonlinear AFs in the artificial neural networks. The Sigmoid function is a nonlinear function which can be expressed as \( S(x)=(1+exp{(}-x){)^{-1}} \) . In LSTM models, it is usually used to determine the output of input data passing through gating units. These gating units help the LSTM model to control the flow of information and the preservation of memory. The tanh function also known as hyperbolic tangent function is another commonly used nonlinear function of the form as \( tanh{(}x)=(exp{(}x)-exp{(}-x))/(exp{(}x)+exp{(}-x)) \) . In the LSTM model, the tanh function is usually used to generate a candidate value for the LSTM cell. This candidate value can be combined with the output of the input gating unit to update and remember new information. tanh function has an output range between -1and 1, which compresses the input data and produces an output with strong expressiveness. This also helps the LSTM model to better process the input data and memorize the information.
The core of the LSTM is the LSTM cell, which is responsible for storing and updating memory information. the LSTM cell consists of a cell state and a hidden state. The cell state is the main information transfer channel in the LSTM network, which is able to retain information about long-term dependencies. The hidden state is the result of the output gate, which is used to pass the state of the LSTM cell to the next time step or other layers.
• Forget Gate: The forget gate determines which information in the cell states of the previous time step should be forgotten or discarded. Its input includes the hidden state of the previous time step and the input of the current time step.
• Input Gate: The input gate determines which information from the input of the current time step should be added to the cell state. It outputs a value between 0 and 1 via the Sigmoid activation function, indicating the extent to which information at the corresponding location needs to be added to the cell state. It also includes the Tanh activation function to generate a vector of candidate values indicating new information that can be added to the cell state.
The cell state update is done by using the outputs of the forgetting gate and the input gate to update the cell state. The output of the forgetting gate is used to forget the information in the cell state from the previous time step, and the output of the input gate is used to add new information. These two are combined by multiplying by elements (Hadamard product) to update the cell state.
• Output Gate:
The output gate determines the content of the hidden state for the current time step. After a series of changes, the hidden state of the current time step can be obtained.
This gating mechanism of the LSTM model allows it to better capture long-term dependencies, giving it excellent performance in processing time-series data. The predictive power of the model can be further improved by appropriately adjusting hyperparameters such as the number of layers, the number of hidden units and the number of training iterations of the LSTM network.
In this study, the LSTM model is used to predict the rotation of different sectors of the Chinese stock market. By utilizing the memory capability and time-series modeling ability of the LSTM network, it is expected to accurately capture the trends and patterns of the sector rotation to provide valuable prediction results. Subsequently, compare it with a random forest model to evaluate the performance of the LSTM model in the prediction of sector rotation.
The hyperparameters of this study for LSTM is chosen: with the following parameters.
• Number of date periods taken by the independent variable: 1 to 100, at 10 intervals
• Number of features for LSTM input: if 19, then only up and down features are used, 38 for adding moving average features, 57 for adding volatility features
• Number of LSTM hidden neurons: 16, 32, 64 and 128
• Number of layers of LSTM model: 1, 2 and 3
• The proportion of randomly masked neurons in the LSTM: from 0.2 to 0.5, with an interval of 0.05. This operation is also one of the hyperparameter tuning methods to avoid overfitting.
• Validation split: 0.2
3.3. Algorithms
Randomized Search Randomized Parameter Optimization (RandomizedSearchCV) is a method for optimizing hyperparameters by randomly selecting different combinations of hyperparameters in a given hyperparameter space and evaluating their performance to find the best hyperparameter configuration (J Bergstra and Y Bengio)[14]. Compared with the traditional grid search method, stochastic search has higher efficiency and flexibility. It is able to search for hyperparameter combinations with good performance with less computational resources. Compared with the traditional grid search method, the random search can search for a combination of hyperparameters with good performance faster than the traditional grid search method. By randomly selecting hyperparameter combinations, an exhaustive search of the entire parameter space can be avoided, thus saving computational resources. Flexibility, robustness: By using cross-validation methods, stochastic search can provide a comprehensive evaluation of the model's performance and reduce the dependence on a specific validation set. This helps to improve the generalization ability and stability of the model.
What is more, in order to improve the accuracy of the model, the Adam algorithm (Diederik P. Kingma and Jimmy Ba)[15] is used, which is a gradient-based optimization algorithm that is closely related to the adaptive learning rate algorithm. Traditional optimization algorithms (such as gradient descent) use a fixed learning rate at each parameter update, but this fixed learning rate may cause the training process to converge slowly or diverge. The adaptive learning rate algorithm automatically adjusts the learning rate according to the parameters and gradients in order to improve the efficiency and performance of training. Compared with the traditional fixed learning rate algorithm, the adaptive learning rate of Adam algorithm can control the step of parameter update more accurately and avoid the problem of setting the learning rate too high or too low. This also makes it have better convergence and stability when training deep learning models. In this study, Adam's algorithm is used as an optimization algorithm and combined with the characteristics of adaptive learning rate to adjust the parameter update step of the model. By adaptively adjusting the offset and scaling of the learning rate, we are able to effectively optimize the parameters of the model under different parameters and gradients, thus improving the prediction performance and the convergence speed of the model.
Softmax function: Since this study predicts the law of A-share sector rotation, it considers the rise and fall of 19 (A-S) sectors and the market-to-price ratio, so this study is a multi-classification machine learning problem. Softmax is a common mathematical function that is often used in machine learning multi-classification problems. It transforms a set of real numbers into a vector representing a probability distribution such that each element of the vector is between 0 and 1 and the sum of all elements is 1.
It is defined as follows:
\( softmax{(}x)=\frac{{e^{x}}}{sum({e^{x}})} \)
where x is a vector of real numbers and e is the base of the natural logarithm.
In this study, the softmax function is used in the last layer of the LSTM multiclassification problem to transform the output of the model into a form that represents the probability of each category.
SMOTE (Synthetic Minority Oversampling Technique), which is an oversampling method introduced by N. V. Chawla et al.[16]. Its principle is an improvement of the random sampling method. In random oversampling, although it can make the sample set balanced, it will bring some problems, for example, the oversampling makes multiple replications of the minority class samples, which expands the data size and increases the complexity of model training, and also easily causes overfitting. SMOTE algorithm selects a random sample y from its K nearest neighbors for each sample x of minority class samples, and then randomly selects a point on the x, y line as the newly synthesized sample. This oversampling method of synthesizing new samples can reduce the risk of overfitting.
Since in this study, a multi-category task is taken, each category has different weights, and some categories contain more stocks others less, which will cause the model's prediction effect for some categories to vary greatly because of category imbalance, using the SMOTE algorithm can balance the number of each category in the sample.
4. Experiment Results
Accuracy, F-measure, Recall and Precision are commonly used to assess the performance of classifiers. Before using these indicators, the method of calculating them need estimating Precision and Recall which is evaluated from True Positive (TP), False Positive (FP), True Negative (TN) and False Negative (FN). TP (True Positive) is the number of correctly classified positive instances, TN (True Negative) is the number of correctly classified negative instances, FP (False Positive) is the number of incorrectly classified positive instances, and FN (False Negative) is the number of incorrectly classified negative instances. Eqs. (9)-(12) are definitions of them.
Two types of Precision measures the proportion of correctly classified positive instances out of the total number of instances classified as positive or negative. Recall, also known as sensitivity or true positive rate, measures the proportion of correctly classified positive instances out of the total number of actual positive instances.
\( Re{c}all(Sensitivity)=\frac{TP}{(TP+FN)} \)
\( Specificity=\frac{TN}{(TN+FP)} \)
\( precisio{n_{positive}}=\frac{TP}{(TP+FP)} \)
\( precisio{n_{negative}}=\frac{TN}{(TN+FN)} \)
Accuracy represents the proportion of correctly classified instances out of the total number of instances. The F-measure is the harmonic mean of precision and recall, providing a single metric to balance both indicators. Both of them are calculated as Eqs. (13) and (14)
\( Accuracy=\frac{TP+TN}{(TP+TN+FP+FN)} \)
\( F-measure=\frac{2×(precision×recall)}{(precision+recall)}=\frac{TP}{TP+\frac{FN+FP}{2}} \)
Figures 3-4 below show the multiclassification confusion matrices for Random Forest and LSTM, respectively. The multiclassification confusion matrix is a matrix representation for evaluating the performance of a multiclassification model, where each row represents the actual category and each column represents the predicted category, and the labels in the figure are the 19 industry codes (A-S) of the SEC. It compares the predicted results of the model with the real labels and places the samples in the corresponding positions of the matrix according to the combination of predicted and actual categories. The elements on the diagonal line indicate the number of samples correctly predicted by the model, i.e., the number of samples matching the predicted and actual categories. The elements on the non-diagonal line indicate the number of samples for which the model is incorrect or confusing in its predictions. The values on the non-diagonal line reflect the model's confusion on different categories, i.e., the cases where the model misclassifies some categories as other categories. By looking at the values on the diagonal line, it can be seen that category O has a poorer prediction in the model, the reason for which may be related to the small number of stocks covered by the category O segment, resulting in an unbalanced sample. Comparing the confusion matrices of the two models, it can be seen that the random forest has a better prediction in class C and S sectors, which is due to the presence of strong characteristics and high dimensionality in all these sectors.
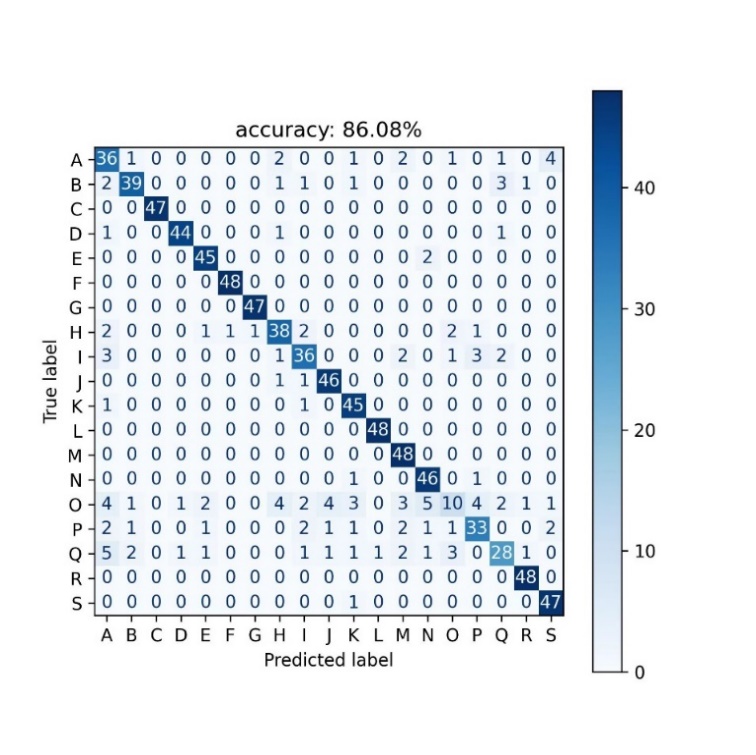

Figure 3: Confusion matrix of random forest Figure 4: Confusion matrix of LSTM.
The optimal parameter combinations were finally determined by experimenting with the parameter setting dataset of each prediction model and using the random search method for hyperparameter optimization selection. In the parameter setting experiments, these parameter combinations and their corresponding accuracy and f-values are shown in the Table 2-3. The purpose of the comparison dataset experiment is to compare the predictive performance of the two models for the best combination of parameters reported in the parameter setting experiment.
Table 2: Best parameters combinations of random forest model and their performance.
parameters | figure |
Date periods | 10 |
Feature Selection | 38 |
Number of trees | 200 |
Maximum depth | 10 |
Accuracy | 0.861 |
Precision | 0.851 |
Recall | 0.860 |
F1 score | 0.850 |
Results are retained to three decimal places.
Table 3: Best parameters combinations of LSTM model and their performance.
parameters | figure |
Date periods | 30 |
Feature Selection | 57 |
Number of hidden neurons | 128 |
Number of model layers | 2 |
Proportion of randomly shielded neurons | 0.2 |
Accuracy | 0.881 |
Precision | 0.875 |
Recall | 0.881 |
F1 score | 0.876 |
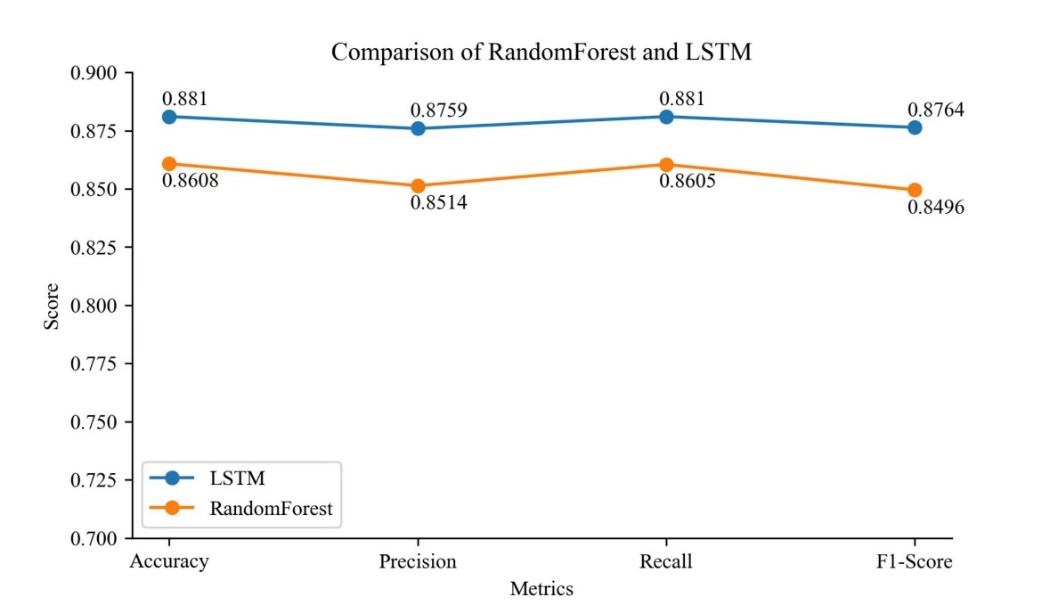
Figure 5: Evaluation of four classification algorithms.
The experimental results (Fig5) show that both models have good performance in predicting the Chinese sector rotation. LSTM is better than random forest in all indicants.
As can be seen from Table 2, the LSTM model achieves 88% accuracy, while the random forest model achieves 86% accuracy, and the LSTM is higher than the random forest model in terms of the performance of each index. This shows that the LSTM model is slightly better than the random forest model in general. However, the LSTM model is more sensitive to hyperparameters, while the random forest model may be biased when dealing with highly unbalanced data, which may be the reason why their accuracy cannot be further improved.
5. Bagging Enhancement
Since both the random forest and LSTM models mentioned above have good prediction degrees and similar prediction accuracies (86.08% and 88.10%), this study considers combining the two using a bagging algorithm to further improve the accuracy of the classifiers. A model improvement method is proposed that uses LSTM and random forest models under the optimal parameters above to construct a bagging algorithm (LSTM-RF Bagging). It improves the prediction accuracy by integrating multiple LSTM models and random forest models and utilizing their combined effect. Multiple different subsample sets are first randomly selected from the original training set using a self-sampling method. Then, one LSTM model and one random forest model are trained on each subsample set. Finally, the ultimate integrated predictions are derived by voting or averaging the predictions of all models. Typically, LSTM-RF Bagging improves prediction accuracy and improves model stability. By integrating the prediction results from multiple LSTM models and random forest models, the impact of individual model errors on the final results can be reduced and more robust prediction performance can be obtained.
Table 4: Number of times 19 sectors dominated the leading sector for the day in 5 years.
-- | O | Q | A | P | H | B | J | I | D | S |
count | 238 | 134 | 126 | 107 | 106 | 90 | 80 | 71 | 36 | 36 |
-- | N | K | R | M | E | L | G | F | C | -- |
count | 34 | 33 | 33 | 24 | 20 | 10 | 9 | 7 | 2 | -- |
Table 4 presents information about the frequency with which each sector has been the leading sector on a daily basis over the past 5 years. It is evident that this dataset is imbalanced, ranging from 238 occurrences to only 2 occurrences. As mentioned earlier in this paper, a sampling methodology has been employed to mitigate the adverse effects of this imbalance. Among the sectors, sector O has the highest number of instances where it experienced the greatest rise or fall within a single trading day, totaling 238 occurrences. Conversely, sector C has the lowest number, with only 2 instances. This imbalance also impacts the accuracy of predictions made by all the models for different sectors. Figure 6 illustrates the prediction accuracy of the LSTM model, the Random Forest model, and the bagging model for two sectors. It can be observed that the bagging model achieves the highest accuracy, reaching 89.47%, surpassing its sub-models across all metrics (Fig7). It is worth noting that the precision of the board samples with a high occurrence rate is relatively low. The figure indicates that the lowest accuracy is found in sector O, as it has the highest number of occurrences in the initial sector. On the other hand, sector C exhibits the highest accuracy due to its lower number of occurrences.
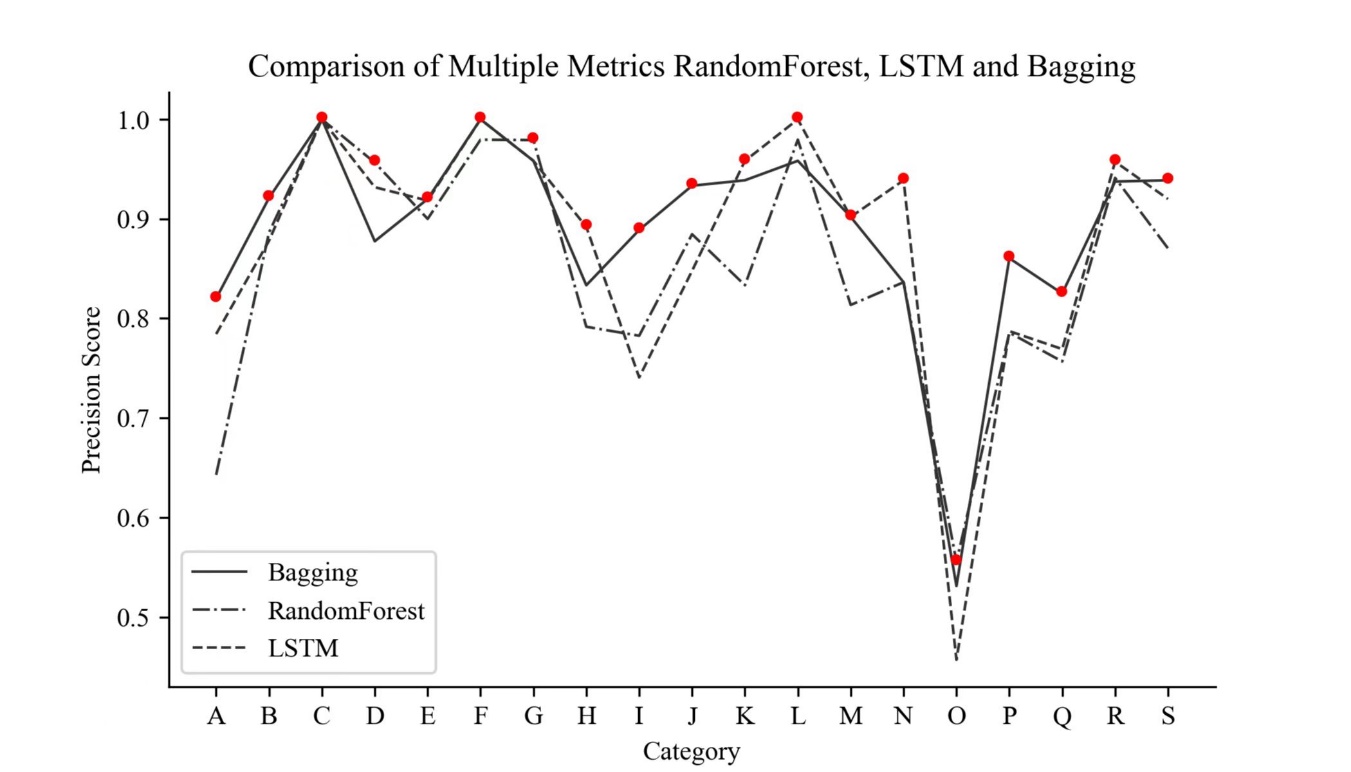
Figure 6: Precision comparison of three methods in all categories.
When predicting sector rotation patterns using three methods above, it is evident that LSTM outperforms the Random Forest model. Additionally, the bagging classifier yields the best results, achieving an accuracy of 89.47%.
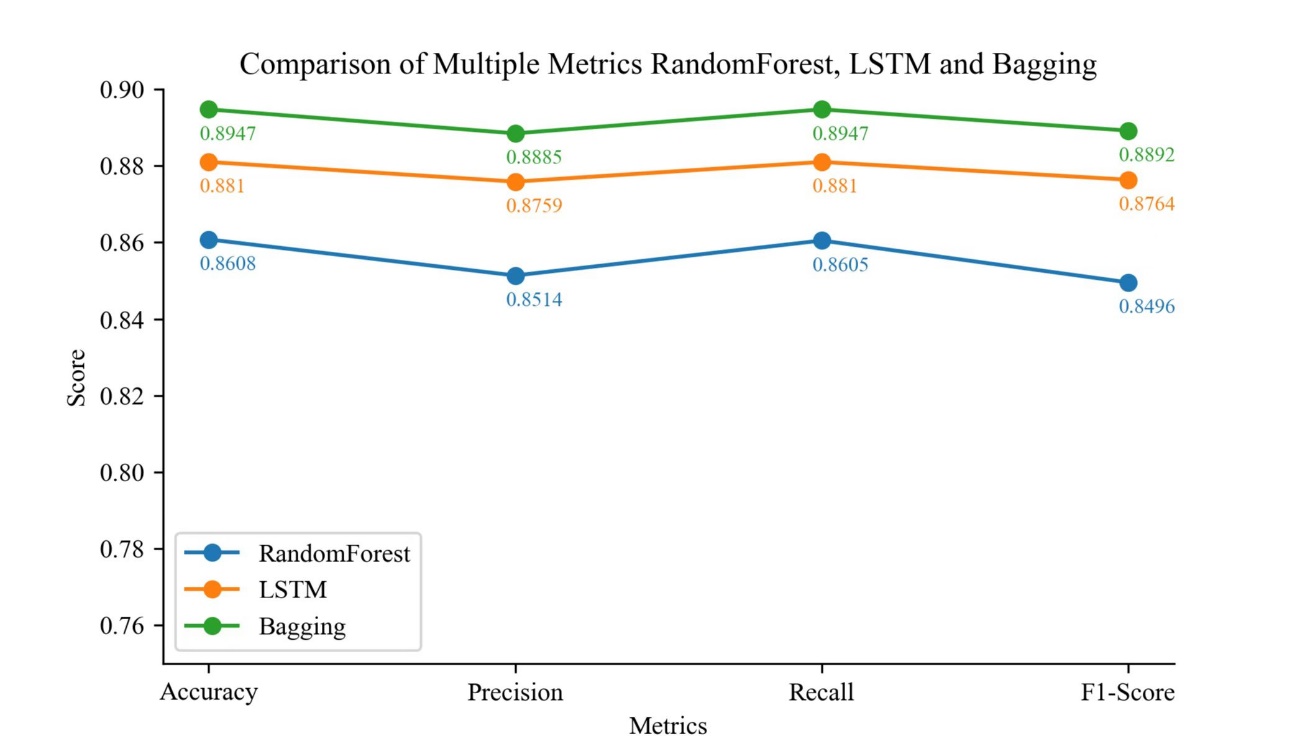
Figure 7: Four metrics comparison of 3 methods.
The ensemble approach combining LSTM with the Random Forest model can be beneficial as followed:
• Model Diversity: The Bagging algorithm integrates several different sub-models, including LSTM and Random Forest, which vary in terms of learning algorithms, feature selection, etc. This diversity reduces the correlation between models, mitigating overfitting risk and enhancing overall prediction accuracy.
• Reducing Variance: LSTM and Random Forest are two distinct model types, potentially uncorrelated in terms of errors on the data. By combining them, the LSTM-RF Bagging algorithm effectively reduces variance in prediction results, leading to increased model stability and reliability.
• Bias-Variance Tradeoff: LSTM and Random Forest exhibit different bias-variance tradeoffs when handling problems. LSTM models capture long-term dependencies in time-series data, suitable for nonlinear time-series data. On the other hand, Random Forests excel in handling high-dimensional data and larger sample sizes. The Bagging algorithm leverages their respective strengths to achieve more comprehensive predictions.
• Outliers and Noise Suppression: Different models have varying sensitivities to outliers and noise. By averaging or voting on multiple sub-models, the Bagging algorithm effectively suppresses the impact of outliers and noise on overall prediction results, enhancing model robustness.
6. Discussion and Conclusion
Firstly, the LSTM model demonstrates superior performance in our experiments, achieving an accuracy of 88%. This signifies its advantage in capturing the dynamic patterns of A-share sector rotation. The LSTM model excels in processing sequential data and capturing long-term dependencies, which are vital for comprehending and predicting rotation trends among A-share sectors. Consequently, LSTM models can provide more accurate rotation forecasts, enabling us to offer investors reliable sector selection and asset allocation recommendations.
On the other hand, the Random Forest model performs slightly less effectively in the A-share sector rotation problem, attaining an accuracy rate of 86%. Nonetheless, it still exhibits some predictive power. The Random Forest model excels in handling problems with high-dimensional feature spaces and boasts interpretability and robustness. As such, it remains a viable alternative for addressing the A-share sector rotation problem. However, when compared to the LSTM model, the Random Forest model may encounter limitations in capturing serial dependence, leading to its marginally lower performance in rotation prediction.
In Section 5, the bagging algorithm demonstrates superior accuracy compared to other models, thanks to LSTM-RF Bagging's achievement of model diversity, reduced variance, a balance between bias and variance advantages, and the suppression of outliers and noise through the integration of several different sub-models. Future endeavors can focus on further optimizing model parameters, incorporating other deep learning and machine learning models, and integrating additional data and features to enhance the prediction of A-share sector rotation. Furthermore, apart from statistical and machine learning methods, researchers have explored various factors influencing sector rotation. These factors include public opinion analysis, macroeconomic indicators, and policy changes, which are believed to impact sector rotation. Introducing additional information and indicators could potentially improve the predictive capability of sector rotation trends.
Although this study has achieved some results in predicting sector rotation patterns in the A-share market, there are still potential research opportunities and challenges in real trading applications. The challenges related to trading costs, market liquidity, and implementing trading strategies need to be further considered and explored. Addressing these issues in live trading will provide investors with more feasible and effective trading strategies to achieve better investment returns in the real market.
Regarding the application and discussion of live market aspects, the model presented in this article can be applied to the latest market data and compared with actual trading to assess its accuracy and usefulness. This validation process will help confirm the model's performance in different market environments and provide more credible live trading results. Additionally, optimizing trading strategies and execution algorithms should be considered. Practical trading factors, such as transaction costs, slippage, and liquidity, can be taken into account, and technologies like reinforcement learning can be incorporated to automate the trading decision and execution process. This will enhance trading efficiency and execution consistency.
Furthermore, the research can be applied to actual portfolio management. By integrating sector rotation prediction models with asset allocation models, portfolio allocation and rebalancing strategies can be optimized. This approach will lead to improved overall investment returns and better risk diversification. Consequently, this paper also aims to promote further development and innovation in real trading research in the future.
References
[1]. JEGADEESH, N. and TITMAN, S. (1993), Returns to Buying Winners and Selling Losers: Implications for Stock Market Efficiency. The Journal of Finance, 48: 65-91. https://doi.org/10.1111/j.1540-6261.1993.tb04702.x
[2]. Lee, C.M.C. and Swaminathan, B. (2000), Price Momentum and Trading Volume. The Journal of Finance, 55: 2017-2069. https://doi.org/10.1111/0022-1082.00280
[3]. Bradley T. Ewing (2002) The transmission of shocks among S&P indexes, Applied Financial Economics, 12:4, 285-290, DOI: 10.1080/09603100110090172
[4]. Mateus, C., Sarwar, G., & Todorovic, N. (2018). US sector rotation with five-factor Fama-French alphas. Journal of Asset Management, 19(2). https://doi.org/10.1057/s41260-017-0067-2
[5]. ZHANG Xin. (2020). Research on the Rotation Effect of Stock Market Sector and the Drive of Macro Economy. Special Zone Economy (05),130-132.
[6]. JIN Xiu, CHEN Na, & WANG Jia. (2020). Empirical Study on Cross—industry Asset Allocation Model under the Perspective of Flight—to—quality. Chinese Journal of Management Science (11),12-22. doi:10.16381/j.cnki.issn1003-207x.2020.11.002.
[7]. Shuai Wang, Zhongyan Li, Jinyun Zhu, Zhicen Lin, Meiru Zhong. Stock selection strategy of A-share market based on rotation effect and random forest[J]. AIMS Mathematics, 2020, 5(5): 4563-4580. doi: 10.3934/math.2020293
[8]. Rubio, L., & Alba, K. (2022). Forecasting Selected Colombian Shares Using a Hybrid ARIMA-SVR Model. Mathematics, 10(13), 2181. https://doi.org/10.3390/math10132181
[9]. Hansun, S., Young, J.C. Predicting LQ45 financial sector indices using RNN-LSTM. J Big Data 8, 104 (2021). https://doi.org/10.1186/s40537-021-00495-x
[10]. S. Liu, G. Liao and Y. Ding, "Stock transaction prediction modeling and analysis based on LSTM," 2018 13th IEEE Conference on Industrial Electronics and Applications (ICIEA), Wuhan, China, 2018, pp. 2787-2790, doi: 10.1109/ICIEA.2018.8398183.
[11]. Jigar Patel, Sahil Shah, Priyank Thakkar, K Kotecha. (2015) Predicting stock and stock price index movement using Trend Deterministic Data Preparation and machine learning techniques. Expert Systems with Applications, (42), 259-268.
[12]. Yin, L., et al.: Research on stock trend prediction method based on optimized random forest.CAAITrans.Intell.Technol.8(1),274–284(2023). https://doi.org/10.1049/cit2.12067
[13]. Zaheer, S., Anjum, N., Hussain, S., Algarni, A. D., Iqbal, J., Bourouis, S., & Ullah, S. S. (2023). A Multi Parameter Forecasting for Stock Time Series Data Using LSTM and Deep Learning Model. Mathematics, 11(3), 590. https://doi.org/10.3390/math11030590
[14]. Bergstra, J., & Bengio, Y. (2012). Random search for hyper-parameter optimization. Journal of machine learning research, 13(2).
[15]. Kingma, D. P., & Ba, J. (2014). Adam: A method for stochastic optimization. arXiv preprint arXiv:1412.6980.
[16]. Chawla, N. V., Bowyer, K. W., Hall, L. O., & Kegelmeyer, W. P. (2002). SMOTE: synthetic minority over-sampling technique. Journal of artificial intelligence research, 16, 321-357.
Cite this article
Yin,L. (2023). Forecasting Sector Rotation of A-share Market Using LSTM and Random Forest. Advances in Economics, Management and Political Sciences,49,109-123.
Data availability
The datasets used and/or analyzed during the current study will be available from the authors upon reasonable request.
Disclaimer/Publisher's Note
The statements, opinions and data contained in all publications are solely those of the individual author(s) and contributor(s) and not of EWA Publishing and/or the editor(s). EWA Publishing and/or the editor(s) disclaim responsibility for any injury to people or property resulting from any ideas, methods, instructions or products referred to in the content.
About volume
Volume title: Proceedings of the 2nd International Conference on Financial Technology and Business Analysis
© 2024 by the author(s). Licensee EWA Publishing, Oxford, UK. This article is an open access article distributed under the terms and
conditions of the Creative Commons Attribution (CC BY) license. Authors who
publish this series agree to the following terms:
1. Authors retain copyright and grant the series right of first publication with the work simultaneously licensed under a Creative Commons
Attribution License that allows others to share the work with an acknowledgment of the work's authorship and initial publication in this
series.
2. Authors are able to enter into separate, additional contractual arrangements for the non-exclusive distribution of the series's published
version of the work (e.g., post it to an institutional repository or publish it in a book), with an acknowledgment of its initial
publication in this series.
3. Authors are permitted and encouraged to post their work online (e.g., in institutional repositories or on their website) prior to and
during the submission process, as it can lead to productive exchanges, as well as earlier and greater citation of published work (See
Open access policy for details).
References
[1]. JEGADEESH, N. and TITMAN, S. (1993), Returns to Buying Winners and Selling Losers: Implications for Stock Market Efficiency. The Journal of Finance, 48: 65-91. https://doi.org/10.1111/j.1540-6261.1993.tb04702.x
[2]. Lee, C.M.C. and Swaminathan, B. (2000), Price Momentum and Trading Volume. The Journal of Finance, 55: 2017-2069. https://doi.org/10.1111/0022-1082.00280
[3]. Bradley T. Ewing (2002) The transmission of shocks among S&P indexes, Applied Financial Economics, 12:4, 285-290, DOI: 10.1080/09603100110090172
[4]. Mateus, C., Sarwar, G., & Todorovic, N. (2018). US sector rotation with five-factor Fama-French alphas. Journal of Asset Management, 19(2). https://doi.org/10.1057/s41260-017-0067-2
[5]. ZHANG Xin. (2020). Research on the Rotation Effect of Stock Market Sector and the Drive of Macro Economy. Special Zone Economy (05),130-132.
[6]. JIN Xiu, CHEN Na, & WANG Jia. (2020). Empirical Study on Cross—industry Asset Allocation Model under the Perspective of Flight—to—quality. Chinese Journal of Management Science (11),12-22. doi:10.16381/j.cnki.issn1003-207x.2020.11.002.
[7]. Shuai Wang, Zhongyan Li, Jinyun Zhu, Zhicen Lin, Meiru Zhong. Stock selection strategy of A-share market based on rotation effect and random forest[J]. AIMS Mathematics, 2020, 5(5): 4563-4580. doi: 10.3934/math.2020293
[8]. Rubio, L., & Alba, K. (2022). Forecasting Selected Colombian Shares Using a Hybrid ARIMA-SVR Model. Mathematics, 10(13), 2181. https://doi.org/10.3390/math10132181
[9]. Hansun, S., Young, J.C. Predicting LQ45 financial sector indices using RNN-LSTM. J Big Data 8, 104 (2021). https://doi.org/10.1186/s40537-021-00495-x
[10]. S. Liu, G. Liao and Y. Ding, "Stock transaction prediction modeling and analysis based on LSTM," 2018 13th IEEE Conference on Industrial Electronics and Applications (ICIEA), Wuhan, China, 2018, pp. 2787-2790, doi: 10.1109/ICIEA.2018.8398183.
[11]. Jigar Patel, Sahil Shah, Priyank Thakkar, K Kotecha. (2015) Predicting stock and stock price index movement using Trend Deterministic Data Preparation and machine learning techniques. Expert Systems with Applications, (42), 259-268.
[12]. Yin, L., et al.: Research on stock trend prediction method based on optimized random forest.CAAITrans.Intell.Technol.8(1),274–284(2023). https://doi.org/10.1049/cit2.12067
[13]. Zaheer, S., Anjum, N., Hussain, S., Algarni, A. D., Iqbal, J., Bourouis, S., & Ullah, S. S. (2023). A Multi Parameter Forecasting for Stock Time Series Data Using LSTM and Deep Learning Model. Mathematics, 11(3), 590. https://doi.org/10.3390/math11030590
[14]. Bergstra, J., & Bengio, Y. (2012). Random search for hyper-parameter optimization. Journal of machine learning research, 13(2).
[15]. Kingma, D. P., & Ba, J. (2014). Adam: A method for stochastic optimization. arXiv preprint arXiv:1412.6980.
[16]. Chawla, N. V., Bowyer, K. W., Hall, L. O., & Kegelmeyer, W. P. (2002). SMOTE: synthetic minority over-sampling technique. Journal of artificial intelligence research, 16, 321-357.