


1. Introduction
For developing countries, the rise and development of the digital economy is a new opportunity to drive economic development. In recent years, China's economic recovery and future growth have been largely driven by the data-driven digital economy. China's digital economy will reach RMB 45,5 trillion in 2021, accounting for more than one-third of the country's total GDP, according to a recent report by CAICT.
As one of the most important factors of production in today's era, data has an all-round impact on our production, life and ecology. Some literature has found that the digital economy brings significant positive incentive effects to socio-economic development, and some scholars believe that the digital economy has a positive impact on renewable energy development and low carbon society. On the other hand, for the new industries and new occupations created by the digital economy, it will bring more employment to the society.
Scholars have different views on the linkages and impacts of the digital economy, renewable energy and unemployment. It varies mainly by region, city, and level of social development.First, the relationship between renewable energy, unemployment and employment. Some scholars have used the "creative destruction" theory to model the job creation and destruction of renewable energy. It is found that renewable energy can only promote the employment of a small proportion of scientific and technical personnel. The impact on overall employment is negligible [1]. For some industries, it can be devastating. One study examines a T-town in Hebei province, China, where the cement factories that depend on environmental protection and economic transformation have shrunk from 133 in 2013 to 2 in 2017. This has caused structural unemployment in over 90% of the population of T-town [2]. The same damage was done in the three northeastern provinces (Liaoning, Jilin, and Heilongjiang), Shanxi, where the coal industry is concentrated. 3.96 million people were employed in the coal industry in 2016, a reduction of 1/4 of employment compared to the peak in 2013 [3].
Regarding the world as a whole, renewable energy faces similar challenges in other developed nations or regions. Researchers have determined that the positive impact of renewable energy on employment in the United States is limited to a few states [4]. However, the South African region is different, a study examined the impact of renewable energy consumption on unemployment in the South African region from 1990-2014 through ARDL boundaries, and the results showed that renewable energy will alleviate unemployment in South Africa, where renewable energy is abundant [5]. It can be seen that the development of renewable energy has a very different impact on different regions.
Secondly, some scholars have explored the impact of information technology on renewable energy conversion and utilization efficiency in South Asian economies, and found that ICT will optimize, for example, electricity infrastructure and thus increase renewable energy consumption [6]. Some researchers have also discovered that the digital economy has positive direct and spatial spillover effects on green factor productivity.The effects are primarily a result of the digital economy's promotion of green technologies [7]. It seems that the digital economy will have a positive effect by increasing the technical and production efficiency of renewable energy.
Third, there is the impact on the digital economy on the unemployment rate.By looking at 163 countries, some scholars conclude that unemployment grows to a maximum as digital technology expands. Then it starts to decline when the expansion of technology exceeds a particular value [8]. There are also articles on the impact of digital development on the labor market in developing countries. Using a large sample of countries. They discovered a negative correlation between the rate of digitalization adoption and the employment rate of enterprises. [9]. The economic inequality, wage inequality, and unemployment rates brought about by the development of the information economy. It has also been found that the higher the level of information, the higher the unemployment rate. There is a positive correlation between income levels and Internet/computer use. The development of the information industry can increase inequality in wage levels [10].
Some literature has measured the differences in digital development among different provinces and cities in China through three indicators: digital foundation, digital industry, and digital settings. The results show that Beijing, Shanghai, and Guangdong ranked the top three with a score of 90. The development indicators of Ningxia, Gansu, Xinjiang, and Qinghai are below 60 points [11]. This thesis will refer to the competition model of Marasco and Romano et al. [12, 13]. The calculation of the digital economy of the two provinces refers to the entropy weight topsis method [14]. This paper will target two provincial cities to investigate the effects of the digital economy, renewable energy and unemployment. And answer 1. the impact of digital economy development on renewable energy. 2. the impact of renewable energy development on unemployment rate up to. 3. the impact of digital economy on unemployment rate.
2. Methodology
In this paper, we will first calculate the degree of digital economization in Zhejiang Province and Guangdong Province. The entropy-weighted Topsis method is used to assign weights to the digital economy development indicators of each city in the two provinces. As shown in Equation 1, first, the 11 indicators will be heterogeneous; all 11 indicators selected in this paper are positively correlated with the level of digital economy development. Let x denote the original data of the jth indicator in the ith region, where i=1,2,3,4 j=1,2,... .M, and the criteria for positive indicators are treated as follows:
\( x_{ij}^{ \prime }=\frac{{x_{ij}}-min{\lbrace {x_{1j}},⋯,{x_{nj}}\rbrace }}{max{\lbrace {x_{1j}},⋯,{x_{nj}}\rbrace }-max{\lbrace {x_{1j}},…,{x_{nj}}\rbrace }} \) (1)
where n=2 and m=11, Next, the sample value of the ith region in the jth indicator is calculated as a proportion of the indicator:
\( {p_{ij}}=\frac{{x_{ij}}}{\sum _{i=1}^{n}{x_{ij}}},i=1,2,3,4⋯,n,j=1,2,⋯m \) (2)
Then, calculate the entropy weight Topsis of the jth indicator:
\( {e_{j}}=-k\sum _{i=1}^{n}{p_{ij}}ln{({p_{ij}})},j=1,2,⋯m \) (3)
\( k=\frac{1}{ln{(n)}} \gt 0 \) ,The information entropy redundancy is then calculated as follows:
\( {d_{j}}=1-{e_{j}},j=1,2,⋯m \) (4)
Finally, the weights of the indicators are derived and the digital economy development indicators are calculated for each region:
\( {ω_{j}}=\frac{{d_{j}}}{\sum _{j=1}^{m}{d_{j}}},j=1,2,⋯m \) (5)
\( {y_{i}}=\sum _{j=1}^{m}{ω_{j}}x_{ij}^{ \prime },i=1,2,⋯n \) (6)
Equations 5 and 6 indicate that a higher value of yi indicates a higher development of the digital economy in region i. The following is about the construction of digital economy development indicators and the selection of data (Table 1). The primary indicators are mainly the foundation of digital industry development, the technology level of digital economy, and the transaction development of digital economy. The development of digital industry foundation consists of three secondary indicators. The technological level of the digital economy is mainly composed of five secondary indicators. The transaction development of digital economy is composed of three indicators. The data of which come from the National Research Network Data Center, National Research Network, Information Industry Database, China High-Tech Industry Statistical Yearbook, China E-Commerce Report and China Statistical Yearbook.
Table 1. Comprehensive digital economy development indicators (continue).
Primary Indicator | Secondary Indicator | Unit |
Fundamentals of digital industry development | Fiber optic cable length(x1) | Kilometers |
Number of cell phone base stations(x2) | Million | |
Cell phone penetration rate(x3) | Per 100 people | |
Technology level of digital economy | Number of Internet broadband access ports(x4) | Million |
Related Patent Applications(x5) | Pice | |
Number of R&D projects (x6) | Pice |
Table 2. (continued).
Expenditure on R&D of industrial enterprises(x7) | Million yuan | |
Total turnover of technology contract(x8) | Million yuan | |
Digital Economy Transaction Developmen | E-commerce sales(x9) | Billion yuan |
Software industry income(x10) | Million yuan | |
Telecommunications business volume(x11) | Million yuan |
In order to get the degree of digital economy development of Zhejiang and Guangdong Province, this paper compares Beijing and Shanghai together for calculation. The final results are shown in Table 2 below, with Guangdong Province consistently ranking first with high scores during 2015-2020, and Zhejiang Province ranking second.
Table 2. Digital economy development index measurement results.
Region | Year | |||||
2015 | 2016 | 2017 | 2018 | 2019 | 2020 | |
B | 36.60 | 35.50 | 35.00 | 34.50 | 37.30 | 38.80 |
S | 11.60 | 11.40 | 8.40 | 9.30 | 11.00 | 14.20 |
Z | 47.40 | 42.60 | 43.90 | 44.80 | 44.60 | 45.30 |
G | 77.10 | 76.20 | 80.10 | 82.10 | 84.00 | 81.60 |
3. Results and Discussion
For ease of reference, the degree of digital economy, renewable energy generation and unemployment are denoted by DE, RE and UR respectively in the data description section of this paper. Since China's unemployment rate statistics are more specific. The official administrative registered unemployment rate figure in China is the urban registered unemployment rate. Therefore, in order to minimize the error as much as possible, Zhejiang and Guangdong, which have higher urban rates, will be selected as references in this paper. According to the 2021 Census, the urbanization rates of Guangdong and Zhejiang are 74.63% and 72.7%. For the purpose of data analysis, the unemployment rate, renewable energy generation (billion kWh), and the digital economy development index calculated earlier for the two cities for the period 2015-2020 were used in this paper. Among them, the renewable energy power generation data are obtained from: the annual national renewable energy monitoring and assessment report and the unemployment rate is derived from the China Bureau of Labor Statistics.
Since the units of the data in this paper differ significantly. In this paper, a normalization method is used to process the data with different magnitudes. This method turns all data into some relative value relationship and the values will range from 0 to 1. In this paper, the data of the three elements from 2015 to 2020 are divided by the maximum value of the period.
First, a simple descriptive statistic of 3 elements for Zhejiang and Guangdong cities. Tables 3 shows the calculation of the maximum, minimum, mean and SD for the two provinces. In terms of unemployment, the overall fluctuation is greater in Zhejiang. The degree of digital economy and renewable energy generation fluctuates more in Guangdong.
The research then employs a deterministic model to examine the dynamics of three elements of interest —unemployment, renewable energy, and the digital economy. The differential equation-based competition model in this paper mainly takes into account all three elements, and they may form different types of interactions. And the model is more convenient as it does not need to split the three elements one by one to do independent data analysis. Secondly, these three elements are coexisting in the society itself, and this paper's model can better recreate the coexisting nature of the link between the three elements.
To analyze this data, we employ a competition model based on differential equations developed by Marasco, which captures all types of interactions that occur in a context where a change in a given entity (such as the use of industrial robots) has an effect on other entities with whom the entity of interest interacts. This approach is novel in that the interaction coefficients are time-dependent and the model's solutions are known. We define the proportion of each species' share (ES) using a logit model. where i = 1 represents the unemployment rate, i = 2 represents the generation of renewable energy, and i = 3 represents the digital economy development index. The percentage and definition of the species are as follows:
\( \frac{d{x_{i}}}{dt}={r_{i}}{x_{i}}(1-\frac{\sum _{j=1}^{N} {α_{ij}}{x_{j}}}{{K_{i}}}) \) (7)
The model in this paper represents the interaction of the i-th and j-th species. Species shares are a function of the logistic growth rate gi and the interaction between the i-th and j-th species. The type of interspecies interactions depends on the following Table 4. six main scenarios occur. The first type of competition, where an increase (decrease) in one indicator has a negative (positive) effect on the other. The second type of Amensalism, where an increase (decrease) in indicator X has a negative (positive) effect on indicator Y, while indicator X is not affected by indicator Y. The third, Commensalism, where an increase (decrease) in indicator X has a positive (negative) effect on indicator Y, and indicator X is not affected by indicator Y. The fourth kind of Mutualism, where the increase (decrease) of indicator X has a positive (negative) impact on indicator Y, while indicator X is affected by the same change in indicator Y. The fifth, Predator-Prey, Indicator X's increase (reduction) influences indicator Y adversely (positively), and vice versa. The sixth type, Neutrlism, does not intersect with each other.
According to the previous differential equation competition model, this paper uses mathematica software to analyze and process the data to obtain the following graphs. Figures 1 and 2 represent the unemployment rate versus the digital economy in Zhejiang and Guangdong provinces, respectively. The yellow curve represents the unemployment rate and the blue curve represents the digital economy. This paper finds a similar trend in the two provinces. With the decline in the degree of digital economy, the unemployment rate has risen significantly. In the 2016-2019 period, the unemployment rate has been well alleviated as the level of the digital economy has picked up. But in 2020, due to the impact of COVID-19, the unemployment rate in Zhejiang began to increase again. Guangdong also presents a similar curve condition.
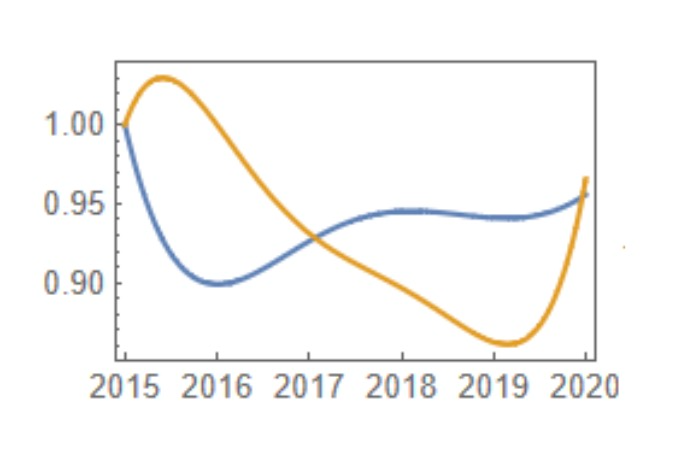
Figure 1. The interaction coefficients for Zhejiang(2015-2020)on UR(Yellow) and DE(Blue).
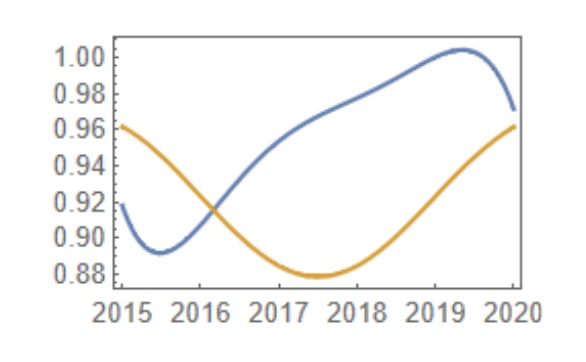
Figure 2. The interaction coefficients for Guangzhou(2015-2020)on UR(Yellow) and DE(Blue).
The connection between renewable energy and unemployment in Zhejiang and Guangdong from 2015 to 2020 is depicted in Figures 3 and 4 below. Unemployment rates have been decreasing over the 2015-2019 period as renewable energy generation has been climbing. The impact of the digital economy on the unemployment rate cannot be excluded. The country's growing focus on renewable energy has also created many jobs. According to the UN's Global Trends in Renewable Energy Investment report, investment in developing countries rose 19 percent year-over-year in 2015, to a whopping $156 billion. Most of that investment came from China. This shows that China's investment in renewable energy and the development of related industries has provided some support for employment.
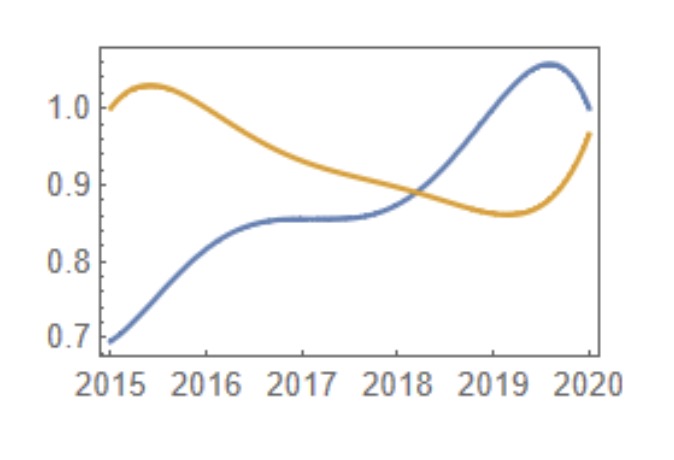
Figure 3. The interaction coefficients for Zhejiang(2015-2020)on UR(yellow) and UE(blue).
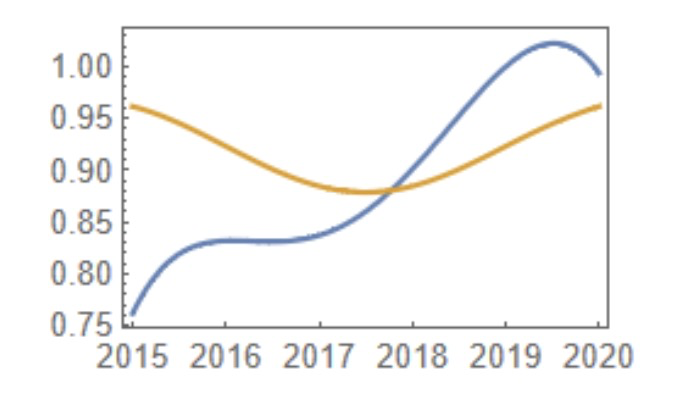
Figure 4. The interaction coefficients for Guangzhou(2015-2020)on UR(yellow) and UE(blue).
Finally, Figures 5 and 6 show the interactions between the degree of digital economy and renewable energy for the period 2015-2020 for Zhejiang and Guangdong. The yellow ones represent renewable energy and the blue ones indicate the digital economy. The graph shows that there is no significant relationship between the two. The growth of the digital economy does not contribute significantly to the expansion of renewable energy production.
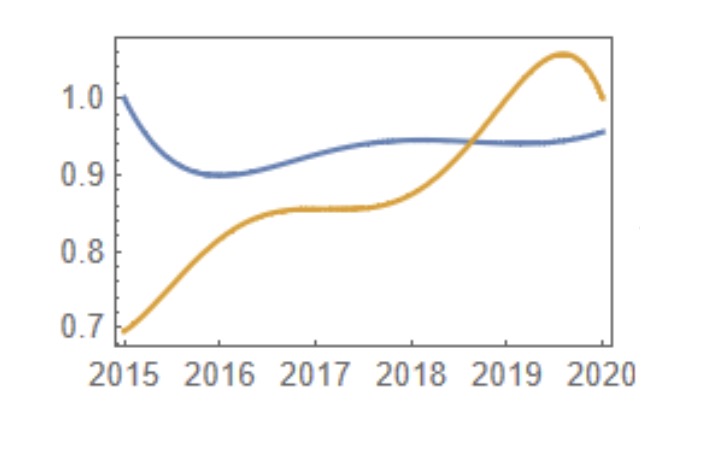
Figure 5. The interaction coefficients for Zhejiang(2015-2020)on UE(yellow) and DE(blue).
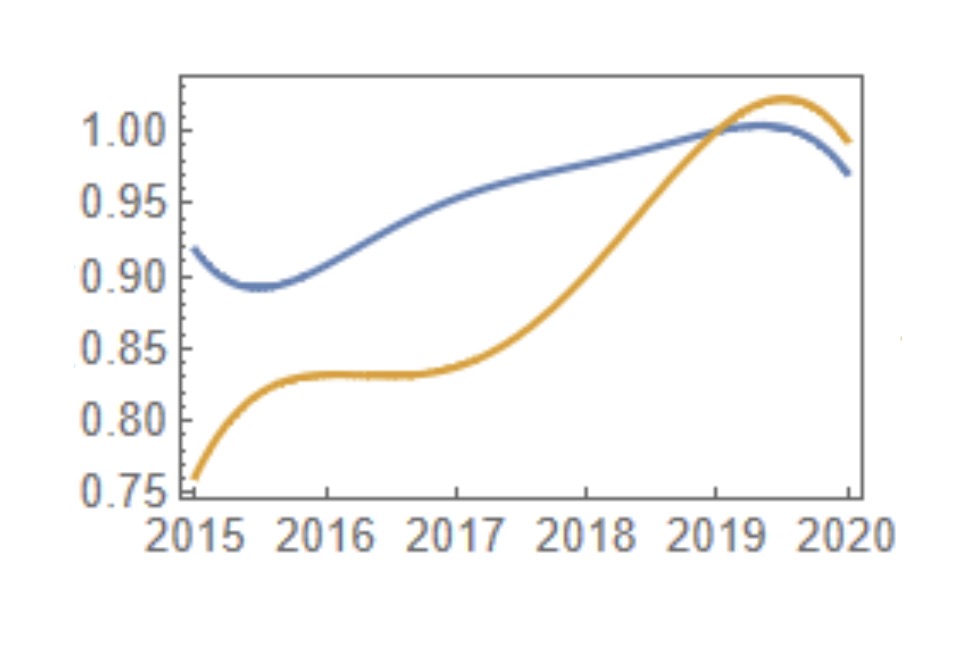
Figure 6. The interaction coefficients for Guangzhou(2015-2020)on UE(yellow) and DE(blue).
4. Conclusion
Finally, through the chart, this paper studies the two provinces of Guangdong and Zhejiang, which are more developed in digital economy in eastern China. By using a competitive model of differential equations, it is found that in both cities, the rise of the digital economy and renewable energy will contribute to a reduction in the unemployment rate. However, there is no significant correlation between the development of the digital economy and renewable energy, although a number of studies have demonstrated that the upgrading of communication technology in the development of the digital economy can assist renewable energy enterprises in achieving greater efficiency. But there was no significant interaction overall.
Since this paper can only collect relevant data from 2015 to 2020, it is impossible to know whether problems such as technological unemployment are caused by the development of new technologies in the initial stage of the digital economy. But we do know that every technological revolution brings a new period of social unrest and unimaginable economic problems. Technological change has brought new industries, services and lifestyles. This is bound to cause structural instability in the labor market. It is hoped that with continuous technological innovation and a more environmentally friendly concept, China's labor market can encourage enterprises to move towards sustainable development without sacrificing labor.y friendly mindset, the Chinese labor market will encourage companies to move towards sustainable development without sacrificing labor.
References
[1]. Bian, C.P.: Simulation research of creative destruction effect of renewable energy development to employ-ment of our country. Ocean University of China (2013).
[2]. Jiang, C.L., Yang, L.C., Xie, J., Author, Adrain Ely.: Research on "green unemployed group" from the per-spective of resilience. Guizhou Social Sciences (11), 135-142 (2018).
[3]. Chen, Y., Author, Peng, W.: Renewable energy investment and employment in China. Quarterly Journal of Political Economy 4(02), 133-156 (2021).
[4]. Behnaz S., Hassan, F., Gholipour, E.R., Omid, R.: Renewable energy sources and unemployment rate: Evidence from the US states. Energy Policy 168, 113155(2022).
[5]. Khobai, H., Kolisi, N., Moyo, C., Anyikwa, I., Dingela, S.: Renewable energy consumption and unemployment in South Africa. Int. J. Energy Econ. Pol 10 (2), 170–178 (2020).
[6]. Murshed, M.: An empirical analysis of the non-linear impacts of ICT-trade openness on renewable energy transition, energy efficiency, clean cooking fuel access and environmental sustainability in South Asia. Environmental Science and Pollution Research 27(29), 36254-36281 (2020).
[7]. Liu, Y.W., Wang, W.Q., Wu, Y., Zhang, J. N.: How does digital economy affect green total factor productivity? Evidence from China.Science of the total environment 159428 (2022).
[8]. Hamed, M.A., Mohammad, S. B.: Examining the effects of digital technology expansion on Unemployment: A cross-sectional investigation. Technology in Society 64, 101495(2021).
[9]. Shi, B., Li, Y. X., Yu, X.H., Yan, W.: Short-term load forecasting based on modified particle swarm optimizer and fuzzy neural network model. Systems Engineering-Theory and Practice 30(1), 158-160 (2010).
[10]. Wang, W.C.: Information economy and inequality: Wage polarization, unemployment, and occupation transition in Taiwan since 1980. Journal of Asian Economics 20, 120–136 (2009).
[11]. Wang, J.J., Yu, G.J.: Measure of development level of our country digital economy and regional comparison. China's circulation economy 35(08), 3-17 (2021).
[12]. Marasco, Picucci, Romano.: Market share dynamics using Lotka-Volterra models, Technol. Forecast. Soc. Change 105, 49-62 (2016).
[13]. Romano.: A study of tourism dynamics in three Italian regions using a nonautonomous integrable Lotka–Volterra model, PloS One 11 (2016).
[14]. Zhang, X.L., Wu, T.T.: Research on spatial differentiation pattern of digital economy development in Chinese provinces. Research the world (10), 34-40 (2019).
Cite this article
Jia,Y. (2023). The Research of the Relationship between Unemployment, Digital Economy and Renewable Energy ——based on the Competition Model in China. Advances in Economics, Management and Political Sciences,6,111-119.
Data availability
The datasets used and/or analyzed during the current study will be available from the authors upon reasonable request.
Disclaimer/Publisher's Note
The statements, opinions and data contained in all publications are solely those of the individual author(s) and contributor(s) and not of EWA Publishing and/or the editor(s). EWA Publishing and/or the editor(s) disclaim responsibility for any injury to people or property resulting from any ideas, methods, instructions or products referred to in the content.
About volume
Volume title: Proceedings of the 2022 International Conference on Financial Technology and Business Analysis (ICFTBA 2022), Part 2
© 2024 by the author(s). Licensee EWA Publishing, Oxford, UK. This article is an open access article distributed under the terms and
conditions of the Creative Commons Attribution (CC BY) license. Authors who
publish this series agree to the following terms:
1. Authors retain copyright and grant the series right of first publication with the work simultaneously licensed under a Creative Commons
Attribution License that allows others to share the work with an acknowledgment of the work's authorship and initial publication in this
series.
2. Authors are able to enter into separate, additional contractual arrangements for the non-exclusive distribution of the series's published
version of the work (e.g., post it to an institutional repository or publish it in a book), with an acknowledgment of its initial
publication in this series.
3. Authors are permitted and encouraged to post their work online (e.g., in institutional repositories or on their website) prior to and
during the submission process, as it can lead to productive exchanges, as well as earlier and greater citation of published work (See
Open access policy for details).
References
[1]. Bian, C.P.: Simulation research of creative destruction effect of renewable energy development to employ-ment of our country. Ocean University of China (2013).
[2]. Jiang, C.L., Yang, L.C., Xie, J., Author, Adrain Ely.: Research on "green unemployed group" from the per-spective of resilience. Guizhou Social Sciences (11), 135-142 (2018).
[3]. Chen, Y., Author, Peng, W.: Renewable energy investment and employment in China. Quarterly Journal of Political Economy 4(02), 133-156 (2021).
[4]. Behnaz S., Hassan, F., Gholipour, E.R., Omid, R.: Renewable energy sources and unemployment rate: Evidence from the US states. Energy Policy 168, 113155(2022).
[5]. Khobai, H., Kolisi, N., Moyo, C., Anyikwa, I., Dingela, S.: Renewable energy consumption and unemployment in South Africa. Int. J. Energy Econ. Pol 10 (2), 170–178 (2020).
[6]. Murshed, M.: An empirical analysis of the non-linear impacts of ICT-trade openness on renewable energy transition, energy efficiency, clean cooking fuel access and environmental sustainability in South Asia. Environmental Science and Pollution Research 27(29), 36254-36281 (2020).
[7]. Liu, Y.W., Wang, W.Q., Wu, Y., Zhang, J. N.: How does digital economy affect green total factor productivity? Evidence from China.Science of the total environment 159428 (2022).
[8]. Hamed, M.A., Mohammad, S. B.: Examining the effects of digital technology expansion on Unemployment: A cross-sectional investigation. Technology in Society 64, 101495(2021).
[9]. Shi, B., Li, Y. X., Yu, X.H., Yan, W.: Short-term load forecasting based on modified particle swarm optimizer and fuzzy neural network model. Systems Engineering-Theory and Practice 30(1), 158-160 (2010).
[10]. Wang, W.C.: Information economy and inequality: Wage polarization, unemployment, and occupation transition in Taiwan since 1980. Journal of Asian Economics 20, 120–136 (2009).
[11]. Wang, J.J., Yu, G.J.: Measure of development level of our country digital economy and regional comparison. China's circulation economy 35(08), 3-17 (2021).
[12]. Marasco, Picucci, Romano.: Market share dynamics using Lotka-Volterra models, Technol. Forecast. Soc. Change 105, 49-62 (2016).
[13]. Romano.: A study of tourism dynamics in three Italian regions using a nonautonomous integrable Lotka–Volterra model, PloS One 11 (2016).
[14]. Zhang, X.L., Wu, T.T.: Research on spatial differentiation pattern of digital economy development in Chinese provinces. Research the world (10), 34-40 (2019).