


1. Introduction
The global greenhouse effect has attracted widespread attention. Energy conservation and carbon reduction is imperative.In China, carbon reduction has also received widespread attention. China is in a stage of rapid development and has a large total carbon emissions. The central government has issued multiple documents emphasizing the importance of green and low-carbon development, and has set "dual carbon" goals. In recent years, China's carbon emission intensity has gradually decreased. China's carbon emission intensity in 2020 decreased by 48.4% compared to 2005, making it one of the countries with the fastest reduction in global energy consumption intensity.
Government supervision and guidance plays a prominent role in low-carbon development, while urban local governments are the smallest unit and one of the most important implementers of carbon reduction [1-2]. Previous studies have been limited by data availability, mostly based on provincial data, but in recent years, due to the government's increased attention to low carbon, the relevant statistics have been gradually improved, providing a possibility for in-depth research on the carbon reduction mechanism at the level of Prefecture-level city.
Located in South China, Guangdong Province has 21 prefectural-level cities and well-developed secondary and tertiary industries, with electronics and information, green petrochemicals and advanced materials as the main industries. Guangdong Province has an important position in China's development. Based on information provided by the China's National Bureau of Statistics, as of 2022, Guangdong Province has ranked first in the country in terms of total GDP for 34 consecutive years, and the number of permanent residents has remained the first in China for many years.
Guangdong Province attaches high importance to green innovation and actively promotes green and low-carbon development, which is one of the key factors for Guangdong's rapid low-carbon development. It has taken the lead in the country in implementing an ecological civilisation construction assessment system, continually pushed for the modernization of its manufacturing infrastructure and the research and development of new energy sources, taking advantage of its proximity to the sea to develop offshore wind power on a large scale, and actively developing natural gas power generation and photovoltaic power generation. According to the science and technology statistics of Guangdong Province, from 2000 to 2019, the proportion of financial expenditure on science and technology in the total local financial expenditure of Guangdong Province has increased from 3.6% to 6.8%. Its investment in R&D expenditure exceeded 100 billion yuan in 2021, ranking first in the country, the comprehensive capacity of regional innovation and the amount of effective green invention patents have ranked first in the country for many years as well.
As can be seen from the above, low carbon development is an inevitable choice for future economic development, and Guangdong Province, as the front-runner of China's low carbon development, has made extraordinary achievements. So it is important to study the influencing factors of low carbon development in Guangdong Province for the high-quality development of Guangdong Province, and for the achievement of China's dual-carbon goals.
2. Literature review
In recent years, carbon emissions have become a research hotspot at home and abroad [3-5]. Regarding the influence of economic factors on carbon emissions, there is a mature and representative result in academia - the environmental Kuznets curve, which means environmental pollution will first gradually increase with economic development and then gradually decrease after reaching the peak [6-8].
At the city level, urban electricity use, transport and urbanisation are the main factors affecting carbon emissions. According to the Ministry of Energy of China, energy combustion accounts for about 88 per cent of all carbon dioxide emissions, and emissions from the power sector in turn account for about 41 per cent of energy sector emissions.Transport emissions account for about 10 per cent of China's total carbon emissions. According to the Chinese government website, China's urbanisation rate will have exceeded 60% by 2020. Some current scholars arguing that there is an inverted U-shape relationship between urbanisation and carbon emissions efficiency [9-10]. Unemployment rate is also closely related to economic development and social consumption. When unemployment rate is high, people may reduce their consumption of luxury goods, which in turn reduces carbon emission intensity. But high unemployment rate also implies low level of production and inefficient use of energy, thus the intensity of carbon emission may increase [11-12].
The intensity of foreign capital also has an impact on carbon emissions. According to the technology spillover theory proposed by Blomstrm and Kokko (1998) [13], the use of foreign capital will bring new technology and management methods, promote production efficiency and reduce carbon emission intensity. But according to the theory of pollution paradise, foreign capital is more inclined to flow to the highly polluting but highly profitable heavy industrial enterprises, which will exacerbate the carbon emission.
Government intervention in carbon emissions can be divided into two main aspects: policies and expenditures. China's fiscal policies related to carbon emissions mainly include low-carbon city pilot policies, carbon trading market policies, carbon taxes, and carbon subsidies. Regarding the role of fiscal expenditure on carbon emissions, on the one hand, the scale of fiscal expenditure promotes carbon emissions, while on the other hand, the type of fiscal expenditure suppresses carbon emissions [14]. In addition, there are geospatial differences in the impact of fiscal expenditure on carbon emissions [15].
The key to carbon reduction is technological innovation, which in turn promotes efficiency, but research and development has an uncertain and long-term nature make it difficult for enterprises to afford, and its externalities determine the important role of government in promoting green innovation in enterprises. Financial expenditure on science and technology promotes the development of basic science and subsidises enterprise innovation, which can alleviate this externality to a certain extent. However, the technological innovation can bring both economic and environmental attributes. The technology with economic property will enhance carbon emissions, while the technology with environmental property will inhibit carbon emissions [16]. Therefore, the comprehensive carbon reduction effect of fiscal S&T expenditures is uncertain and worth discussing. However, there is little literature on the impact of a specific type of government expenditure, such as the fiscal S&T expenditures, on carbon emissions [17], and they does not deeply study the mechanism of the role. Therefore, this paper puts forward hypothesis 1: the increase of local government financial expenditure on science and technology will promote the reduction of carbon emission intensity.
Regarding the research on the impact of science and technology innovation on carbon emissions, scholars mainly use research and development expenditure, patent publication and pollutant reduction to measure the level of innovation to study the impact of science and technology innovation on carbon emissions. Research shows [18], green innovation can be divided into three categories based on the means of innovation: technology, system, and business. Green technology innovation can save energy and protect the environment; green system innovation from the macro level, guides or forces people to reduce emissions through institutional and government forces; green business innovation with the help of innovations in products, processes, and management, to reduce the energy consumption and waste of production.
The level of advanced industrial structure is also an important influence factor of carbon emissions. Many studies have pointed out that the current level of advanced industrial structure in most regions of China is still relatively low, which hinders the development of a low-carbon economy [19-20].
Consequently, this paper puts forward hypothesis 2: the increase of local government financial expenditure on science and technology will promote the level of green innovation and high-tech level to improve, and then reduce the intensity of carbon emissions.
In summary, based on the fixed panel model, this paper studies the carbon emission reduction attributes of local government financial science and technology expenditures with 21 cities in Guangdong Province from 2000 to 2019, and further analyses the role mechanism, and finally puts forward relevant suggestions for the results. The following figure 1 shows the research framework of this paper and figure 2 shows the mechanism by which fiscal science and technology expenditure affect carbon emissions:
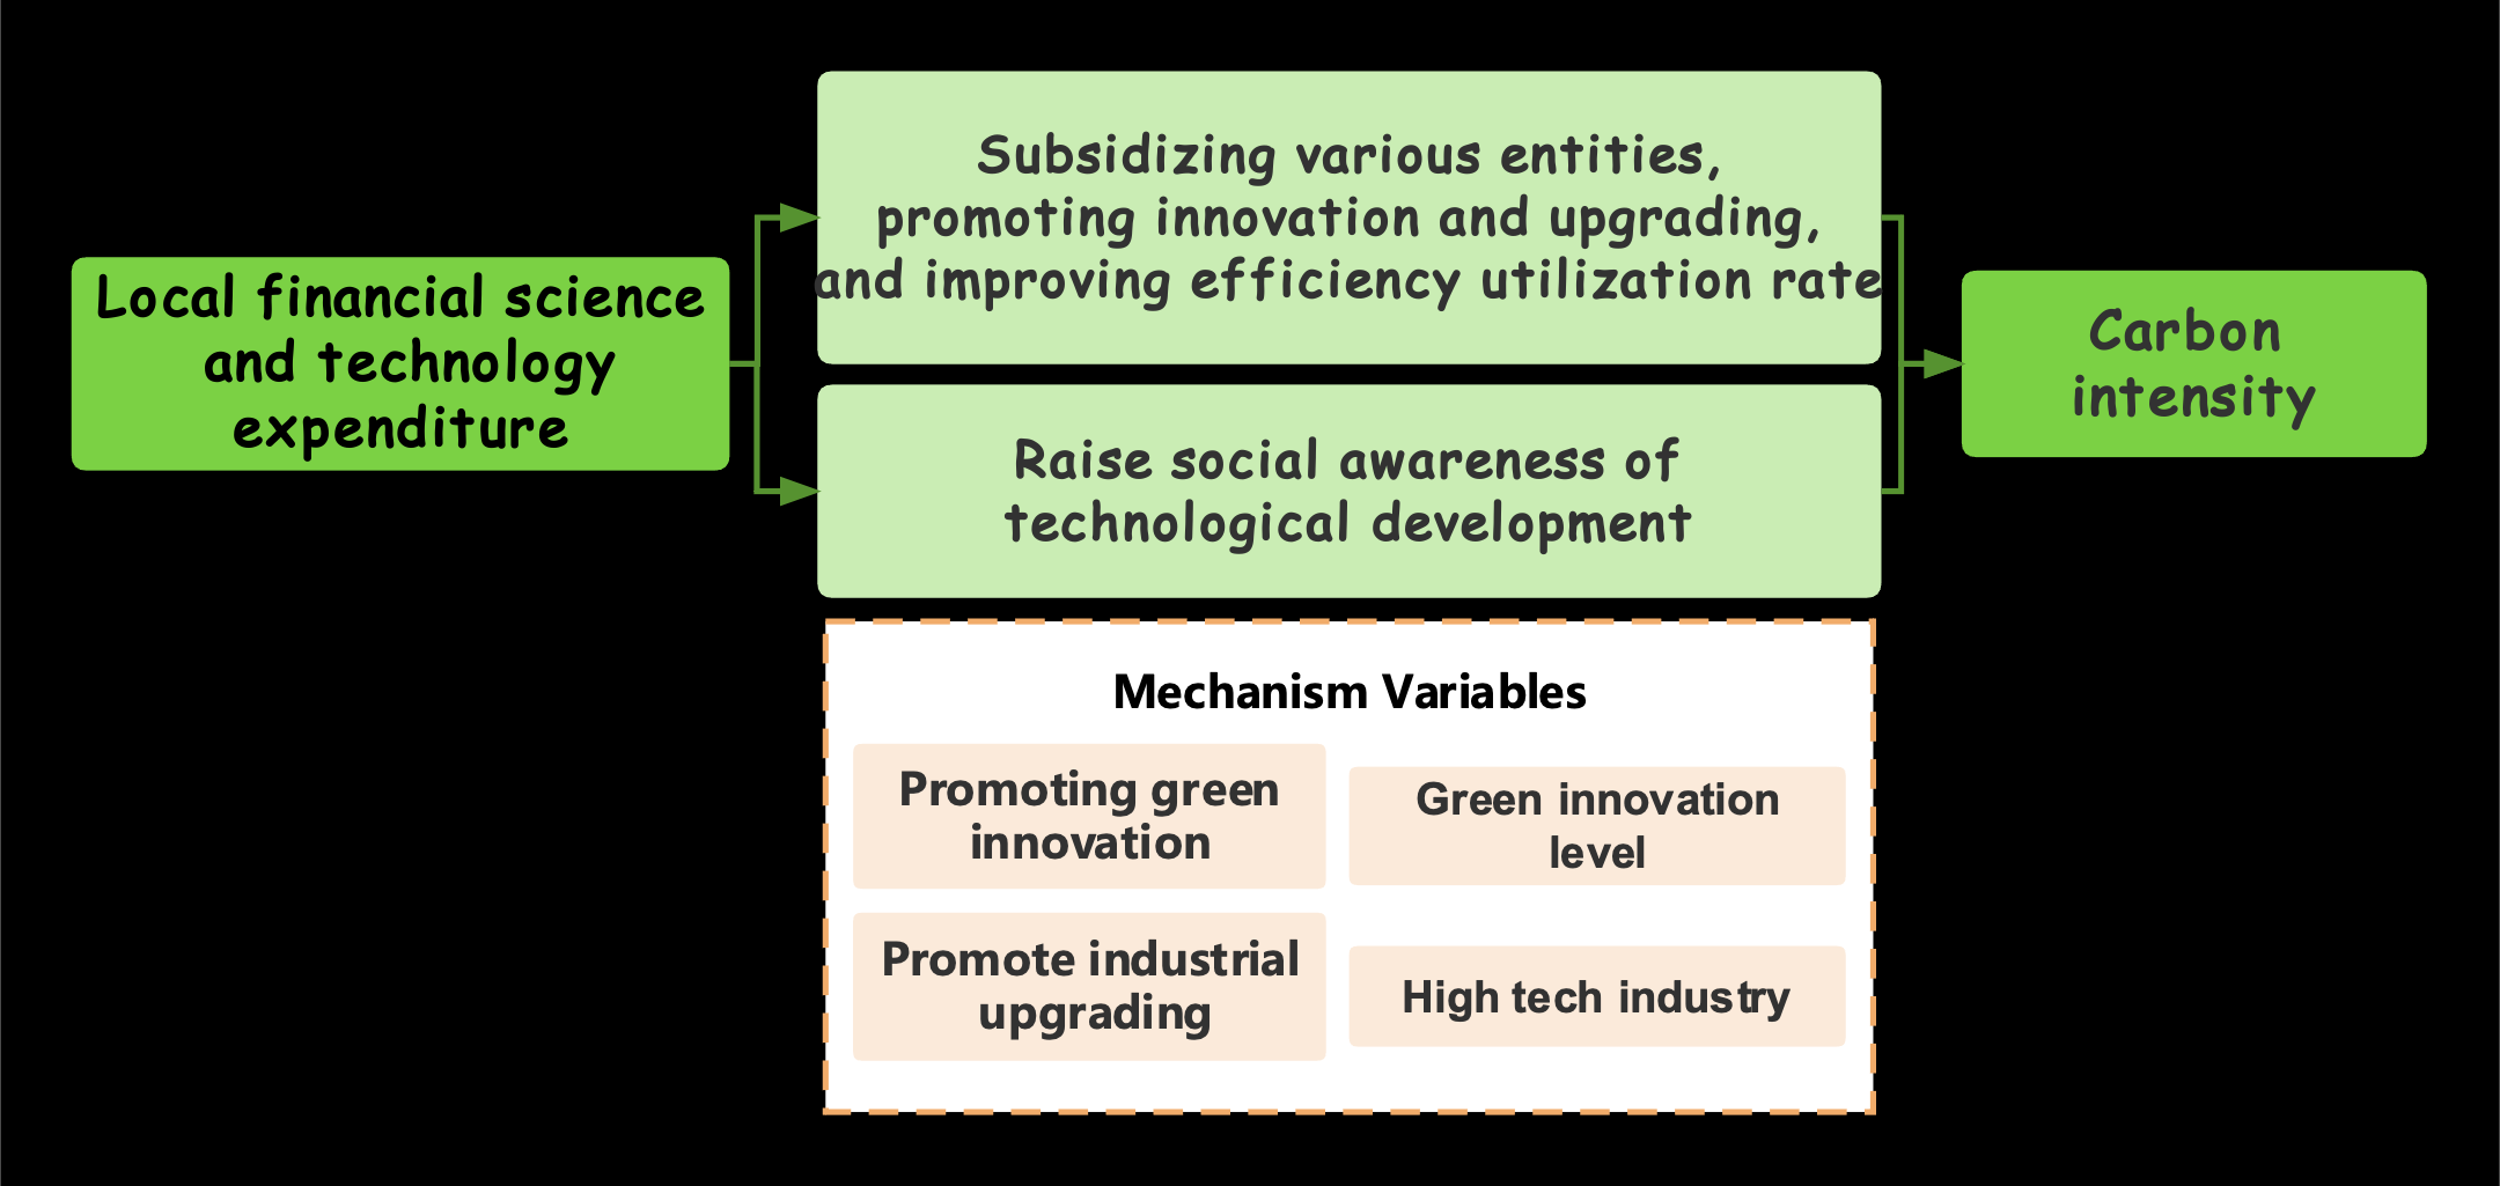
Figure 1: Research framework

Figure 2: The impact of fiscal science and technology expenditure on carbon emissions
3. Variable and model selection
3.1. Variable selection and calculation
This study takes 2000-2019 as the sample period and selects 21 cities in Guangdong Province as the study sample.
The dependent variable is carbon dioxide emission intensity. Relevant data are from CEADs database. The amount of local government financial expenditure on science and technology is used as independent variable. Control variables is selected according to the analysis of the literature review. The data were collected manually from Guangdong Provincial Statistical Yearbook and Guangdong Provincial Department of Science and Technology.
Regarding green innovation, the State Intellectual Property Office of China classifies patents into three categories: invention, utility model and design. Invention patents are the most difficult to obtain and have a relatively large value; utility model patents are application-oriented and have a lower technological content than invention patents, but still have a greater role in environmental protection; and design inventions do not seem to have a significant role in the environment. Therefore, only invention and utility model patent data are used in this study. The two types of patent data were obtained from the China Patent Publication Bulletin Network of the State Intellectual Property Office (SIPO) using Python 3.9 software.
Regarding the industrial structure, high-tech industry has great potential in carbon saving and emission reduction, and the research and development of high-tech products can effectively promote the improvement of energy utilisation effect, which in turn reduces the intensity of carbon emission [21-22], Therefore, this paper investigates the mechanistic role of the level of high-tech, and the relevant data are obtained from Guangdong Provincial Department of Department of Science and Technology.
The symbols, definitions and calculations for each variable are shown in table 1:
Table 1: Descriptive table of research variables
Variables | Symbols | Variable definition | Calculation method |
Implicit variable | ln_ECI | Carbon dioxide emission intensity | ln (CO2 emissions (kg)/Gross regional product ($ million)) |
ln_CE | Carbon dioxide emissions | ln (CO2 emissions (million tonnes)) | |
Independent variable | ETech | Financial expenditure on science and technology | Financial expenditure on science and technology ($ million) |
PETech | Percentage of fiscal expenditure on science and technology | (Fiscal expenditure on science and technology (yuan)/Total fiscal expenditure (yuan)) % | |
R&D | Social R&D funding | Funding for social research and experimental development ($ billion) | |
Instrumental variable | NTP | Number of R&D staff | Number of R&D staff (persons) |
PET'(t-1) | Influence of foreign municipal financial expenditures on science and technology | Average of the amount of financial expenditure on science and technology in the previous year in foreign municipalities | |
SIEi | Digital Economy Innovation and Entrepreneurship Index | Digital Economy Innovation and Entrepreneurship Index | |
Controlled variable | ln_perGDP | Level of economic development | ln (GDP (million yuan)/Resident population (10,000 persons)) |
ln_Electricity | Electricity consumption intensity | ln (Electricity consumption (billion kilowatt hours)) | |
ln_FDI | Foreign capital intensity | ln (Amount of foreign capital actually used (US$ million)) | |
ln_Ptransport | Traffic intensity | Citywide passenger traffic (10,000 people) | |
Unemployed | Unemployment level | Number of registered unemployed persons in urban areas at the end of the year (10,000 persons)/Total population at the end of the year (10,000 persons) ‰ | |
Urbanisation | urbanisation level (of a city or town) | Ratio of urban population to resident population by municipality % | |
Mechanism variables | GIL | Level of green innovation | Total number of green inventions (pieces) + Green utility models (pieces) obtained in the year |
GI1 | Green inventions and innovations | Number of green inventions acquired during the year (pieces) | |
GI2 | Green utility model innovations | Number of green utility models awarded in the year (pieces) | |
H/I | Percentage of high-tech industries | Gross value of high-tech products (billion yuan)/Gross industrial output value (billion yuan) |
For missing values, the study used stata 17.0 metrology software to fill in using interpolation method. To mitigate the effect of heteroskedasticity, the non-proportional variables were logarithmically treated.
3.2. Selection of models and research methods
There are differences in unobservable factors such as geographic location and leader preferences among cities, so this paper uses a fixed-effects model to control for individuals in order to eliminate the effects of differences across cities.
The model may be endogenous because the higher carbon intensity of the region may also prompt the government to increase the share of expenditure on science and technology, that means there is a two-way causality problem, and there may be variables omitted that are not considered in this study; on the other hand, the change in the share of fiscal expenditure on science and technology may be greater as the output value of the region increases, so the model may have a heteroskedasticity problem.
In summary, this study uses a fixed panel model with heteroskedasticity robust standard errors:
\( {y_{it}}=α+{β_{1}}{x_{it}}+γ{Con\_x_{it}}+{ε_{it}} \)
Where \( {y_{it}} \) is the dependent variable of the equation, \( {x_{it}} \) is the independent variable of the equation, \( {Con\_x_{it}} \) is a set of control variables, \( {ε_{it}} \) is the error term.
4. Empirical research
4.1. Benchmark regression
This model is constructed to test the impact of fiscal S&T expenditure on carbon emission intensity:
\( {ln\_CEI_{it}}=α+{β_{1}}{ln\_ETech_{it}}+γ{Con\_x_{it}}+{ε_{it}} \) (1)
Where \( {ln\_CEI_{it}} \) is the logarithm of the city \( i \) 's carbon emission intensity in year \( t \) , and \( {ln\_ETech_{it}} \) is the logarithm of the city \( i \) 's fiscal expenditure on S&T.
From the table 3, the regression results of the three models all show a significant negative correlation between fiscal S&T expenditures and carbon emission intensity. From the regression results of the fixed model, it can be seen that the correlation coefficient between fiscal S&T expenditures and carbon emission intensity is -0.221, and passed the significance test at 1% confidence level, which indicates that the fiscal S&T expenditures of the local government can reduce the carbon emission intensity. Specifically, for every 1 per cent increase in local government fiscal S&T expenditures, carbon emission intensity decreases by 0.221 per cent.
Table 3: Benchmark regression
Model | POOL | Random effect model | Fixed Effects Model |
VARIABLES | ln_CEI | ln_CEI | ln_CEI |
ln_ETech | -0.142*** | -0.216*** | -0.221*** |
(-2.96) | (-3.10) | (-3.11) | |
ln_perGDP | -0.564*** | -0.691** | -0.761** |
(-5.87) | (-2.56) | (-2.28) | |
ln_Electricity | 0.450*** | 0.832*** | 0.918*** |
(6.42) | (3.24) | (2.93) | |
ln_FDI | -0.159*** | -0.109*** | -0.099** |
(-5.20) | (-2.60) | (-2.51) | |
ln_Ptransport | 0.083** | 0.087* | 0.089* |
(2.31) | (1.82) | (1.82) | |
Unemployed | 1.141*** | 0.763 | 0.696 |
(5.58) | (1.61) | (1.32) | |
Urbanisation | -0.002 | -0.009 | -0.008 |
(-1.13) | (-0.87) | (-0.67) | |
Constant | 8.417*** | 8.654*** | 8.902*** |
(12.31) | (5.45) | (4.64) | |
Observations | 420 | 420 | 420 |
Number of City | 21 | 21 | 21 |
R-squared | 0.476 | 0.3792 | 0.466 |
Robust t-statistics or z-statistics in parentheses
*** p<0.01, ** p<0.05, * p<0.1
4.2. Robustness tests
In this study, robustness analyses were conducted by replacing the dependent and independent variables.
\( {ln\_CE_{it}}=α+{β_{1}}{ln\_ETech_{it}}+γ{Con\_x_{it}}+{ε_{it}} \) (2)
\( {ln\_CEI_{it}}=α+{β_{1}}{PETech_{it}}+γ{Con\_x_{it}}+{ε_{it}} \) (3)
\( {ln\_CEI_{it}}=α+{β_{1}}{RD_{it}}+γ{Con\_x_{it}}+{ε_{it}} \) (4)
Where \( {ln\_CE_{it}} \) is the logarithm of the total carbon emissions of the city \( i \) in year \( t \) , \( {PETech_{it}} \) is the share of S&T expenditures in the city's fiscal expenditures of the city \( i \) in year \( t \) , \( {RD_{it}} \) is the logarithm of the amount of total R&D investment of the city \( i \) in the year \( t \) .
The results are shown in the table 4, and there is a significant negative correlation between the core dependent and independent variables in this three models, which proves that the findings of this study are not coincidental and are highly robust. It can also be concluded that an increase in the proportion of fiscal expenditure on S&T in fiscal expenditure also contributes to the reduction of carbon emission intensity.
Table 4: Robustness test regression results with replacement of independent and dependent variables
Model | Fixed Effects Model | Fixed Effects Model | Fixed Effects Model |
VARIABLES | ln_CE | ln_CEI | ln_CEI |
ln_ETech | -0.089** | ||
(-2.21) | |||
PETech | -0.048*** | ||
(-2.94) | |||
R&D | -0.001*** | ||
(-3.95) | |||
X_control | Yes | Yes | Yes |
Constant | 0.000 | 9.046*** | 8.219*** |
(0.00) | (4.24) | (4.20) | |
Observations | 420 | 420 | 420 |
Number of City | 21 | 21 | 21 |
R-squared | 0.808 | 0.433 | 0.479 |
Robust t-statistics in parentheses
*** p<0.01, ** p<0.05, * p<0.1
4.3. Endogeneity test
In this study, the instrumental variable method is used for endogeneity test. The average value of the amount of financial S&T expenditure in the previous year in the other cities (IV1), the innovation and entrepreneurship index of China's digital economy (IV2), and the number of R&D personnel (IV3) are chosen as instrumental variables. Due to group pressure, herd mentality and learning effect, the amount of fiscal S&T expenditures in the current year in the city may be affected by the amount of fiscal S&T expenditures in the previous year in the foreign city [17]. Fiscal S&T expenditures will promote enterprises to increase R&D investment and promote innovation and entrepreneurship [23]. Higher fiscal S&T expenditures and adequate funding for R&D units will attract more R&D personnel to the city. While the fiscal S&T expenditures in the previous year in the other cities, an increase in entrepreneurship and R&D personnel will not directly affect carbon emission intensity.
\( {ln\_ETech_{it}}={α_{0}}+{α_{1}}{IVn_{it}}+γ{Con\_x_{it}}+{ε_{it}}, n=1,2,3 \) (5)
\( {ln\_CEI_{it}}={β_{0}}+{β_{1}}\hat{{ln\_ETech_{it}}}+γ{Con\_x_{it}}+{ε_{it}} \) (6)
The results of the tests in table 5 and table 6 show that IV1, IV2 and IV3 have passed the unidentifiable test and the weak instrumental variable test, and the regression results of the adjusted core explanatory variables on the dependent variable remain significant.
Table 5: Results of the first stage regression of the instrumental variables method
VARIABLES | IV1 (PET'(t-1)) | IV2 (SIEi) | IV3 (NTP) |
ln_ETech | 0.979*** | 0.067*** | 0.000*** |
T-value | 47.78 | (41.57) | (8.47) |
X_control | Yes | Yes | Yes |
Observations | 399 | 420 | 420 |
F-value | 2282.86 | 1728.01 | 71.79 |
P-value | (0.0000) | (0.0000) | (0.0000) |
Robust t-statistics in parentheses
*** p<0.01, ** p<0.05, * p<0.1
Table 6: Results of the second-stage regression of the instrumental variables approach
VARIABLES | ln_CEI | ||
\( \hat{ln\_ETech} \) | -0.261*** | -0.212*** | -0.421*** |
Z-value | (-13.19) | (-11.79) | (-16.88) |
X_control | Yes | Yes | Yes |
Observations | 399 | 420 | 420 |
F-value | 173.55 | 138.77 | 284.10 |
P-value | (0.0000) | (0.0000) | (0.0000) |
Underidentification test (Kleibergen-Paap rk LM statistic) | 191.417 | 174.407 | 40.954 |
P-value | 0.0000 | 0.0000 | 0.0000 |
Weak identification test (Kleibergen-Paap rk Wald F statistic) | 2282.862 | 1728.011 | 71.786 |
Robust z-statistics in parentheses
*** p<0.01, ** p<0.05, * p<0.1
4.4. Mechanistic regression analyses
Based on previous literature and theoretical analyses, this study takes the level of green innovation and industrial structure as mechanism variables to analyse in depth the mechanism of the inhibitory effect of the fiscal S&T expenditures on carbon emission intensity. Due to the limitations of the traditional stepwise regression method for testing the mediating mechanism, this paper draws on the practice of Wen Zhonglin and Baojuan (2014)[24] and adopts the Bootstrap test method, which is a 1000-times random sampling of samples, and uses the extracted samples to carry out the following test of the mechanism effect equation set, to get the upper and lower bounds of coefficient intervals ab in the confidence interval with a confidence level of 95%.
\( {ln\_CEI_{it}}=c{ln\_ETech_{it}}+γ{Con\_x_{it}}+{ε_{it}} \) (7)
\( {M_{it}}=a{ln\_ETech_{it}}+γ{Con\_x_{it}}+{ε_{it}} \) (8)
\( {ln\_CEI_{it}}=c \prime {ln\_ETech_{it}}+b{M_{it}}+γ{Con\_x_{it}}+{ε_{it}} \) (9)
Where \( {M_{it}} \) is the mechanism variable.
4.4.1. Level of green innovation
As can be seen from table 7, table 8 and table 9, the confidence intervals for the overall level of green innovation and the levels of the two types of innovation do not contain 0, indicating that the indirect effect is significant, which means the increase in fiscal S&T expenditures reflects the role of carbon emission reduction by promoting the increase in the level of green innovation.
Table 7: Bootstrap test results of GIL
Mechanism variables: GIL | Coefficient | 95% Confidence Interval |
Indirect Effect | -0.090*** | [-0.137, -0.511] (P) [-0.138, -0.524] (BC) |
Direct Effect | -0.048 | [-0.148, 0.059] (p) [-0.144, 0.063] (BC) |
Note: P: Percentile, BC: Bias-corrected. The same below.
Table 8: Bootstrap test results of GI1
Mechanism variables: GI1 | Coefficient | 95% Confidence Interval |
Indirect Effect | -0.098*** | [-0.146, -0.508] (P) [-0.153, -0.552] (BC) |
Direct Effect | -0.041 | [-0.131, 0.053] (P) [-0.136, 0.052] (BC) |
Table 9: Bootstrap test results of GI2
Mechanism variables: GI2 | Coefficient | 95% Confidence Interval |
Indirect Effect | -0.083*** | [-0.127,-0.047] (p) [-0.123,-0.042] (BC) |
Direct Effect | -0.055 | [-0.151, 0.052] (P) [-0.153, 0.044] (BC) |
4.4.2. Industrial structure
As can be seen from table 10, the confidence intervals for both the direct and indirect effects of the level of high technology do not contain 0, which means financial expenditure on S&T can not only directly reduce the intensity of carbon emissions, but also significantly contribute to the increase in the proportion of high technology in industry to indirectly reduce the intensity of carbon emissions.
Table 10: Bootstrap test results of H/I
Mechanism variables: GIL | Coefficient | 95% Confidence Interval |
Indirect Effect | -0.033** | [-0.061, -0.003] (p) [-0.064, -0.005] (BC) |
Direct Effect | -0.109** | [-0.202, -0.010] (P) [-0.208, -0.019] (BC) |
5. Conclusions
The results of this study show that increasing fiscal S&T expenditures can mitigate the costs and risks of technological innovations, compensate for the external benefits of innovations, and promote social innovations, and this promotion effect is greater for S&T innovations with environmental attributes than for S&T innovations with purely economic attributes that have a negative impact on the environment, in short, an increase in the share of fiscal S&T expenditures as a whole is shown to inhibit the intensity of carbon emissions.
The high-quality development of the economy has made obvious progress, which to a certain extent has been manifested in reducing the intensity of carbon emissions; the use of electricity in urban areas still lurks a huge potential for emission reduction; the use of foreign investment as a whole shows a carbon reduction effect; and the impact of urbanisation on carbon emissions is not yet obvious.
Through further mechanism analysis, the mechanism of carbon emission reduction effect of financial S&T expenditure is to improve the level of green innovation, while promoting the acquisition of invention patents and utility model patents, and promoting the upgrading of industrial structure, increasing the proportion of new and high technology products, and then suppressing the intensity of carbon emissions.
6. Recommendations
Local governments should recognise the important role of S&T innovation in the development of a low-carbon economy, reduce the unnecessary part of financial expenditure and increase the proportion of financial expenditure on S&T.
In terms of the targets of fiscal expenditure on S&T, local governments should give more consideration to the environmental attributes of innovation, and subsidies should be tilted towards green scientific research projects, so as to promote the level of green innovation in the region. But government should also pay attention to identifying the situation of “greenwashing”. In terms of technological transformation, the government can appropriately subsidise enterprises that purchase green patents and follow up on the results of their technological applications. The government should also endeavour to break down information barriers, facilitate information exchange and technology development, and encourage regions with a high degree of low-carbon development to work together with other regions.
Development relies on resources. The government should focus on the research and development of new energy sources, accelerate the reduction of the use of fossil energy sources and improve the efficiency of energy use by promoting efficiency progress and technological advancement, in addition to advocating citizen to conserve electricity.
In terms of capital utilisation, the government should increase the standard requirements for the use of foreign capital and be wary of the "pollution paradise" trap. In addition, government can formulate a tax reduction policy to guide the investment of capital into the clean energy industry.
In terms of industrial development, local governments should focus on promoting the development of tertiary industries with higher added value and less environmental pollution, and high-tech industries with huge potential for carbon reduction should be given more attention by the government, which should supervise the transformation and upgrading of high-energy-consuming enterprises.
References
[1]. Fudge, S., & Peters, M. (2009). Motivating carbon reduction in the UK: the role of local government as an agent of social change. Journal of Integrative Environmental Sciences, 6(2), 103-120. doi: 10.1080/19438150902851331
[2]. McGuirk, P., Dowling, R., Brennan, C., & Bulkeley, H. (2015). Urban carbon governance experiments: the role of Australian local governments. Geographical research, 53(1), 39-52. doi: 10.1111/1745-5871.12076
[3]. Stern, N., & Stern, N. H. (2007). The economics of climate change: the Stern review. Cambridge University Press. doi: 10.1017/ CBO9780511817434
[4]. Du, L., Wei, C., & Cai, S. (2012). Economic development and carbon dioxide emissions in China: Provincial panel data analysis. China Economic Review, 23(2), 371-384. doi: 10.1016/j.chieco.2012.02.003
[5]. Vermeulen, S. J., Campbell, B. M., & Ingram, J. S. (2012). Climate change and food systems. Annual review of environment and resources, 37, 195-222. doi: 10.1146/annurev-environ-020411-130608
[6]. Shahbaz, M., Lean, H. H., & Shabbir, M. S. (2012). Environmental Kuznets curve hypothesis in Pakistan: cointegration and Granger causality. Renewable and Sustainable Energy Reviews, 16(5), 2947-2953. doi: 10.1016/j.rser.2012.02.015
[7]. Apergis, N., & Ozturk, I. (2015). Testing Environmental Kuznets Curve hypothesis in Asian countries. Ecological Indicators, 52, 16-22. doi:10.1016/j.ecolind.2014.11.026
[8]. Xu, G. Y., Dong, H. Y., Xu, Z. C., & Bhattarai, N. (2022). China can reach carbon neutrality before 2050 by improving economic development quality. Energy, 243, 12. doi:10.1016/j.energy.2021.123087
[9]. Liddle, B. Impact of population, age structure, and urbanization on carbon emissions/energy consumption: evidence from macro-level, cross-country analyses. Popul Environ 35, 286–304 (2014). https://doi.org/10.1007/s11111-013-0198-4
[10]. Sun, W., & Huang, C. (2020). How does urbanization affect carbon emission efficiency? Evidence from China. Journal of Cleaner Production, 272, 122828. Retrieved from https://www.sciencedirect.com/science/article/pii/S0959652620328730. doi:https://doi.org/10.1016/j.jclepro.2020.122828
[11]. Wang, Q., & Li, L. (2021). The effects of population aging, life expectancy, unemployment rate, population density, per capita GDP, urbanization on per capita carbon emissions. Sustainable Production and Consumption, 28, 760-774. doi: 10.1007/s11356-019-04997-6
[12]. Cui, Y., Wang, G., Irfan, M., Wu, D., & Cao, J. (2022). The effect of green finance and unemployment rate on carbon emissions in China. Front Environ Sci, 10, 887341. doi: 10.3389/fenvs.2022.887341
[13]. Blomstrom, M. and Kokko, A. (1998) Multinational Corporations and Spillovers. Journal of Economic Surveys, 12, 247-277. doi.org/10.1111/1467-6419.00056
[14]. Wang, J., & Li, H. (2019). The mystery of local fiscal expenditure and carbon emission growth in China. Environmental Science and Pollution Research, 26, 12335-12345. doi: 10.1007/s11356-019-04558-w
[15]. Cheng, S. L., Chen, Y. T., Meng, F. X., Chen, J. D., Liu, G. Y., & Song, M. L. (2021). Impacts of local public expenditure on CO2 emissions in Chinese cities: A spatial cluster decomposition analysis. Resources Conservation and Recycling, 164, 19. doi:10.1016/j.resconrec.2020.105217
[16]. Li, M., & Wang, Q. (2017). Will technology advances alleviate climate change? Dual effects of technology change on aggregate carbon dioxide emissions. Energy for Sustainable Development, 41, 61-68. doi: 10.1016/j.esd.2017.08.008
[17]. Zhu, Y., Liu, Z., Feng, S., & Lu, N. (2022). The role of fiscal expenditure on science and technology in carbon reduction: Evidence from provincial data in China. Environmental Science and Pollution Research, 29(54), 82030-82044. doi: 10.1007/s11356-022-20087-5
[18]. Fei, J., Wang, Y., Yang, Y., Chen, S., & Zhi, Q. (2016). Towards eco-city: the role of green innovation. Energy Procedia, 104, 165-170. doi: https://doi.org/10.1016/j.egypro.2016.12.029
[19]. Cheng, Z., Li, L., & Liu, J. (2018). Industrial structure, technical progress and carbon intensity in China's provinces. Renewable and Sustainable Energy Reviews, 81, 2935-2946. doi: 10.1016/j.rser.2017.08.078
[20]. Zhu, X. (2022). Have carbon emissions been reduced due to the upgrading of industrial structure? Analysis of the mediating effect based on technological innovation. Environmental Science and Pollution Research, 29(36), 54890-54901. doi: 10.1007/s11356-022-20022-w
[21]. Kong, L., Hasanbeigi, A., & Price, L. (2016). Assessment of emerging energy-efficiency technologies for the pulp and paper industry: a technical review. Journal of Cleaner Production, 122, 5-28. doi: org/10.1016/j.jclepro.2015.12.116
[22]. Xu, B., & Lin, B. (2018). Investigating the role of high-tech industry in reducing China's CO2 emissions: A regional perspective. Journal of Cleaner Production, 177, 169-177. doi:10.1016/j.jclepro.2017.12.174
[23]. Guellec, D., & Van Pottelsberghe De La Potterie, B. (2003). The impact of public R&D expenditure on business R&D. Economics of innovation and new technology, 12(3), 225-243. https://doi.org/10.1080/10438590290004555
[24]. Wen, Zhonglin, & Ye, Baojuan (2014). Mediation effects analysis: methodology and model development. Advances in Psychological Science, 22(05):731-745.
Cite this article
Xinqi,Z.;Yanxia,Y.;RongSheng,W. (2024). What is the Impact of Fiscal Technology Expenditure on Carbon Emission Reduction? Evidence from Guangdong Province in China. Advances in Economics, Management and Political Sciences,67,50-61.
Data availability
The datasets used and/or analyzed during the current study will be available from the authors upon reasonable request.
Disclaimer/Publisher's Note
The statements, opinions and data contained in all publications are solely those of the individual author(s) and contributor(s) and not of EWA Publishing and/or the editor(s). EWA Publishing and/or the editor(s) disclaim responsibility for any injury to people or property resulting from any ideas, methods, instructions or products referred to in the content.
About volume
Volume title: Proceedings of the 3rd International Conference on Business and Policy Studies
© 2024 by the author(s). Licensee EWA Publishing, Oxford, UK. This article is an open access article distributed under the terms and
conditions of the Creative Commons Attribution (CC BY) license. Authors who
publish this series agree to the following terms:
1. Authors retain copyright and grant the series right of first publication with the work simultaneously licensed under a Creative Commons
Attribution License that allows others to share the work with an acknowledgment of the work's authorship and initial publication in this
series.
2. Authors are able to enter into separate, additional contractual arrangements for the non-exclusive distribution of the series's published
version of the work (e.g., post it to an institutional repository or publish it in a book), with an acknowledgment of its initial
publication in this series.
3. Authors are permitted and encouraged to post their work online (e.g., in institutional repositories or on their website) prior to and
during the submission process, as it can lead to productive exchanges, as well as earlier and greater citation of published work (See
Open access policy for details).
References
[1]. Fudge, S., & Peters, M. (2009). Motivating carbon reduction in the UK: the role of local government as an agent of social change. Journal of Integrative Environmental Sciences, 6(2), 103-120. doi: 10.1080/19438150902851331
[2]. McGuirk, P., Dowling, R., Brennan, C., & Bulkeley, H. (2015). Urban carbon governance experiments: the role of Australian local governments. Geographical research, 53(1), 39-52. doi: 10.1111/1745-5871.12076
[3]. Stern, N., & Stern, N. H. (2007). The economics of climate change: the Stern review. Cambridge University Press. doi: 10.1017/ CBO9780511817434
[4]. Du, L., Wei, C., & Cai, S. (2012). Economic development and carbon dioxide emissions in China: Provincial panel data analysis. China Economic Review, 23(2), 371-384. doi: 10.1016/j.chieco.2012.02.003
[5]. Vermeulen, S. J., Campbell, B. M., & Ingram, J. S. (2012). Climate change and food systems. Annual review of environment and resources, 37, 195-222. doi: 10.1146/annurev-environ-020411-130608
[6]. Shahbaz, M., Lean, H. H., & Shabbir, M. S. (2012). Environmental Kuznets curve hypothesis in Pakistan: cointegration and Granger causality. Renewable and Sustainable Energy Reviews, 16(5), 2947-2953. doi: 10.1016/j.rser.2012.02.015
[7]. Apergis, N., & Ozturk, I. (2015). Testing Environmental Kuznets Curve hypothesis in Asian countries. Ecological Indicators, 52, 16-22. doi:10.1016/j.ecolind.2014.11.026
[8]. Xu, G. Y., Dong, H. Y., Xu, Z. C., & Bhattarai, N. (2022). China can reach carbon neutrality before 2050 by improving economic development quality. Energy, 243, 12. doi:10.1016/j.energy.2021.123087
[9]. Liddle, B. Impact of population, age structure, and urbanization on carbon emissions/energy consumption: evidence from macro-level, cross-country analyses. Popul Environ 35, 286–304 (2014). https://doi.org/10.1007/s11111-013-0198-4
[10]. Sun, W., & Huang, C. (2020). How does urbanization affect carbon emission efficiency? Evidence from China. Journal of Cleaner Production, 272, 122828. Retrieved from https://www.sciencedirect.com/science/article/pii/S0959652620328730. doi:https://doi.org/10.1016/j.jclepro.2020.122828
[11]. Wang, Q., & Li, L. (2021). The effects of population aging, life expectancy, unemployment rate, population density, per capita GDP, urbanization on per capita carbon emissions. Sustainable Production and Consumption, 28, 760-774. doi: 10.1007/s11356-019-04997-6
[12]. Cui, Y., Wang, G., Irfan, M., Wu, D., & Cao, J. (2022). The effect of green finance and unemployment rate on carbon emissions in China. Front Environ Sci, 10, 887341. doi: 10.3389/fenvs.2022.887341
[13]. Blomstrom, M. and Kokko, A. (1998) Multinational Corporations and Spillovers. Journal of Economic Surveys, 12, 247-277. doi.org/10.1111/1467-6419.00056
[14]. Wang, J., & Li, H. (2019). The mystery of local fiscal expenditure and carbon emission growth in China. Environmental Science and Pollution Research, 26, 12335-12345. doi: 10.1007/s11356-019-04558-w
[15]. Cheng, S. L., Chen, Y. T., Meng, F. X., Chen, J. D., Liu, G. Y., & Song, M. L. (2021). Impacts of local public expenditure on CO2 emissions in Chinese cities: A spatial cluster decomposition analysis. Resources Conservation and Recycling, 164, 19. doi:10.1016/j.resconrec.2020.105217
[16]. Li, M., & Wang, Q. (2017). Will technology advances alleviate climate change? Dual effects of technology change on aggregate carbon dioxide emissions. Energy for Sustainable Development, 41, 61-68. doi: 10.1016/j.esd.2017.08.008
[17]. Zhu, Y., Liu, Z., Feng, S., & Lu, N. (2022). The role of fiscal expenditure on science and technology in carbon reduction: Evidence from provincial data in China. Environmental Science and Pollution Research, 29(54), 82030-82044. doi: 10.1007/s11356-022-20087-5
[18]. Fei, J., Wang, Y., Yang, Y., Chen, S., & Zhi, Q. (2016). Towards eco-city: the role of green innovation. Energy Procedia, 104, 165-170. doi: https://doi.org/10.1016/j.egypro.2016.12.029
[19]. Cheng, Z., Li, L., & Liu, J. (2018). Industrial structure, technical progress and carbon intensity in China's provinces. Renewable and Sustainable Energy Reviews, 81, 2935-2946. doi: 10.1016/j.rser.2017.08.078
[20]. Zhu, X. (2022). Have carbon emissions been reduced due to the upgrading of industrial structure? Analysis of the mediating effect based on technological innovation. Environmental Science and Pollution Research, 29(36), 54890-54901. doi: 10.1007/s11356-022-20022-w
[21]. Kong, L., Hasanbeigi, A., & Price, L. (2016). Assessment of emerging energy-efficiency technologies for the pulp and paper industry: a technical review. Journal of Cleaner Production, 122, 5-28. doi: org/10.1016/j.jclepro.2015.12.116
[22]. Xu, B., & Lin, B. (2018). Investigating the role of high-tech industry in reducing China's CO2 emissions: A regional perspective. Journal of Cleaner Production, 177, 169-177. doi:10.1016/j.jclepro.2017.12.174
[23]. Guellec, D., & Van Pottelsberghe De La Potterie, B. (2003). The impact of public R&D expenditure on business R&D. Economics of innovation and new technology, 12(3), 225-243. https://doi.org/10.1080/10438590290004555
[24]. Wen, Zhonglin, & Ye, Baojuan (2014). Mediation effects analysis: methodology and model development. Advances in Psychological Science, 22(05):731-745.