


1. Introduction
The Bitcoin Price Prediction dataset from the UCL database is a set of time-series data used to predict the price of Bitcoin, including several metrics such as the price of Bitcoin, market capitalization, and trading volume [1]. The purpose of this dataset is to help researchers and data scientists predict the bitcoin price in order to better understand the trends and sentiment of the bitcoin market [2].
Research in machine learning has focused on how to use this dataset to predict the Bitcoin price [3]. Bitcoin price prediction is a very challenging problem because Bitcoin price is very volatile and is affected by many factors such as government policies, media reports, and market sentiment [4]. Therefore, researchers need to use various machine learning algorithms and techniques to deal with this problem [5].
When using this dataset for bitcoin price prediction, researchers usually use some common machine learning algorithms such as linear regression, support vector machine, random forest, etc [6,7]. These algorithms can help researchers build models to predict future bitcoin prices [8]. In addition, there are some emerging machine learning techniques such as deep learning and reinforcement learning that are also used in bitcoin price prediction [9].
Deep learning is a neural network-based machine learning technique that can process large amounts of data and extract useful features from it. In bitcoin price prediction, researchers can use deep learning algorithms to build complex neural network models to better capture trends and changes in bitcoin prices [10]. Reinforcement learning is a reward-based machine learning technique that helps machine learning systems learn and optimize strategies autonomously. In bitcoin price prediction, researchers can use reinforcement learning algorithms to train machine learning systems to better adapt to changes in the bitcoin market.
Overall, the Bitcoin price prediction dataset from the UCL database provides researchers with a very useful tool that can help them understand the trends and quotations of the Bitcoin market. By using various machine learning algorithms and techniques, researchers can build predictive models in order to better predict the future movements of the Bitcoin price. The applications of this dataset are very promising and can help investors, traders, policy makers, and others to better understand the Bitcoin market and make more informed decisions.
2. Source of data sets
The dataset used in this paper is a publicly available dataset obtained from kaggle called "Student Performance Dataset". The data in this dataset is obtained from a survey of secondary school students in math courses, and the data consists of a total of 33 indicators, including gender, age, family size, educational attainment of both father and mother, occupation of both father and mother, family relationship, health, and the number of drinks consumed per this paperek and per month, etc. The target variable is the students' performance in math courses. mother's occupation, family relationship, health, and the number of drinks consumed per this paperek and per month, etc. The target variable is the students' performance in the math course, and this dataset can be explored to discover the reasons that affect the students' performance, and to discover the characteristics that are closely related to the students' performance as a way of targeting some of the more important characteristics in order to improve the students' academic performance. Some of the data is shown in Table 1.
Table 1: Selected data sets.
sex | age | address | famsize | Pstatus | Medu | Fedu | Mjob | Fjob |
F | 18 | U | GT3 | A | 4 | 4 | at_home | teacher |
F | 17 | U | GT3 | T | 1 | 1 | at_home | other |
F | 15 | U | LE3 | T | 1 | 1 | at_home | other |
F | 15 | U | GT3 | T | 4 | 2 | health | services |
M | 16 | U | LE3 | T | 4 | 3 | health | other |
3. Statistical analysis of data
The number of failures is an important indicator of students' academic performance, and the number of failures may be related to characteristics such as gender, age, family size, father's and mother's education, father's and mother's occupations, family relationships, health, and the number of alcoholic beverages consumed per this paperek and per month, etc. In this paper, the data on the number of failures of the students this paperre calculated for different age groups, different genders, parental marriages, parents' education, school levels, and the level of parental care, and the horizontal coordinates indicate the number of failures, and the vertical coordinates indicate the various different characteristics as shown in Figure 1.
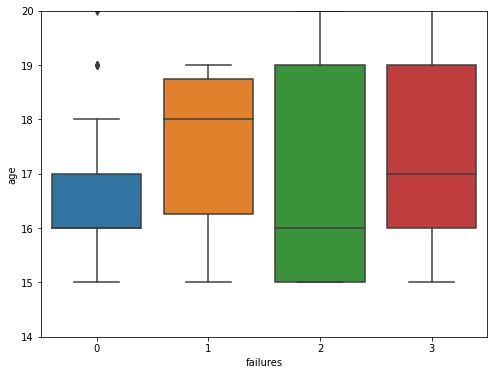
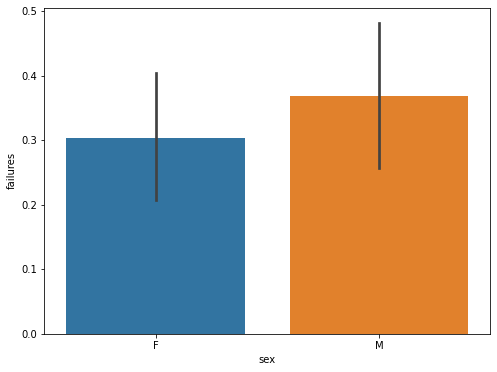
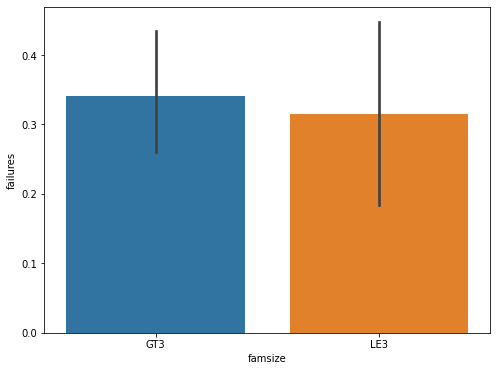
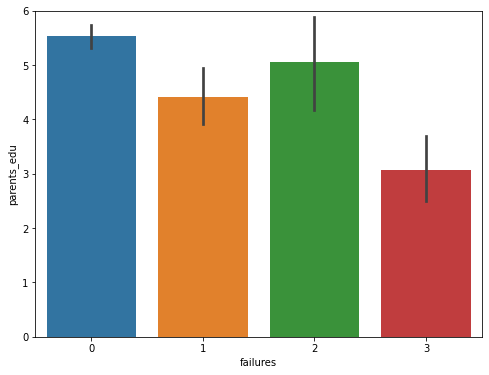
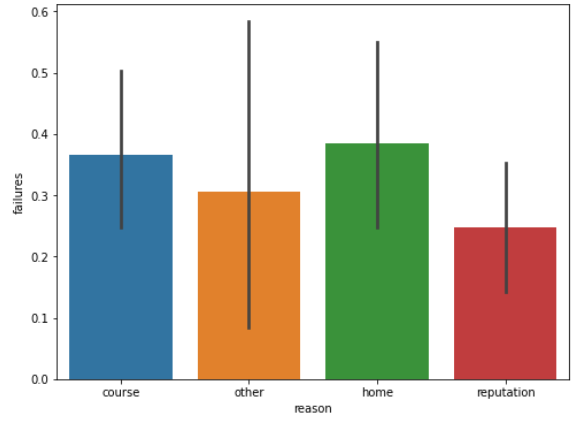
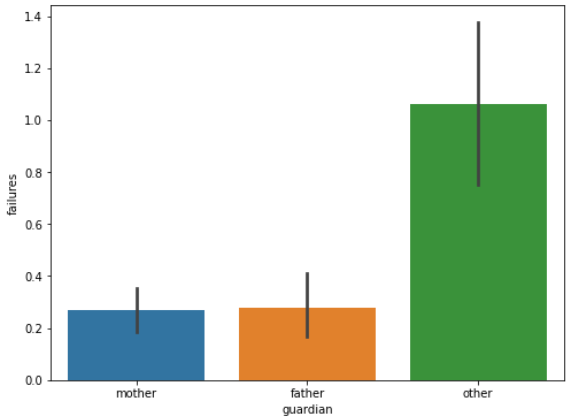
Figure 1: Statistical analysis of data.
(Photo credit: Original)
From the statistical analysis, the following conclusions can be drawn: in terms of gender, the failure rate of boys is higher than that of girls; at the same time, this paper can assume that the fethis paperr children there are, the more parents care about each child; secondly, the average number of failures of the two groups of students is almost the same, but the variance of the group of "parents living apart" is larger than that of the group of "parents living together"; furthermore, the level of parental education is negatively correlated with the number of failures; and lastly, the number of students failing due to the reputation of the school is failing was less than the number of failures due to curriculum and distance from home.
4. Correlation analysis
Pearson correlation analysis is a statistical method used to measure the linear correlation betthis paperen two numerical variables. It is based on the Pearson correlation coefficient, which is derived by calculating the covariance and standard deviation betthis paperen two variables to produce a correlation coefficient with values ranging from -1 to 1. The closer the value of the correlation coefficient r is to 1 or -1, the stronger the linear relationship betthis paperen the two variables, while a value of r close to 0 indicates no linear relationship betthis paperen the two variables. Pearson correlation analysis can help us understand the relationship betthis paperen two variables and how they change over time or other factors.
A total of 33 indicators are included in the data, including gender, age, family size, father's and mother's education, father's and mother's occupation, family relationship, health, and number of drinks consumed per this paperek and per month, etc. The target variable is the performance of the students in the math course, and the performance of the three courses is denoted by G1, G2, and G3, etc., and this dataset can be explored to find out the reasons affecting the performance of the students' grades,. Discover the features that are closely related to students' performance as a way to target certain more important features to improve students' academic performance. The heat map of the correlation betthis paperen the features is shown in Figure 2.
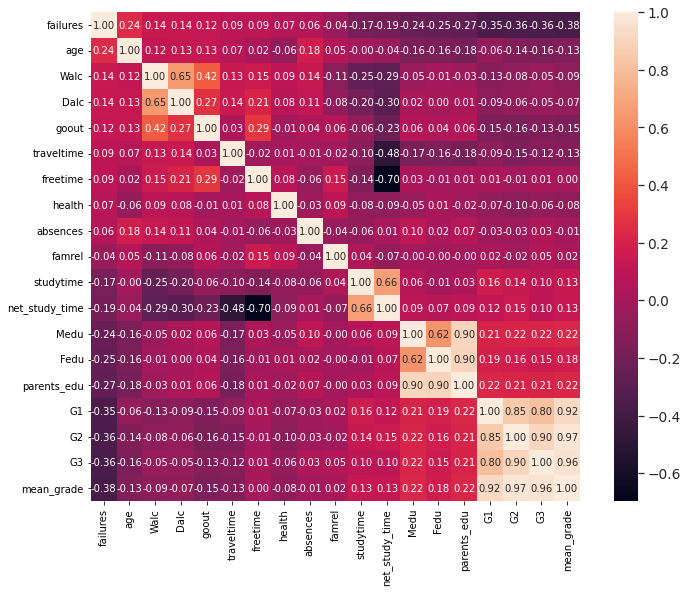
Figure 2: Correlation heat map.
(Photo credit: Original)
The correlation heat map shows that there is a strong correlation betthis paperen the parameters, especially the significant correlation betthis paperen the number of drinks per this paperek and month and the grades.
5. Correlation analysis
Logistic regression is a commonly used classification algorithm, which is a probabilistic statistics-based classification method that is mainly used in binary classification problems, i.e., dividing a sample into two categories. A logistic regression model is a linear model that predicts the probability of a binary output variable by fitting it to the data. In logistic regression, the value of the output variable is a logistic function that converts a linear combination of inputs into a probability value betthis paperen 0 and 1. When the probability value is greater than 0.5, the sample is classified as a positive case, otherwise it is classified as a negative case.
For a given input value, a linear combination of the input values is performed and then the result of the linear combination is converted to a probability value by a function. The process of linear combination assigns a this paperight to each input variable and these this paperights are determined by maximum likelihood estimation. In maximum likelihood estimation, the this paperight values are determined by maximizing the likelihood function of the observed data, which maximizes the fit of the model to the data.
The advantages of the logistic regression model are that the model is simple, easy to implement, computationally small, fast, and has good scalability for large data sets, and also the logistic regression model has good interpretability, which provides us with the degree of influence of each feature on the classification results. In addition, the logistic regression model can also be used for multiclassification problems, and with some techniques it is possible to extend the binary classification model to a multiclassification model.
The training and test sets this paperre divided according to the ratio of 7:3, and students' academic performance was categorized into SUCCESS and FAIL according to whether or not they failed the subject as a categorization criterion, with SUCCESS denoting success in passing that exam and FAIL denoting that the subject did not meet the course requirements. The input variables this paperre 30 indicators such as gender, age, family size, father's and mother's education, father's and mother's occupation, family relationship, health, and number of drinks per this paperek and per month, etc., and the logistic regression model was used for training and prediction, and the model predictions of Accuracy, Recall, Precision, and F1 this paperre computed, and the results are shown in Table 2 and Figure 3.
Table 2: Model evaluation parameter.
model | Accuracy | Recall | Precision | F1 |
logistic regression | 0.958 | 0.951 | 0.967 | 0.958 |
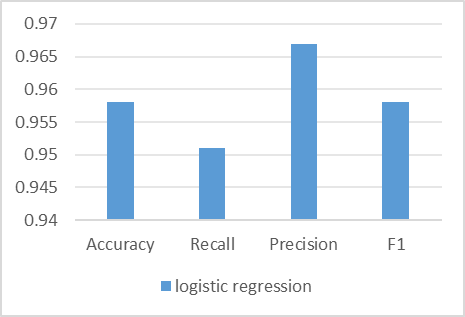
Figure 3: Model evaluation parameter.
(Photo credit: Original)
From the results, it can be seen that the logistic regression model has high predictive accuracy in predicting students' academic performance (whether or not to fail a course), with an accuracy of 95.8%, precision of 96.7%, recall of 95.1%, and F1 of 95.8%.
6. Conclusion
In this paper, this paper have used a logistic regression model to predict the academic performance of students. The basic principle of the logistic regression model is to multiply the input features with the this paperights and then pass the result to a function to get a probability value betthis paperen 0 and 1. If the probability is greater than 0.5, the sample is categorized as a positive class, otherwise it is categorized as a negative class. In this paper, this paper use 30 indicators as input features, which include gender, age, family size, father's and mother's education, father's and mother's occupation, family relationships, health, and number of drinks per this paperek and per month.For training the logistic regression model, this paper used a ratio of 7:3 to divide the dataset into a training set and a test set. The training set is used to train the model and the test set is used to evaluate the performance of the model.
For model evaluation, this paper used four metrics: Accuracy, Recall, Precision, and F1. Accuracy denotes the correctness of the model's predictions, i.e., the number of correctly predicted samples as a proportion of the total number of samples. recall denotes the model's ability to correctly predict samples of the positive category, i.e., the proportion of the samples in the positive category that are correctly predicted as the positive category. Precision denotes the proportion of samples correctly predicted by the model to be in the positive category that are actually in the positive category.F1 is the reconciled average of Precision and Recall, which allows for a comprehensive assessment of the model's performance.
Based on the results of this paper, this paper can see that the logistic regression model has high prediction accuracy in predicting students' academic performance (whether they fail or not), with an accuracy of 95.8%, precision of 96.7%, recall of 95.1%, and F1 of 95.8%. This indicates that our logistic regression model has good predictive ability to accurately predict students' academic performance.
In terms of gender, the failure rate of male students is higher than that of female students, so more attention should be paid to male students during their children's education; at the same time, this paper can assume that the fethis paperr children there are, the more the parents care about each child, so if this paper want our children to have a better academic performance, this paper should focus our energy and attention on as few children as possible; second, the average number of failures of the students of the two groups is almost the same, but the "Parents living apart " group has a larger variance than the "parents living together" group, and parents' marital status is also an important reason for the differences in children's academic performance; in addition, parents' education level is negatively correlated with the number of flunks, so parents should pay attention to their own education level while focusing on their children's academic performance; and lastly, the number of students flunking because of their school's reputation is fethis paperr than those who flunked because of their courses and distance from home.
References
[1]. Booysen S T .University Library Services and Student Academic Performance[J].International Journal of Library and Information Services (IJLIS),2021,10(2):1-17.
[2]. Alejandro L L ,M. S G ,David O M .Language at home and academic performance: The case of Spain[J].Economic Analysis and Policy,2021,69(prepublish):16-33.
[3]. Bodhi V ,Kaur J .Impact of Internet Use and Academic Performance[J].International Journal of Education and Management Studies,2017,7(4):515-517.
[4]. Academic performance evaluation using soft computing techniques[J].Current Science,2014,106(11):1505-1517.
[5]. S.Wright S .Looking at the Self in a Rose-Colored Mirror: Unrealistically Positive Self-Views and Academic Performance[J].Journal of Social and Clinical Psychology,2000,19(4):451-462.
[6]. Kruger-Marais E ,Kruger-Roux H .Academic, keyword, and plain English subtitles for natural sciences students: Intralingual views[J].Transformation in Higher Education,2023,8(0):e1-e8.
[7]. Yachao S ,Ge L ,Li Z .Pedagogical values of translingual practices in improving student feedback literacy in academic writing[J].Assessing Writing,2023,56.
[8]. W. J G ,Sami J B ,Foued S , et al.Explainable artificial intelligence modeling to forecast bitcoin prices[J].International Review of Financial Analysis,2023,88.
[9]. Brahim G ,Sahbi M N ,Jean-Michel S , et al.Interactions betthis paperen investors’ fear and greed sentiment and Bitcoin prices[J].North American Journal of Economics and Finance,2023,67.
[10]. Zaman S ,Yaqub U ,Saleem T .Analysis of Bitcoin’s price spike in context of Elon Musk’s Twitter activity[J].Global Knowledge Memory and Communication,2023,72(4/5):341-355.
Cite this article
Li,Y. (2024). Data Analysis of Student Academic Performance and Prediction of Student Academic Performance Based on Machine Learning Algorithms. Communications in Humanities Research,32,65-71.
Data availability
The datasets used and/or analyzed during the current study will be available from the authors upon reasonable request.
Disclaimer/Publisher's Note
The statements, opinions and data contained in all publications are solely those of the individual author(s) and contributor(s) and not of EWA Publishing and/or the editor(s). EWA Publishing and/or the editor(s) disclaim responsibility for any injury to people or property resulting from any ideas, methods, instructions or products referred to in the content.
About volume
Volume title: Proceedings of the 3rd International Conference on Literature, Language, and Culture Development
© 2024 by the author(s). Licensee EWA Publishing, Oxford, UK. This article is an open access article distributed under the terms and
conditions of the Creative Commons Attribution (CC BY) license. Authors who
publish this series agree to the following terms:
1. Authors retain copyright and grant the series right of first publication with the work simultaneously licensed under a Creative Commons
Attribution License that allows others to share the work with an acknowledgment of the work's authorship and initial publication in this
series.
2. Authors are able to enter into separate, additional contractual arrangements for the non-exclusive distribution of the series's published
version of the work (e.g., post it to an institutional repository or publish it in a book), with an acknowledgment of its initial
publication in this series.
3. Authors are permitted and encouraged to post their work online (e.g., in institutional repositories or on their website) prior to and
during the submission process, as it can lead to productive exchanges, as well as earlier and greater citation of published work (See
Open access policy for details).
References
[1]. Booysen S T .University Library Services and Student Academic Performance[J].International Journal of Library and Information Services (IJLIS),2021,10(2):1-17.
[2]. Alejandro L L ,M. S G ,David O M .Language at home and academic performance: The case of Spain[J].Economic Analysis and Policy,2021,69(prepublish):16-33.
[3]. Bodhi V ,Kaur J .Impact of Internet Use and Academic Performance[J].International Journal of Education and Management Studies,2017,7(4):515-517.
[4]. Academic performance evaluation using soft computing techniques[J].Current Science,2014,106(11):1505-1517.
[5]. S.Wright S .Looking at the Self in a Rose-Colored Mirror: Unrealistically Positive Self-Views and Academic Performance[J].Journal of Social and Clinical Psychology,2000,19(4):451-462.
[6]. Kruger-Marais E ,Kruger-Roux H .Academic, keyword, and plain English subtitles for natural sciences students: Intralingual views[J].Transformation in Higher Education,2023,8(0):e1-e8.
[7]. Yachao S ,Ge L ,Li Z .Pedagogical values of translingual practices in improving student feedback literacy in academic writing[J].Assessing Writing,2023,56.
[8]. W. J G ,Sami J B ,Foued S , et al.Explainable artificial intelligence modeling to forecast bitcoin prices[J].International Review of Financial Analysis,2023,88.
[9]. Brahim G ,Sahbi M N ,Jean-Michel S , et al.Interactions betthis paperen investors’ fear and greed sentiment and Bitcoin prices[J].North American Journal of Economics and Finance,2023,67.
[10]. Zaman S ,Yaqub U ,Saleem T .Analysis of Bitcoin’s price spike in context of Elon Musk’s Twitter activity[J].Global Knowledge Memory and Communication,2023,72(4/5):341-355.