


1. Introduction
The 19th century witnessed the upsurge of western powers’ colonization of East Asia and Japan, as a newly-developing capitalist country after reformation, joined the trend at the end of the century in order for a larger market, cheap labor power and raw materials.
Japan’s colonial movements in China started in 1931 and can be divided into two stages. The first stage began after Japan captured Northeast China in 1931 and at this period, Japan’s major aim was seeking trade facilitation. After 1937, Japan altered the main colonial target to territory expansion and the full-scale invasion became the main trend of the second stage [1]. By 1945, Japan lost WWII and its colonial movements ended.
Japan’s colonial migration happens constantly in the process of its colonial movements. Participants of the migration include troops, merchants and Japanese residents organized in the form of development groups. Therefore, due to the impact of Japan’s colonial migration, though mainland China doesn’t create concrete formal and wide commercial ties with other countries before 1978 because of the central planning economic system, Japan still becomes a significant trade partner to mainland China after the reform and opening up.
Numerous previous researches concentrate on discussing the long-term impact of former colonial powers on former colonies. For example, some researchers find that former colonies tend to trade with their former colonial powers or other colonies that share the same colonial powers [2-3]. However, research on the long-term influence of Japanese colonization in China is lacking. They center mainly on the commercial cooperation between two countries. Che, Du, Lu and Tao note the negative correlation between regional casualty and long-term trade preference, which means to what extent the provincial government is willing to trade with Japan [4]. Wang, Fidrmuc and Tian analyze the long-term trade choice from a comparative perspective of the impact of Western colonization and Japanese colonization [1]. No research mentions the relationship between trade preference and colonial factors other than casualty.
Two things can summarize the above. First, Japan’s colonial migration to China may have influenced the formation of a close commercial relationship between the two countries after they created a formal and wide trade linkage. However, whether migration plays a significant and long-lasting role in maintaining the trade relationship in the long term is not clear. Since colonial migration and long-term trade cooperation may have a possible correlation, research on this field is necessary because it serves as a predictor of the making of the two countries’ international trade policies. Second, there’s an academic vacuum in discussing the relationship between Japanese colonial migration and Sino-Japan trade. Related studies are needed to further explain the colonial impact.
Therefore, this research is intended to analyze the long-term impacts of Japan’s colonial migration into China on Sino-Japan trade. Two methods, data analysis and graphing are applied to the research process. In terms of data analysis, Chinese regional (provinces and regions bigger than provinces like Northeast China, also ‘Dongbei’ and Beijing-Tianjin-Hebei Region) statistics of Japanese colonial migration are gathered. Also, 2001 is selected as the target year to demonstrate the long-term situation and Chinese regional statistics of trade value, imports, exports, contracts and foreign direct investment (FDI) on both world’s level and Japan’s level are collected. Then, to evaluate how close the trade relationship is, Japanese proportions in the five factors are recorded. Graphing serves as an analysis of the relationship. Regional data of Japanese proportions in the five trade factors and colonial migration are put in scatter diagrams to explain whether and how Japanese colonial migration influences long-term Sino-Japan trade.
In essence, this research is expected to find out colonial migration’s role in the formation of Sino-Japan trade long after the establishment of commercial linkage. It may contribute to new ideas in the adjustment of future bilateral trade policies for policymakers. Plus, it fills a small part of the academic vacuum in the correlated field, thus helping future researchers further investigate the long-term impact of Japanese colonization in China in deeper and wider ways.
2. Data of Japan’s Colonial Migration in China and Sino-Japan Trade
2.1. Japan’s Colonial Migration in China
There is no exact data on the number of Japanese people who come to China during wartime. This is because Japan’s colonial immigrants have very high mobility. However, there is plenty of research showing the number of Japanese colonial immigrants that are repatriated after the war. Therefore, in this research, though the number of repatriated Japanese only indicates the migration situation in the last stage of the war, it is determined equal to the number of Japanese colonial immigrants in China and is used to analyze the migration.
The latest data on repatriated Japanese immigrants comes from the special subject history of ROC written by Xianwen Zhang and Yufa Zhang [5].
As is demonstrated in Table 1:
Table 1: Data of repatriated Japanese immigrants after the war
Regions (their abbreviations) | Repatriated Japanese immigrants from 1946 to 1947 (1 person) | Repatriated Japanese immigrants in 1948 (1 person) | Aggregate repatriated Japanese immigrants (1 person) |
Beijing-Tianjin-Hebei region (Heb+BJ+TJ) | 403308 | 2415 | 405723 |
Shandong (SD) | 125875 | 298 | 126173 |
Jiangsu (JS) | 99069 | 0 | 99069 |
Shanghai (SH) | 728602 | 613 | 729215 |
Fujian (FJ) | 3633 | 0 | 3633 |
Guangdong (GD) | 109549 | 0 | 109549 |
Hainan (HaiN) | 23548 | 0 | 23548 |
Dongbei (DB) | 1145964 | 7456 | 1153420 |
Other regions | 0 | 0 | 0 |
What needs to be noticed is that the data in Table 1 excludes the Japanese immigrants in areas like Dalian because the Soviet Union is responsible for the repatriation work in these areas. Also, this data doesn’t include a very small number of Japanese people who chose to stay in China after 1948.
Moreover, to make the data analysis stage easier to operate, some provinces are calculated together as bigger regions. Beijing, Tianjin and Hebei are noted as the Beijing-Tianjin-Hebei region and Heilongjiang, Jilin and Liaoning are noted as Dongbei, also known as Northeast China. Plus, all provinces are written in abbreviations to make the essay easier to write and read. These two simplification measures are also implemented in the following parts of this paper.
2.2. Sino-Japan Trade
The data of Sino-Japan trade comes from the statistical yearbooks of all provinces in China in 2001 [6].
In this research, five factors, including trade value, imports, exports, contract numbers and FDI are applied to show the economic linkage between different regions in China and other countries. Data associated with the five factors are collected on both world’s level and Japan’s level. As is demonstrated in Table 2 and Table 3:
Table 2: Data of China’s trade value, imports, exports, contract numbers and FDI on world’s level
Regions (abbreviations) | Trade value with world (USD 100 million) | Imports from world (USD 100 million) | Exports to world (USD 100 million) | Contracts with world (1 contract) | FDI from world (USD 100 million) |
Beijing-Tianjin-Hebei region (Heb+BJ+TJ) | 373.28 | 189.97 | 183.31 | 2268 | 76.72 |
Shandong (SD) | 289.63 | 108.34 | 181.29 | 3047 | 67.2 |
Jiangsu (JS) | 513.55 | 224.77 | 288.78 | 3581 | 150.95 |
Shanghai (SH) | 1204.88 | 524.81 | 680.07 | 2458 | 73.73 |
Zhejiang (ZJ) | 328 | 98.22 | 229.78 | 2310 | 50.16 |
Fujian (FJ) | 226.26 | 87.04 | 139.22 | 1670 | 50.07 |
Guangdong (GD) | 1764.87 | 810.66 | 954.21 | 5317 | 134.35 |
Hainan (HaiN) | 17.62 | 9.61 | 8.01 | 181 | 1.52 |
Dongbei (DB) | 264.27 | 122.42 | 141.85 | 2461 | 69.42 |
Henan (HeN) | 27.93 | 10.77 | 17.16 | 224 | 6.22 |
Shanxi (ShanX) | 19.41 | 4.73 | 14.68 | 75 | 2.99 |
Anhui (AH) | 36.2 | 13.38 | 22.82 | 260 | 6.44 |
Hubei (HuB) | 35.78 | 17.8 | 17.98 | 349 | 8.95 |
Jiangxi (JX) | 15.31 | 4.92 | 10.39 | 308 | 5.27 |
Hunan (HuN) | 27.58 | 10.01 | 17.54 | 338 | 9.53 |
Inner Mongolia (IMG) | 25.48 | 14.08 | 11.4 | 81 | 2.62 |
Ningxia (NX) | 5.36 | 1.8 | 3.56 | 35 | 1.3 |
Shaanxi (ShaanX) | 20.64 | 9.54 | 11.1 | 222 | 7.3 |
Chongqing (CQ) | 18.34 | 7.31 | 11.03 | 191 | 7.19 |
Guizhou (GZ) | 6.5 | 2.28 | 4.22 | 59 | 0.91 |
Guangxi (GX) | 17.97 | 5.62 | 12.35 | 285 | 3.84 |
Gansu (GS) | 7.79 | 3.23 | 4.76 | 72 | 1.59 |
Qinghai (QH) | 2.05 | 0.56 | 1.49 | 47 | 1.98 |
Sichuan (SC) | 30.99 | 15.16 | 15.83 | 9.92 | |
Yunnan (YN) | 19.89 | 7.45 | 12.44 | 140 | 2.94 |
Xinjiang (XJ) | 6.54 | 3.54 | 3 | 2 | 0.05 |
Tibet/Xizang (XZ) | 0.94 | 0.12 | 0.82 |
Table 3: Data of China’s trade value, imports, exports, contract numbers and FDI on Japan’s level
Regions (abbreviations) | Trade value with Japan (USD 100 million) | Imports from Japan (USD 100 million) | Exports to Japan (USD 100 million) | Contracts with Japan (1 contract) | FDI from Japan (USD 100 million) |
Beijing-Tianjin-Hebei region (Heb+BJ+TJ) | 73.56 | 39.41 | 34.15 | 175 | 5.76 |
Shandong (SD) | 69.47 | 17.53 | 51.94 | 265 | 4.61 |
Jiangsu (JS) | 131.56 | 58.24 | 73.32 | ||
Shanghai (SH) | 271.62 | 124.69 | 146.93 | 342 | 13.24 |
Zhejiang (ZJ) | 60.71 | 23.01 | 37.7 | 238 | 3.75 |
Fujian (FJ) | 38.59 | 12.84 | 25.75 | 79 | 0.85 |
Guangdong (GD) | 211.73 | 129.9 | 81.83 | 56 | 4.86 |
Hainan (HaiN) | 2.52 | 1.58 | 0.94 | 7 | 0.02 |
Dongbei (DB) | 81.61 | 31.21 | 50.4 | 348 | 7.36 |
Henan (HeN) | 3.28 | 1.49 | 1.79 | 10 | 0.05 |
Shanxi (ShanX) | 1.91 | 0.16 | 1.75 | 2 | 0.004 |
Anhui (AH) | 5.18 | 2.39 | 2.79 | 23 | 0.34 |
Hubei (HuB) | 6.43 | 3.4 | 3.03 | 15 | 0.25 |
Jiangxi (JX) | 2.19 | 1.07 | 1.12 | 9 | 0.35 |
Hunan (HuN) | 3.64 | 1.83 | 1.81 | 7 | 0.36 |
Inner Mongolia (IMG) | 1.9 | 0 | |||
Ningxia (NX) | 0.81 | 0.25 | 0.56 | 0 | |
Shaanxi (ShaanX) | 3.45 | 2.26 | 1.19 | 16 | 0.25 |
Chongqing (CQ) | 4.02 | 3.28 | 0.74 | 4 | 0.002 |
Guizhou (GZ) | 0.53 | ||||
Guangxi (GX) | 1.55 | 0.4 | 1.15 | 0.001 | |
Gansu (GS) | 1.23 | 0.15 | 1.08 | 4 | 0.01 |
Qinghai (QH) | 0.31 | 0 | 0 | ||
Sichuan (SC) | 4.57 | 2.69 | 1.88 | ||
Yunnan (YN) | 1.35 | 0.14 | 1.21 | 0.002 | |
Xinjiang (XJ) | 0.11 | 0.04 | 0.07 | 0 | 0 |
Tibet/Xizang (XZ) |
The blank spaces in Table 2 and Table 3 mean the numbers here are not collected by the yearbooks of these regions. Data related to these blank spaces are therefore not included in this research.
To evaluate how strong the commercial relationship between the Chinese regions and Japan is, or in other words, whether Japan plays an important role compared with other countries in the Chinese regions’ international trade, Japan’s proportion of the five factors should be calculated. It equals the five factors on Japan’s level divided by the five factors on world’s level.
\( Japan \prime s proportion of five factors=\frac{{α_{Japan}}}{{α_{world}}} \) (1)
ɑJapan refers to China’s trade value, imports, exports, contract numbers and FDI on Japan’s level and ɑworld refers to China’s trade value, imports, exports, contract numbers and FDI on world’s level. Japan’s proportion of the five factors are demonstrated in Table 4:
Table 4: Data of Japan’s proportion in trade value, imports, exports, contract numbers and FDI on Japan’s level
Regions (abbreviations) | Japan’s proportion in trade value (%) | Japan’s proportion in imports (%) | Japan’s proportion in exports (%) | Japan’s proportion in contracts (%) | Japan’s proportion in FDI (%) |
Beijing-Tianjin-Hebei region (Heb+BJ+TJ) | 19.71 | 20.75 | 18.63 | 7.71 | 7.51 |
Shandong (SD) | 23.99 | 16.18 | 28.65 | 8.70 | 6.86 |
Jiangsu (JS) | 25.62 | 25.91 | 25.39 | ||
Shanghai (SH) | 22.54 | 23.76 | 21.61 | 13.91 | 17.96 |
Zhejiang (ZJ) | 18.51 | 23.43 | 16.41 | 10.30 | 7.48 |
Fujian (FJ) | 17.06 | 14.75 | 18.50 | 4.73 | 1.70 |
Guangdong (GD) | 12.00 | 16.02 | 8.58 | 1.05 | 3.62 |
Hainan (HaiN) | 14.30 | 16.44 | 11.74 | 3.87 | 1.32 |
Dongbei (DB) | 30.88 | 25.49 | 35.53 | 14.14 | 10.60 |
Henan (HeN) | 11.74 | 13.83 | 10.43 | 4.46 | 0.80 |
Shanxi (ShanX) | 9.84 | 3.38 | 11.92 | 2.27 | 0.13 |
Anhui (AH) | 14.31 | 17.86 | 12.23 | 8.85 | 5.28 |
Hubei (HuB) | 17.97 | 19.10 | 16.85 | 4.30 | 2.79 |
Jiangxi (JX) | 14.30 | 21.75 | 10.78 | 2.92 | 6.64 |
Hunan (HuN) | 13.20 | 18.23 | 10.32 | 2.07 | 3.78 |
Inner Mongolia (IMG) | 16.67 | ||||
Ningxia (NX) | 15.11 | 13.89 | 15.73 | ||
Shaanxi (ShaanX) | 16.82 | 23.69 | 10.72 | 7.21 | 3.42 |
Chongqing (CQ) | 21.92 | 44.87 | 6.71 | 2.09 | 0.03 |
Guizhou (GZ) | 12.56 | ||||
Guangxi (GX) | 8.63 | 7.12 | 9.31 | 0.03 | |
Gansu (GS) | 15.79 | 4.64 | 22.69 | 5.56 | 0.63 |
Qinghai (QH) | 20.81 | ||||
Sichuan (SC) | 14.75 | 17.74 | 11.88 | ||
Yunnan (YN) | 6.79 | 1.88 | 9.73 | 0.07 | |
Xinjiang (XJ) | 1.68 | 1.13 | 2.33 | ||
Tibet/Xizang (XZ) |
Besides the five factors of Sino-Japan trade, there are external factors that can influence a region’s trade preference. GDP per capita, openness index and distance from regional capital Tokyo are considered to affect Japan’s significance in Sino-Japan trade in this research.
GDP per capita reveals the economic situation in this region. It helps policymakers design foreign policies, thus influencing commercial relationships between different Chinese regions and Japan. In 2001, China’s international market is still expanding at a high speed so normally, higher GDP per capita can indicate more open foreign trade policies.
The openness index assesses how heavily the regional economy relies on the foreign market. It can be calculated by trade value divided by GDP.
\( openness index=\frac{trade value}{GDP} \) (2)
Normally, the higher the openness index is, the more heavily the local market depends on the external market.
Distance from the regional capital to Tokyo can directly decide how possible the region will prefer Japan to be its significant trade partner to a large extent. The closer the distance is, the higher trade preference Japan will have for the Chinese region.
Table 5 shows the data of these three external factors:
Table 5: Chinese regional GDP per capita, openness index and distance to Tokyo
Regions (abbreviations) | GDP per capita (USD 1) | Openness index | Distance (km) |
Beijing-Tianjin-Hebei region (Heb+BJ+TJ) | 1364.74 | 0.301 | 2121.3 |
Shandong (SD) | 1261.26 | 0.254 | 2037.4 |
Jiangsu (JS) | 1562.47 | 0.447 | 1971.3 |
Shanghai (SH) | 3705.97 | 2.014 | 1760.4 |
Zhejiang (ZJ) | 1767.37 | 0.402 | 1915 |
Fujian (FJ) | 1493.94 | 0.440 | 2215.1 |
Guangdong (GD) | 1652.86 | 1.372 | 2904.6 |
Hainan (HaiN) | 828.66 | 0.267 | 3550.6 |
Dongbei (DB) | 1200.32 | 0.206 | 1568.3 |
Henan (HeN) | 713.16 | 0.041 | 1567.4 |
Shanxi (ShanX) | 657.24 | 0.090 | 2424.7 |
Anhui (AH) | 628.16 | 0.091 | 2113 |
Hubei (HuB) | 942.73 | 0.064 | 2427.6 |
Jiangxi (JX) | 627.95 | 0.058 | 2366.3 |
Hunan (HuN) | 729.55 | 0.057 | 2644 |
Inner Mongolia (IMG) | 785.69 | 0.136 | 2504.6 |
Ningxia (NX) | 640.31 | 0.149 | 2966.4 |
Shaanxi (ShaanX) | 608.96 | 0.093 | 2795.8 |
Chongqing (CQ) | 682.60 | 0.087 | 3163.1 |
Guizhou (GZ) | 345.02 | 0.050 | 3282.4 |
Guangxi (GX) | 563.00 | 0.067 | 3342.4 |
Gansu (GS) | 503.21 | 0.060 | 3223.9 |
Qinghai (QH) | 695.22 | 0.056 | 3389.2 |
Sichuan (SC) | 618.31 | 0.058 | 3345.6 |
Yunnan (YN) | 584.70 | 0.079 | 3714.4 |
Xinjiang (XJ) | 956.67 | 0.036 | 4463.1 |
Tibet/Xizang (XZ) | 637.30 | 0.056 | 4538.5 |
3. Analysis of Five Factors Considering Regional Differences and Migration Scale
Analysis of the data is expressed through scatter diagrams and can be divided into two steps. First, regions with Japan’s colonial migration are compared with regions without Japan’s colonial migration. What is evaluated is how Japan’s proportion in the five factors of Sion-Japan (trade value, imports, exports, contract numbers and FDI) changes when the three external factors (GDP per capita, openness index and distance to Tokyo) are distinct. Then, in terms of regions with Japan’s colonial migration, Japan’s proportion in the five factors of Sino-Japan trade is illustrated again to see how the scale of Japan’s colonial migration influences Sino-Japan trade.
3.1. Regions with Migration Versus Regions without Migration
To evaluate how Japan’s proportion in the five factors differs among regions with different three external factors, the data from Table 1, Table 4 and Table 5 are applied to this process. Plus, because this step is intended to compare regions with and without colonial migration, regions with migration and regions without migrations are divided into two groups for analysis.
3.1.1. GDP Per Capita
GDP per capita is set as the X axis and Japan’s proportion in five factors is set as the Y axis, just as Figure 1 to Figure 5 show:
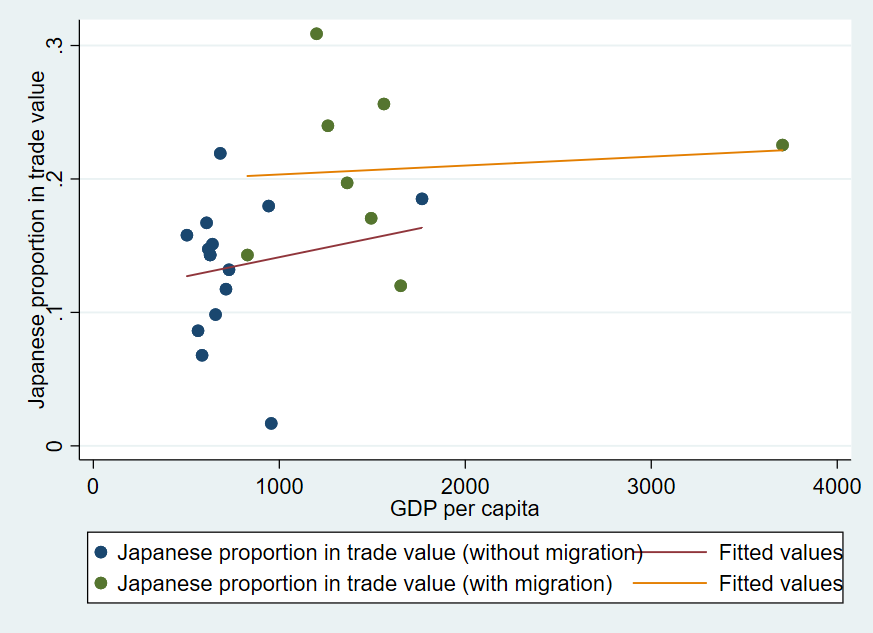
Figure 1: Trade value versus GDP per capita
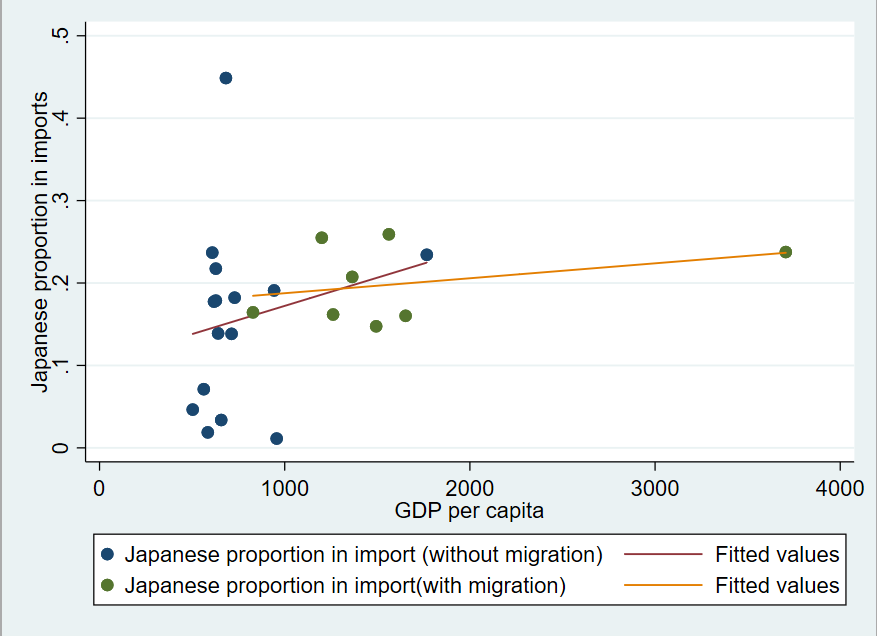
Figure 2: Imports versus GDP per capita
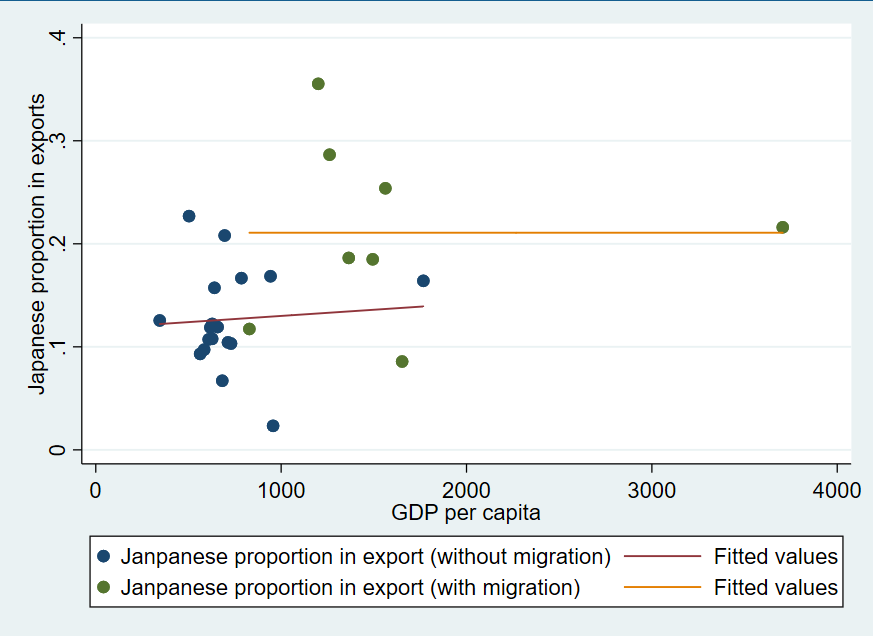
Figure 3: Exports versus GDP per capita
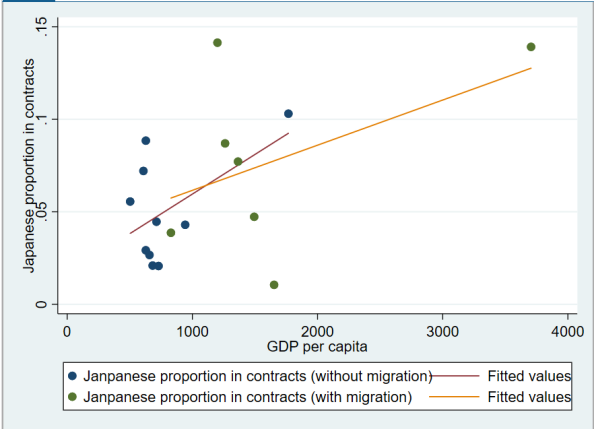
Figure 4: Contract numbers versus GDP per capita
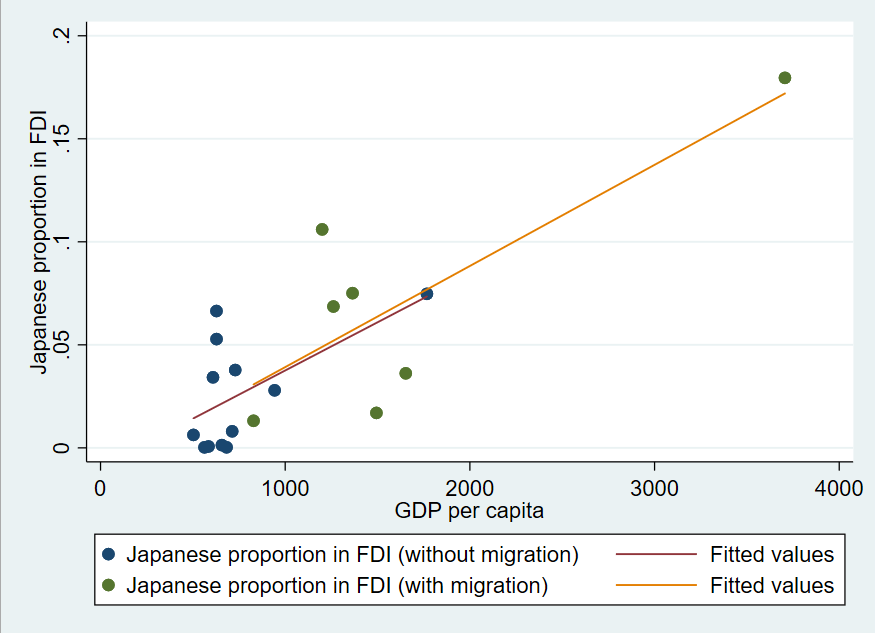
Figure 5: FDI versus GDP per capita
The fitting straight lines in Figure 1 to Figure 5 indicate three trends.
First, in terms of trade value and exports, Japan’s proportion is higher in regions with Japan’s colonial migration than in regions without Japan’s colonial migration. This indicates that Japan plays a more significant role in international trade in regions with Japan’s colonial migration. The migration mainly leads to a long-term increase in trade value and exports
Second, Japan’s proportion in imports, contract numbers and FDI does not have a distinct difference between regions with Japan’s colonial migration and regions without Japan’s colonial migration. This means Japan’s colonial migration’s influence on regional international trade is great but limited to several areas. Other areas, like imports, contract numbers and FDI are not strongly impacted by colonial migration. Also, because trade value equals imports plus exports and Japan’s colonial migration leads Japan to play a more significant role in exports but cannot greatly influence its role in imports, it can be concluded that Japan’s colonial migration mainly has a great long-term impact on the export market.
Last, many data points are far from fitting straight lines. This may be because though GDP per capita can reflect regional international strategy, its influence on Sino-Japan trade is not that great. The more possible reason is that local economic strategy plays the main role in Sino-Japan trade and Japan’s colonial migration and GDP per capita are just factors to consider when making commercial policies and decisions.
3.1.2. Openness Index
Openness index is set as the X axis and Japan’s proportion in five factors is set as the Y axis, just as Figure 6 to Figure 10 show:
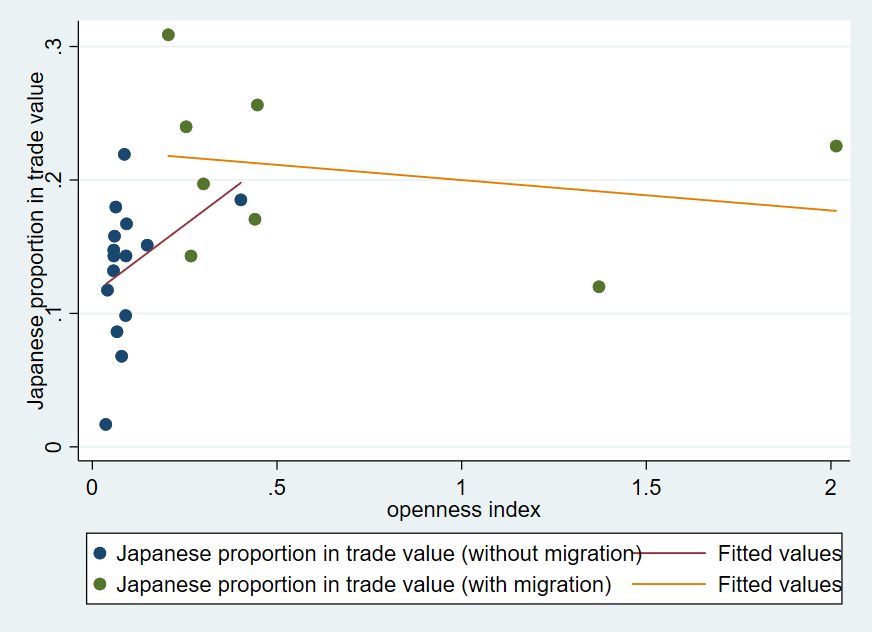
Figure 6: Trade value versus Openness index
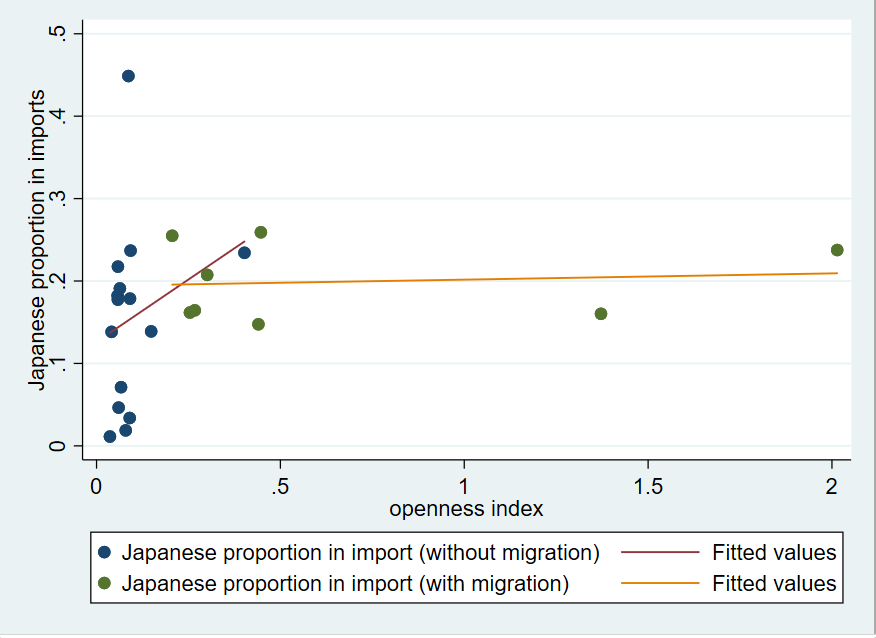
Figure 7: Imports versus Openness index
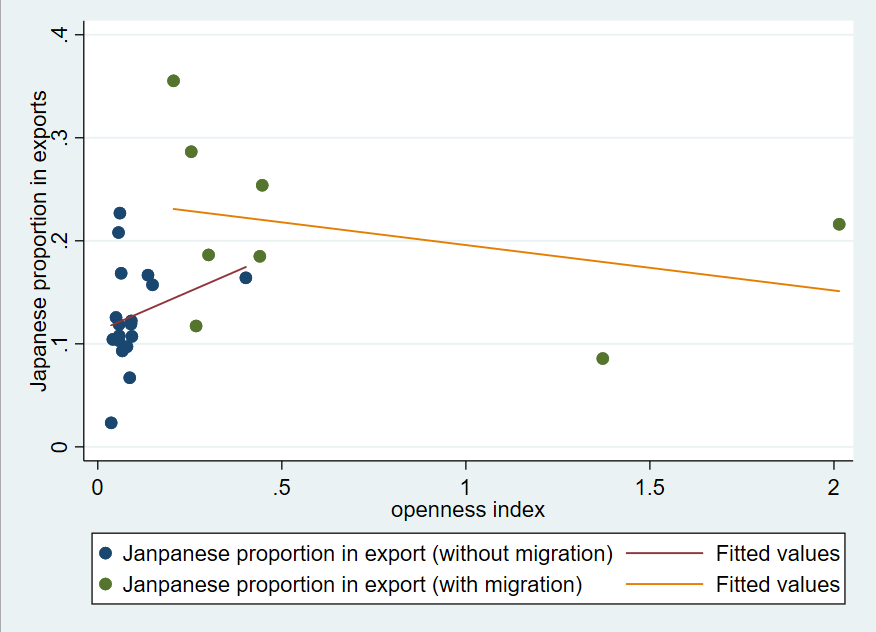
Figure 8: Exports versus Openness index
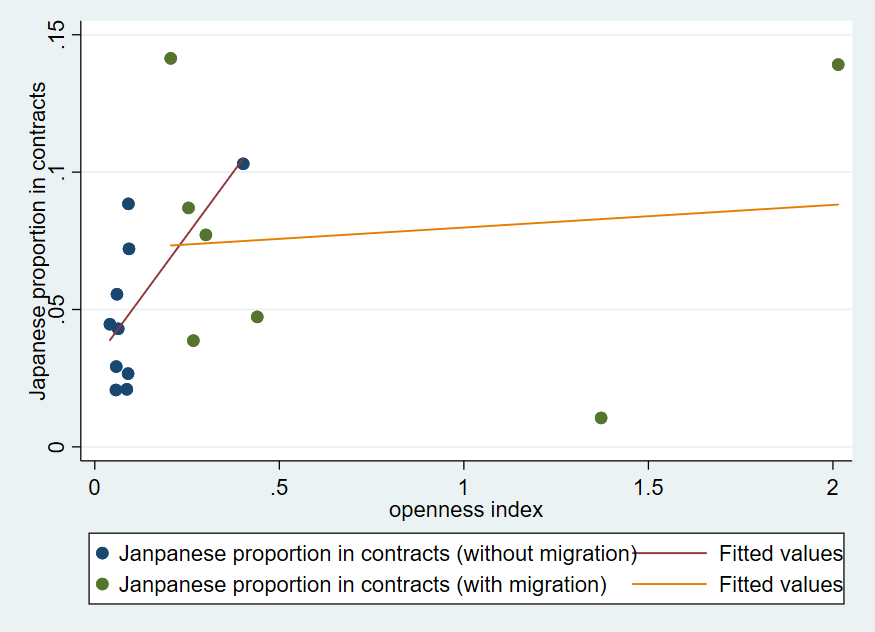
Figure 9: Contract numbers versus Openness index
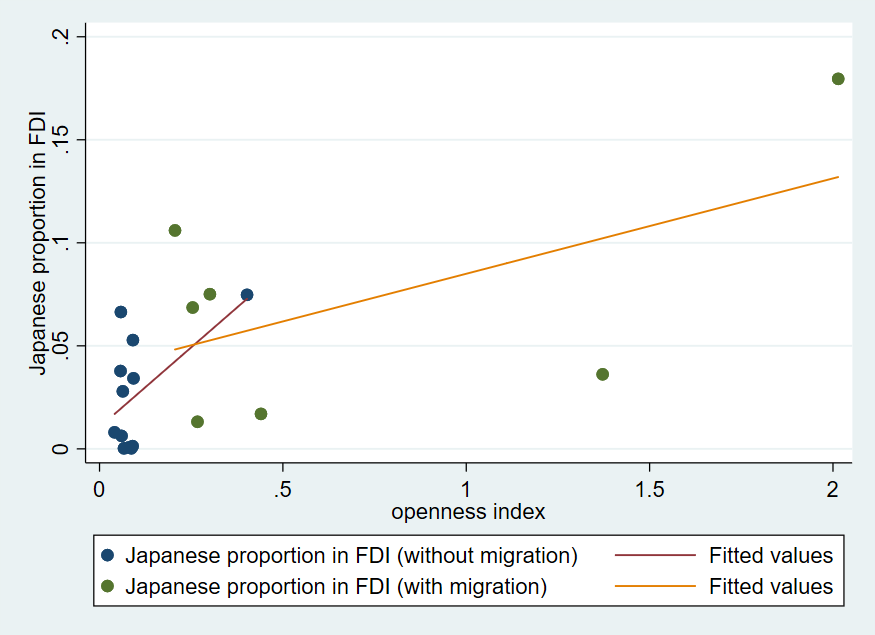
Figure 10: FDI versus Openness index
Two trends can be implied above:
First, when comparing the data points of regions with colonial migration excluding the two do better in openness index with the fitting line of regions without colonial migration, it can be found that regions with Japan’s colonial migration have higher Japanese proportion in trade value and exports than regions without Japan’s colonial migration and in terms of imports, contract numbers and FDI, the difference is not clear. Therefore, it can be concluded again that Japan’s colonial migration’s major long-term influence on Sino-Japan trade is increasing China’s exports to Japan.
Plus, the fitting line of regions with colonial migration actually has a smaller slope than the fitting line of regions without colonial migration, which means with the openness index increasing, the Japanese proportion in China’s international trade actually decreases. This indicates that if a Chinese region’s external commercial policy is open enough, Japan’s colonial migration’s impact on trade preference is very small. That is to say, if the region doesn’t depend much on the international market, Japan tends to be its relatively prioritized choice to trade with and Japan’s colonial migration contributes to the preference more or less. However, if this region has already built a mature external policy system and it’s very open to the world, it will have far more choices to trade with. Therefore, Japan is subject to a decline in this Chinese region’s trade preference and thus Japan’s colonial migration is less considered in the policy-making process.
3.1.3. Distance to Tokyo
Distance from regional capital to Tokyo is set as the X axis and Japan’s proportion in five factors is set as the Y axis, just as Figure 11 to Figure 15 show:
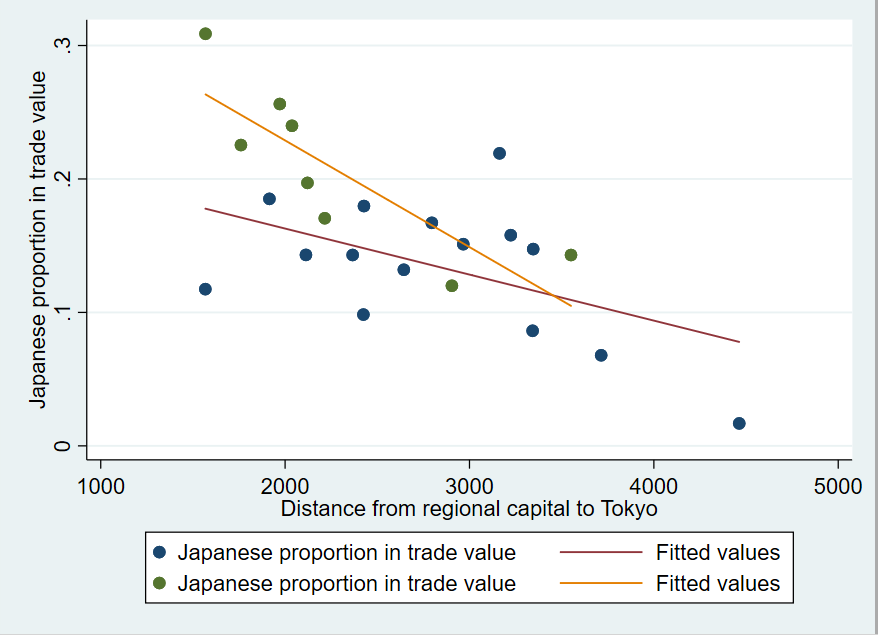
Figure 11: Trade value versus Distance from regional capital to Tokyo
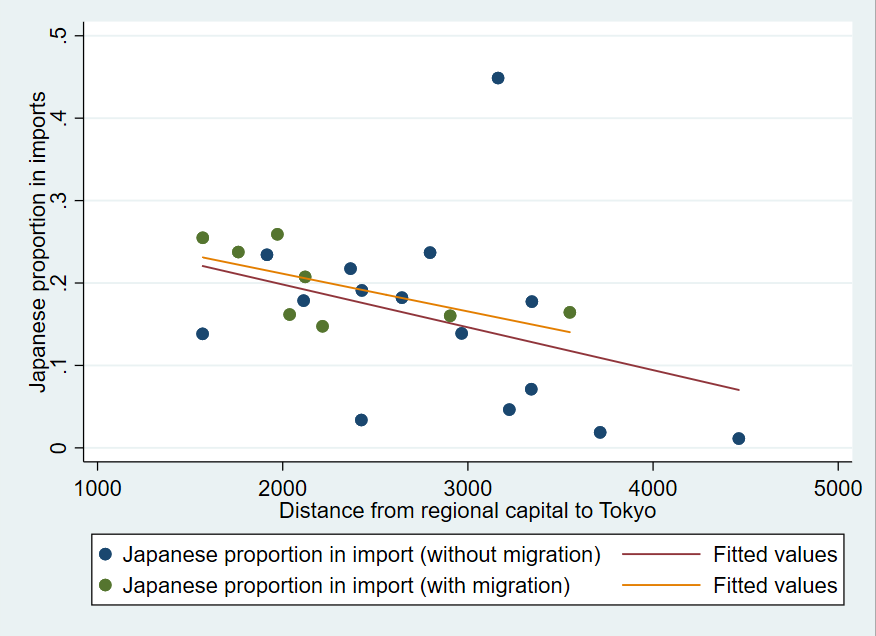
Figure 12: Imports versus Distance from regional capital to Tokyo
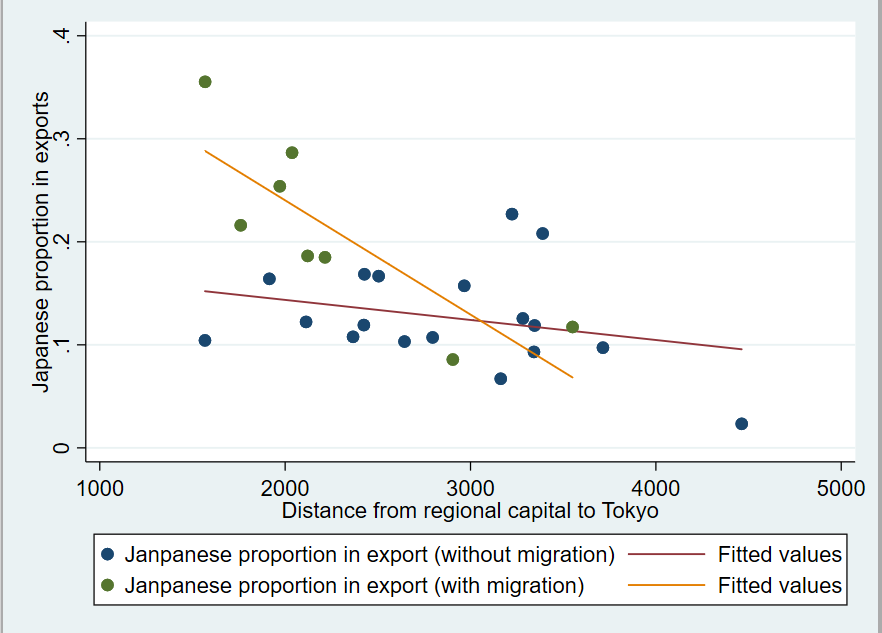
Figure 13: Exports versus Distance from regional capital to Tokyo
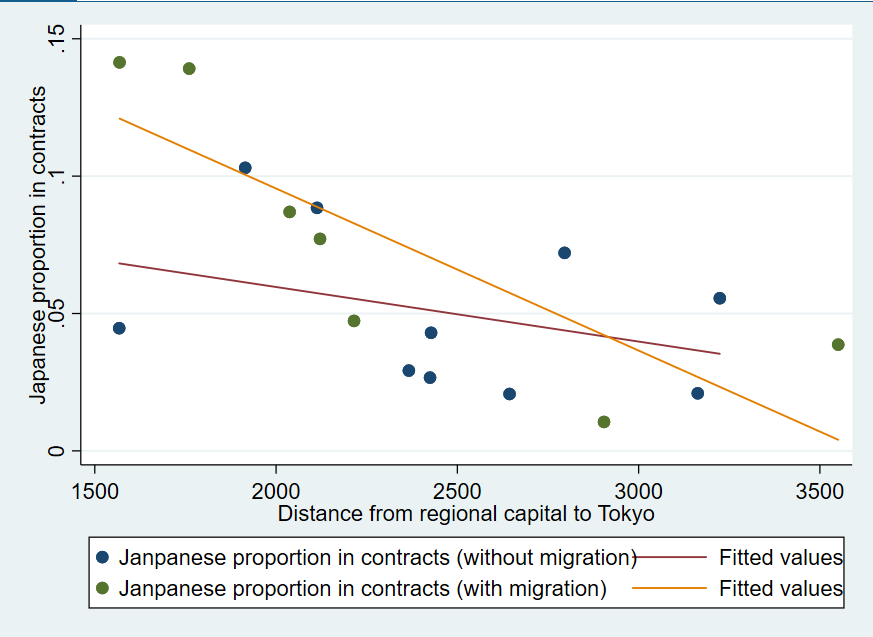
Figure 14: Contract numbers versus Distance from regional capital to Tokyo
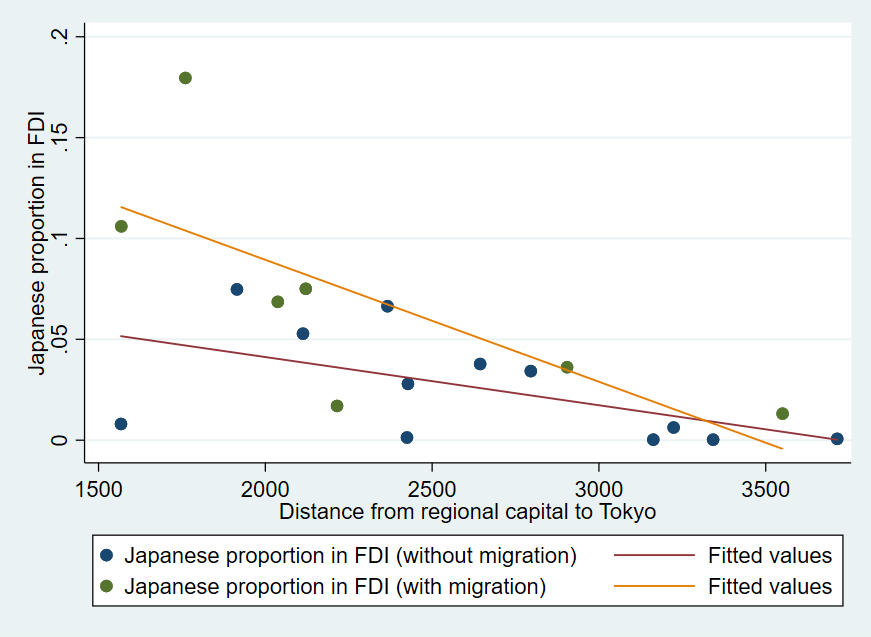
Figure 15: FDI versus Distance from regional capital to Tokyo
Two trends can be found in the fitted lines from Figure 11 to Figure 15:
First, when the Distance from the regional capital to Tokyo is less than 3000 kilometers, Japan’s proportion in all five factors of Sino-Japan trade in regions with Japan’s colonial migration is bigger than in regions without Japan’s colonial migration. This demonstrates that Japan’s colonial migration has a positive long-term impact on the role it plays in Sino-Japan trade.
However, if the Distance is bigger than 3000 kilometers, Japan’s proportion in trade value, exports, contract numbers and FDI in regions with migrations starts to decrease and eventually become smaller than in regions without migration while Japan’s proportion in imports is still bigger in regions with migration than in regions without migration. This may indicate that with distance increasing, the cost of trading with Japan is also increasing, thus leading to smaller potential profit. Therefore, another face of Japan’s colonial migration, violence, replaces the cultural consensus and social norms built during the colonial period. Considering themselves as former victims during the war, people in these regions mainly hold a hateful attitude towards Japan and tend to decline commercial cooperation with Japan. However, to maintain their daily life or only because it’s more cost-efficient despite the cost of transportation, they still need to import some products from Japan. This may explain why only Japan’s proportion in imports maintains the same trend as in regions whose capital is less than 3000 kilometers from Tokyo.
3.2. The Impact of Migration Scale on Sino-Japan Trade
To further explore how Japan’s colonial migration impacted Sino-Japan trade in the long term, migration scale, which means how many Japanese immigrants entered China during the war in every region, is taken into account. What is intended to find is how migration scale influences five factors of Sino-Japan trade in regions with migration. The data here is collected from Table 1 and Table 4.
Japan’s migration scale is set as the X axis and Japan’s proportion in five factors is set as the Y axis, just as Figure 16 to Figure 20 show:
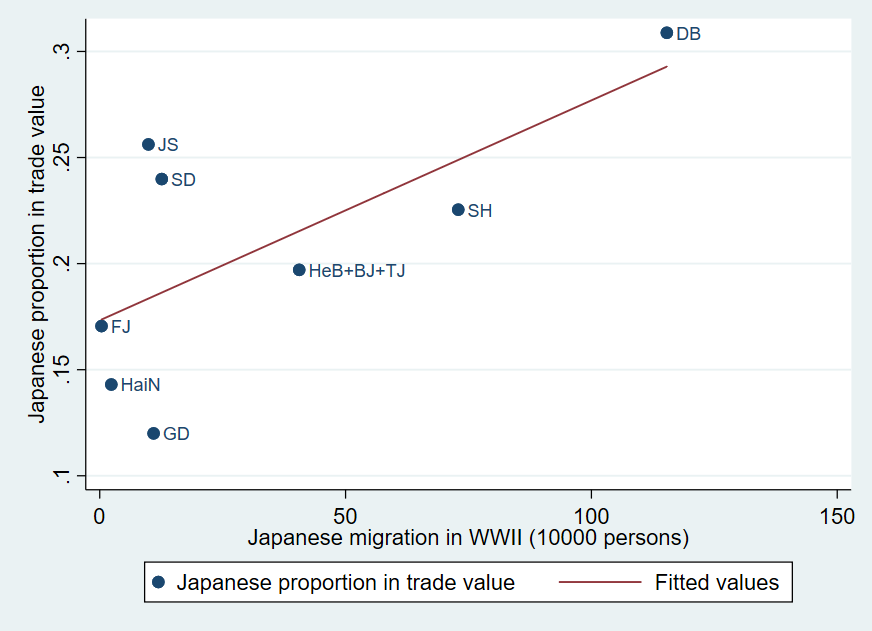
Figure 16: Trade value versus Japan’s migration scale
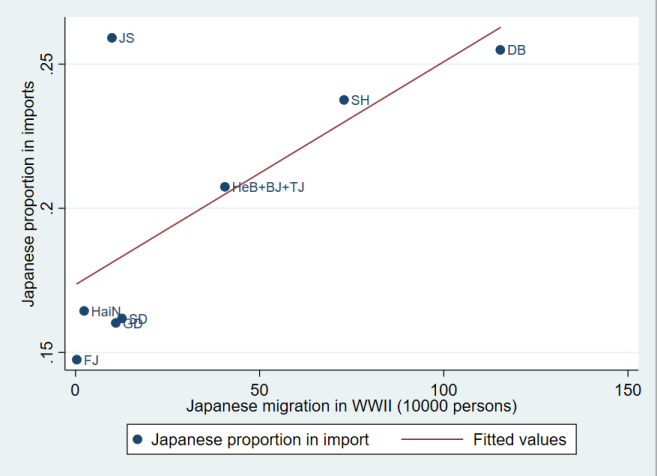
Figure 17: Imports versus Japan’s migration scale
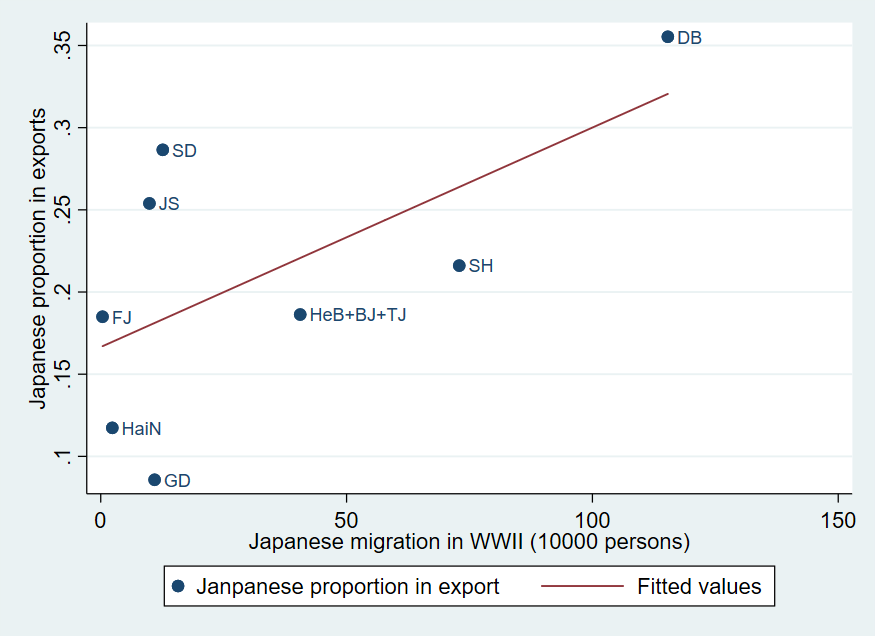
Figure 18: Exports versus Japan’s migration scale
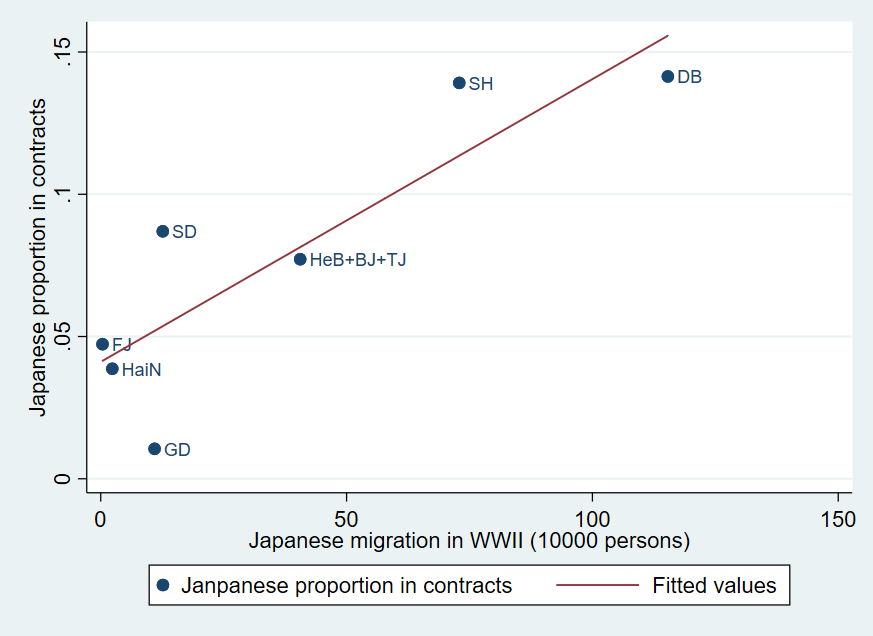
Figure 19: Contract numbers versus Japan’s migration scale
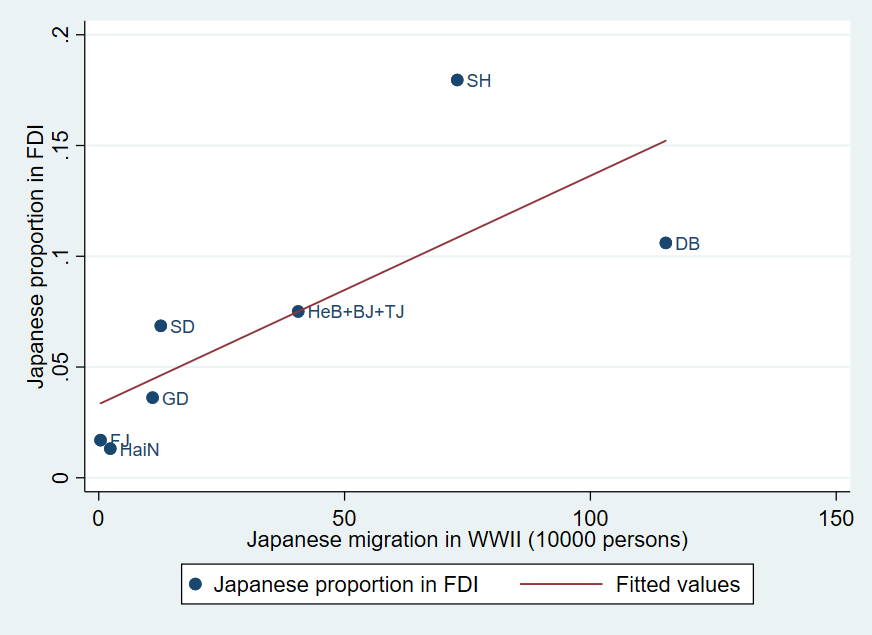
Figure 20: FDI versus Japan’s migration scale
From Figure 16 to Figure 20, two trends can be found.
First, in regions with Japan’s colonial migration, migration scale is positively correlated with Japanese proportion in five factors of Sino-Japan trade. This shows that the larger the scale of Japan’s colonial migration is, the more possible the region is to treat Japan as its significant trade partner in the long term.
However, it’s also worth noticing that some regions’ data points are far from the fitted lines. For example, Jiangsu (abbreviation: JS) in Figure 17 nearly tops the Figure though Japan’s colonial migration in this region is rather small. This reflects that the import market of Jiangsu relies strongly on Japan. Such conditions may indicate that to local governments and enterprises, migration scale is only a factor to consider when creating international trade decisions. They can adjust their standards and policies to cater to the status quo. Giving up considering historical factors like the Japanese migration scale is possible.
3.3. Summary
Through data analysis, it can be concluded that Japan’s colonial migration resulted in Chinese regions’ higher preference for Japan in international trade. Regions with Japanese migration are more commercially dependent on Japan than regions without Japanese migration. This effect is much more obvious in the export market than import market, contracts signed and FDI. It is also more obvious in regions that are less dependent on international markets. Plus, among regions with Japan’s colonial migration, regions with larger migration scales are more inclined to treat Japan as their significant partner.
However, overall, Japan’s colonial migration as a historic factor, cannot dominate the process of making international trade policies and decisions. Priority is often given to ‘realistic’ factors like cost, potential profits and local demands. Therefore, regions without migration or with a small migration scale can value Japan as a much more important trade partner than regions with a bigger migration scale. Regions with big migration scales can depend less on Japan in international trade if they rely more on the international market and have better choices.
Moreover, the influence of Japan’s colonial migration is like a double-edged sword. It brings about not only a cultural tendency in Chinese regions to trade with familiar partners but violence and historic hatred in these regions. If trading with Japan is of high cost, Japan’s colonial migration may have a negative effect on Sino-Japan trade.
4. Conclusion
This research concentrates on the long-term impact of Japanese colonial migration on Sino-Japan trade. The findings include: 1) In most cases, Japanese colonial migration has a positive long-term effect on Sino-Japan trade. 2) The migration scale is positively correlated with trade between two countries. 3) The impact of migration is demonstrated most obviously in export markets and Chinese regions less dependent on the international market. 4) In general, the impact of Japanese colonial migration is limited because the regional economic situation and whether the trade is cost-efficient are the first to consider when making trade decisions. 5)Under some circumstances, Japan’s colonial migration had a negative impact on Sino-Japan trade because high trade costs and historic hatred in these regions caused by violence during the war made people unwilling to trade with Japan.
However, this research has several shortages. Because research on how many Japanese immigrants stayed in China during WWII is lacking and the yearbooks don’t include some information about the Sino-Japan trade (i.e. the data of Tibet), the data used in this research may not be completely precise. Also, because the international policies in Taiwan, Hong Kong and Macau are totally different from China Mainland, they are excluded from this research. However, Japanese colonial migration in these three places are in a large scale and they also built solid economic cooperative relationships with Japan after the war. They should have been included in evaluating the impact of colonial migration on Sino-Japan trade.
Therefore, future researches are suggested to include more complete data and more precise data and take Taiwan, Hong Kong and Macau into consideration.
References
[1]. Wang, H., Fidrmuc, J., & Tian, Y. (2020). Growing against the background of colonization? Chinese labor market and FDI in a historical perspective. International Review of Economics & Finance, 69, 1018-1031.
[2]. Head, K., Mayer, T., & Ries, J. (2010). The erosion of colonial trade linkages after independence. Journal of international Economics, 81(1), 1-14.
[3]. Fidrmuc, J., & Fidrmuc, J. (2003). Disintegration and trade. Review of international economics, 11(5), 811-829.
[4]. Che, Y., Du, J., Lu, Y., & Tao, Z. (2015). Once an enemy, forever an enemy? The long-run impact of the Japanese invasion of China from 1937 to 1945 on trade and investment. Journal of International Economics, 96(1), 182-198.
[5]. Zhang, X., & Zhang, Y. (2015). The special subject history of ROC. Nanjing University Press, 2015(16),146-147.
[6]. This data comes from the statistical yearbooks of 2002 of all provinces in China. They are done by provincial bureau of statistics and published by China Statistical Press.
Cite this article
Wang,Y. (2024). Japanese Colonial Migration in China and Its Long-term Impacts on Sino-Japan Trade. Communications in Humanities Research,37,66-82.
Data availability
The datasets used and/or analyzed during the current study will be available from the authors upon reasonable request.
Disclaimer/Publisher's Note
The statements, opinions and data contained in all publications are solely those of the individual author(s) and contributor(s) and not of EWA Publishing and/or the editor(s). EWA Publishing and/or the editor(s) disclaim responsibility for any injury to people or property resulting from any ideas, methods, instructions or products referred to in the content.
About volume
Volume title: Proceedings of the 3rd International Conference on Literature, Language, and Culture Development
© 2024 by the author(s). Licensee EWA Publishing, Oxford, UK. This article is an open access article distributed under the terms and
conditions of the Creative Commons Attribution (CC BY) license. Authors who
publish this series agree to the following terms:
1. Authors retain copyright and grant the series right of first publication with the work simultaneously licensed under a Creative Commons
Attribution License that allows others to share the work with an acknowledgment of the work's authorship and initial publication in this
series.
2. Authors are able to enter into separate, additional contractual arrangements for the non-exclusive distribution of the series's published
version of the work (e.g., post it to an institutional repository or publish it in a book), with an acknowledgment of its initial
publication in this series.
3. Authors are permitted and encouraged to post their work online (e.g., in institutional repositories or on their website) prior to and
during the submission process, as it can lead to productive exchanges, as well as earlier and greater citation of published work (See
Open access policy for details).
References
[1]. Wang, H., Fidrmuc, J., & Tian, Y. (2020). Growing against the background of colonization? Chinese labor market and FDI in a historical perspective. International Review of Economics & Finance, 69, 1018-1031.
[2]. Head, K., Mayer, T., & Ries, J. (2010). The erosion of colonial trade linkages after independence. Journal of international Economics, 81(1), 1-14.
[3]. Fidrmuc, J., & Fidrmuc, J. (2003). Disintegration and trade. Review of international economics, 11(5), 811-829.
[4]. Che, Y., Du, J., Lu, Y., & Tao, Z. (2015). Once an enemy, forever an enemy? The long-run impact of the Japanese invasion of China from 1937 to 1945 on trade and investment. Journal of International Economics, 96(1), 182-198.
[5]. Zhang, X., & Zhang, Y. (2015). The special subject history of ROC. Nanjing University Press, 2015(16),146-147.
[6]. This data comes from the statistical yearbooks of 2002 of all provinces in China. They are done by provincial bureau of statistics and published by China Statistical Press.