


1. Introduction
According to Barrera Bello [1], the pink tax refers to charging higher prices for goods with the same quality marketed towards females compared with those to males. The term “pink tax” was first coined in the 1990s in California, when concerns about gendered price discrimination of services led to the explicit anti-price discrimination law, The Gender Tax Repeal Act [2]. Furthermore, the pink tax is also a type of price discrimination where the market and firms maximize their profits by minimizing consumers’ surplus by charging different prices to consumers in various demographic groups [3].
The pink tax takes advantage of the social norms imposed on females; some examples are stereotypical portrayals of women in mainstream culture and social needs [4]. Such social norms dictate expectations for gender-specific products and services, leaving the impression that the pink tax is standard practice for young female consumers. Also, this paper chooses to specifically focus on the pink tax on personal care products because women are often subject to expected gender roles and influence from media portrayals of gendered norms for femininity which require them to maintain beauty standard. This perpetuates a cycle where young female consumers continue to accept the pink tax by purchasing gendered personal care products, thereby reinforcing broader gender inequalities in consumer markets. In addition, while the pink tax influences consumers across all ages, this paper aims to examine young female consumers aged 18-30 who contribute most to the purchasing power and who are most strongly affected by the pink tax [5].
While the previous studies analyzed the pink tax in detail from an economic perspective and explored how different gender results in various perceptions, few take into consideration the possible impact of consumers’ sociode-mographic variables on their attitudes towards pink tax. This gap in previous research indicates the necessity for research to investigate what socio-demographic factors will influence consumers’ perception, attitude, and acceptance toward the pink tax.
Also, most fore-mentioned studies on pink tax were focusing on the European and North American context with a few exceptions that studied young female urban consumers in East Asia [6] and Southeast Asia [7]. Furthermore, few of the studies specifically targeted younger age groups. Ferrell et al. [3] gathered data from business students at universities. Chua et.al [7] targeted urban youth aged 18 to 30 years of old.
With the research gap in both socio-demographic variables and consumers in East Asian developing nations, this study aims to investigate whether socio-demographic factors influence the extent to which Chinese urban women consumers aged between 18 to 30 accept pink tax on personal care products. Especially considering the evolving consumer landscape in Asia’s developing economies, consumers in East Asian developing countries are very worth studying.
2. Literature Review
Many studies have focused on proving the existence of the pink tax and consumers' expectations and attitudes. For example, Ferrell et al. [3] explored consumers' expectations and attitudes about gender-based price discrimination by applying quantitative and qualitative methods. It examined whether consumers expect pink tax with different services and compared the attitudes of female and male consumers. Ferrell found that the expectations for gender-based pricing is contingent upon the gender-based difference in provision. And attitudes towards gender-based pricing are not contingent on the gender-based difference in provision. Women are not less favorable towards gender-based pricing. Fitzpatrick [8] used a scenario-based approach in vendors and found prices offered to women are 3% higher. Barrera Bello [1] studies the perceived price fairness among different gender. She found that, on average, the perception of price fairness among females was lower than that of males. Park [6] through qualitative analysis also proved the existence of pink tax in South Korea’s fashion industry. Please remember that all the papers must be in English and without orthographic errors.
Many economists investigated the economic mechanisms behind the pink tax. For example, Barnes [2] found that price elasticity of demand, competitive structure, marginal costs, and difference in purchasing habits of men and women all contributed to the pink tax. She cited a study by Mitchell and Wash [9], which concluded that male and female consumers’ decision-making styles vary greatly, which inspired this paper to investigate whether product quality, the latest fashion trend, and the level of shopping venues matter in the pricing of goods. On the other hand, Van der Tas [10] challenged the theory that the pink tax results from price discrimination based on women’s willingness to pay more for female-gendered products. She also stated that women were more sensitive to price than packaging than neutral gendered alternatives, inspiring us to investigate whether products’ different packaging, such as shape, color, and material, will contribute to price differences.
3. Methodology
This study covers five cities in China, including Beijing, Shanghai, Guangzhou, Chongqing, and Qingdao. Participants are young female consumers aged 18 to 30 and 500 questionnaires were distributed online through Wen Juan Xing in the five cities. Probability-proportional-to-size sampling was adopted in deciding the sample sizes for each of the five cities. Based on the data from the 7th National Population Census [11], the sample size for each city is determined. 102 participants are from Beijing, 115 from Shanghai, 84 from Guangzhou, 152 from Chongqing, and 47 from Qingdao.
The survey is divided into two sections: the first gathers respondents' demographic information through multiple-choice questions, while the second uses the Likert scale, including five options including strongly disagree (coded as 1), disagree (coded as 2), no feelings (coded as 3), agree (coded as 4), and strongly agree (coded as 5), assess consumers' perceptions of how product attributes, psychological factors, and external influences affect their attitudes toward the pink tax. The survey examines factors like packaging, effectiveness, emotional responses to alternatives, and the impact of social norms on acceptance of the pink tax.
H1: Younger female consumers are more willing to accept the pink tax.
H2: Female consumers who are married are more willing to accept pink tax compared to those who are not married.
H3: The higher the education attainment and disposable income female consumers have, the more likely for them to accept the pink tax.
H4: Occupation does not have a significant impact on female consumers’ acceptance of pink tax.
H5: Female consumers with ownership of home and local residents are more accepting of pink tax.
H6: Female consumers who are the only child in the family are more accepting of the pink tax than those who have siblings.
H7: Packaging factors including color, shape and material will lead to higher acceptance toward pink tax.
H8: Female consumers feel that avoiding the emotional burden of buying alternative products designed for men is partially why they accept pink tax.
H9: Female consumers are more likely to accept pink tax when taking the products’ effectiveness into consideration.
H10: Sociocultural factors including media stereotypes of women, perceived gender roles, and social needs lead to young female consumers’ higher level of acceptance to pink tax.
H11: Young female consumers’ pursuit of the latest fashion trend, quality of products, and high-end shopping location lead to young female consumers’ higher level of acceptance to pink tax.
4. Results
4.1. Descriptive Statistical Analysis of the Survey Data
Within the 500 samples, most participants fall under the age between 24 and 30. Participants who are 26-year-olds,28-year-olds, and 30-year-olds, each accounting for 15.2%, 14.2% and 13.8%. The sample is highly skewed towards those with at least a college degree. Participants with college diplomas account for 90.4%, and those with a graduate degree account for 8.4%. Two-thirds of the participants are professional technicians, office personnel, and service sector professionals (20.8%), each accounting for 22.6%,22.4%, and 20.8%. The sample reflects a relatively affluent population, more than half of whom have a monthly disposable income between 4,000 and 10,000 Chinese Yuan ($552 and $1381). Regarding home status, most respondents, 74.6%, don’t have ownership of the home. Most participants, 72.2%, have local Hukou, which indicates they were probably born in the five cities. Over 60% of respondents are not married, and only around 43% are the only child in the family. Most respondents, around 70%, feel unfair toward the pink tax imposed on personal care products. Their acceptance of pink tax varies across demographic variables (see Table 1 and Table 2).
Table 1: Attitudes towards pink tax compared across demographic variables
Age groups | Percent of respondents who strongly feel unfair about pink tax |
Aged 18-23 | 37.5% |
Aged 24-30 | 24.2% |
Marital Status | |
Married | 17.2% |
Unmarried | 33.1% |
Education level | |
Junior college educated and below | 27.1% |
University educated and above | 27.0% |
Monthly disposable income | |
Below 5000 CNY | 30% |
Above 5000 CNY | 29.4% |
Occupation Category | |
Professionals and technicians | 25.7% |
Office personnel | 26.8% |
Business and service professionals | 28.8% |
Full-time and part-time students | 33.3% |
Home ownership type | |
Women with home ownership | 16.5% |
Women without home ownership | 30.6% |
Hukou Status | |
Local Hukou | 26% |
Non-local Hukou | 29.5% |
Only Child | |
Yes | 39.1% |
No | 27.0% |
*1USD=7.24CNY (29th, April 2024)
Table 2: The extent to which different factors influence attitudes towards pink tax
Packaging factors | Percentage of participants choosing Agree or Strongly Agree |
Shape leads to price differences | 64.6% |
Color leads to price differences | 63% |
Material led to price differences | 85.8% |
Sociocultural factors | |
Media stereotypes of women | 70% |
Perceived gender roles | 69% |
Social needs | 65.4% |
Perceived vital factors in shopping | |
Fashion trend matters | 68.8% |
Quality of products matters | 93% |
Shopping location matters | 65.8% |
Factors women consumers consider when buying higher priced products | |
Product’s effectiveness | 94.4% |
Avoiding embarrassment | 42% |
Emotional burden | 49% |
Not mind buying alternative products for men | 59.45% |
Buying alternative products leads to emotional burden | 45.8% |
Perceive the existence of pink tax and feel it to be unfair | 65.2% |
Table 3: One-way ANOVA tests of whether demographic factors shape different responses
Factors | df | Response variable | F | P value |
Disposable income | 1 | Consider location as vital in shopping | 10.301 | 0.001 |
Housing ownership | 1 | Consider effectiveness of products influences the acceptance of higher prices | 7.077 | 0.008 |
Housing ownership | 1 | Consider latest trends as vital in shopping | 6.054 | 0.017 |
Hukou status | 1 | Experience emotional burden when substituting with generic personal care products | 5.497 | 0.019 |
Only child | 1 | Consider packaging material as a cause of pricing difference | 4.542 | 0.034 |
Table 4: ANOVA tests (Kruskal-Wallis) of how ordinal variables shape different responses
Factors | df | Response variables | P value |
Pkg_material | 4 | Perceived fairness of pink tax | 0.019 |
Table 5: t-tests of perceived fairness of pink tax across three demographic groups
Perceived fairness group 1 | Perceived fairness group 1 | T value | df | P value |
Married | Single | -3.475 | 190 | <0.001 |
The hypotheses of this study have been tested using a combination of descriptive statistics, t test, one-way ANOVA and the Kruskal-Wallis test for ordinal variables. If the p value being generated out is less than the significance level 0.05, then there is correlation between the factor and perception toward pink tax.
H1 is partially supported. Even though the statistical tests don’t show any differences across different age groups. The percentage of older women (24-30) who strongly agree that higher prices are unfair is considerably lower than that in the younger group (18-23), 24.2% and 37.5% (see Table 1).
H2 is fully supported, a descriptive statistical analysis found that only 17.2% of married consumers strongly feel unfair about pink tax, while 33.1% of single consumers feel the same (see Table 1). In addition, a paired sample t-test found a statistically significant difference between the fairness score reported by married and single respondents with a p-value of less than 0.001 (see Table 5).
H3 is partially supported. When grouping disposable income, the Kruskal-Wallis test reports a p value of 0.975 (see Table 4). Therefore, there is no significant difference in the fairness scores among different disposable income groups. However, the descriptive data shows that fewer women with higher monthly disposable income strongly feel unfair about pink tax than those with lower disposable income (see Table 1). In addition, the ANOVA test discovered disposable income plays a major role for consumers in terms of deciding their shopping locations, with ap value of 0.001.
H4 is fully supported by the ANOVA analysis (see Table 3), where the p value is 0.77. The descriptive statistics analysis of the percentage of those who strongly feel unfair about the pink tax does not vary significantly across the four different occupation categories.
Both H5 and H6 are partially supported. For H5, A descriptive analysis of how residents’ attitudes towards pink tax differ in terms of home ownership finds that fewer residents (16.5%) who have self-owned homes strongly feel unfair about pink tax than those without ownership (30.6%) (see Table 1). ANOVA tests found that respondents with different home statuses have significantly different perceptions of the product’s effectiveness, with ap value of 0.008. An independent t test on whether local Hukou and non-local Hukou residents have the same attitudes towards pink tax finds that they do not differ significantly. There is also no statistically significant difference between fairness scores reported by local and non-local respondents, with a p value of 0.486(see Table 3). However, when comparing the percentage of those who strongly agree that the pink tax is unfair, it is found that non-local residents feel more strongly about the unfairness than locals (see Table 1). ANOVA tests were conducted to examine the effects of demographics on shopping fashion attitudes in the sample of 500 participants. Both Hukou and home ownership status have significant effects on respondents’ attitudes regarding shopping fashion with p values of 0.017 and 0.001 (see Table 3). Through ANOVA test, the paper found Hukou status also greatly influences whether consumers will encounter emotional burden when purchasing alternative products with ap value of 0.019 (see Table 3).
H6 is partially supported. Descriptive statistical analysis found that consumers who are the only child in the family are more willing to accept the pink tax than consumers with siblings. However, the t-test analysis rejected the hypothesis that whether being the only child shapes the perceived fairness of the pink tax with p value of 0.871. In addition, the ANOVA test found that whether being the only child in the family influenced their perception of packaging material as a cause of pricing difference with a p value of 0.034.
H7 is partially supported,64%, 63%, and 85% of female consumers either strongly agree or agree that packaging’s shape, color, and material will influence different pricing of personal care products respectively. But when conducting Kurskal-Wallis test in ANOVA, only packaging’s material shows to have a direct relationship with acceptance towards different pricing with a p value of 0.019 (see Table 4).
H8 is being turned down as less than 50% of respondents agree that buying alternative products geared towards men will cause emotional burden (see Table 2).
H9 is fully supported with up to 94.4% of female consumers either strongly agree or agree on effectiveness of products will be taken into consideration when accepting pink tax (See Table 2).
For H10, a descriptive statistical analysis found that 70%,69%, and 65.4% of female consumers strongly agree or agree with media stereotypes of women, perceived gender roles, and social needs shape their attitude and acceptance toward pink tax (see Table 2).
H11 is partially supported, where more than 90% of respondents feel that they will accept higher priced products if the products have higher effectiveness. However, neither the need to avoid embarrassment nor the need to avoid emotional burden are the main reasons for women consumers who accept pink tax. In addition, it is found that around 60% of women don’t mind buying alternative products targeted to men to keep their budget low (see Table 2).
4.2. Comparative Analysis Across the Five Cities
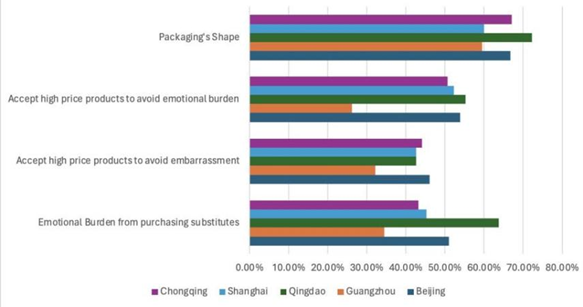
Figure 1: Percentage of respondents choosing Agree or Strongly Agree across the five cities
The paper analyzed the responses from the second section gained by the Likert scales and compared them across the five cities. A significant distinction appeared with “Emotional burden from purchasing substitutes", "Accept high price products to avoid embarrassment”, “Accept high price products to avoid emotional burden”, and “packaging’s shape”. Only 34.5%, 32.1%, 26.2%, and 59.5% of female consumers strongly agree or agree with these three factors that will lead to accepting higher prices, significantly lower compared to the remaining four cities. Overall, young female consumers in Guangzhou are least affected by various factors, such as psychological barriers and packaging attributes in their acceptance of the pink tax.
5. Conclusion
This study found that consumers from different age group, marital status, home ownership status differ significantly in their attitudes towards the fairness of pink tax. This sheds light on how these demographic variables contribute to different attitudes towards pink tax among young Chinese female consumers. Also, it found that female consumers with lower disposable income levels, especially students, feel strongly about the unfairness of pink tax [12]. Barnes [2] finds that women are more price elastic than men but does not examine how demographic variables might shape women consumers’ attitudes towards pink tax. However, this paper does not find disposable income a significant factor in their perceived unfairness.
This paper also confirms the observation that college educated women feel strongly about the unfairness of the pink tax [12]. However, the sample of the present study is heavily skewed towards highly educated women consumers.
On the other hand, this study finds that age, marital status, home ownership and Hukou status all play a role when comparing women’s perceived unfairness of pink tax across groups. We interpret this result to be attributed to two root causes, lower disposable income and willingness to question social norms. Female consumers in the younger age groups are more willing to challenge social norms being practiced on female and are more sensitive to gender based discriminatory pricing compared to those female consumers in older age group who may have become accustomed to them. Also, variables such as marital status, hukou status, and home ownership could partially represent the consumer's financial burden. For example, if a young female consumer is unmarried, local resident, and has ownership of her home. This may indicate that she has less financial burden so that she will be less sensitive to pink tax. The practice of pink tax may not be significant hardship for those young female consumers with less financial burden, but it will be a major hardship to those who have heavy financial burden.
The difference rating of perception of Guangzhou’s consumer could be explained from both economic and cultural perspective. From an economic perspective, because Guangzhou is a relatively developed city where residents may have higher average income levels and education levels, indicating that their economic burden is smaller. So, they are less sensitive to the practice of the pink tax. Guangzhou's retail market is also relatively competitive, leaving consumers with more choices and limiting the implementation of the pink tax. Compared with other cities, Guangzhou's cultural attitude and atmosphere are also more free; young women there have a greater understanding of gender- based price discrimination.
Understanding the factors behind young women's perceptions of the pink tax is crucial for consumers, businesses, and policymakers, enabling firms to align with customer values, and guiding policymakers in creating more effective regulations against gender-based price discrimination. But the study's reliance on quantitative methods and a skewed sample limits its generalizability. Future research should include both quantitative and qualitative approaches, a more diverse sample, and cross-cultural comparisons.
References
[1]. Barrera Bello, L.N. (2021). How Do Female and Male Consumers Respond to a “Pink Tax” ? (Doctoral dissertation, Europa_Universitat Viadrina Frankfurt). (2.3.1)
[2]. Barnes, K., & Brounstein, J. (2022). The Pink Tax: Why Do Women Pay More? SSRN Electronic Journal. https://doi.org/10.2139/ssrn.4269217
[3]. Ferrell, O. C., Kapelianis, D., Ferrell, L., & Rowland, L. (2018). Expectations and attitudes toward gender-based price discrimination. Journal of Business Ethics, 152, 1015-1032.
[4]. Fine, C., & Rush, E. (2018). “Why does all the girls have to buy pink stuff?” The ethics and science of the gendered toy marketing debate. Journal of Business Ethics, 149, 769-784.
[5]. Ou, X. (2024, Feb 23). Urban consumption in China from 2011 to 2021, by age group. [Chart]. Statista.https://www.statista.com/statistics/715552/china-urban-consumption-by-age-group/
[6]. Park, S. (2023). The occurrence and the background of ‘Pink Tax’, the interaction between consumers and industries. International Journal of Costume and Fashion, 23(1), 46-58.
[7]. Chua, A. B., Hidalgo, A., Huyo-a, J. J., & Santos, A. J. G. (2022). Pink power: The extent of awareness, driving factors, and overall perception ofFilipina youth consumers in Metro Manila, Philippines on pink tax caused by pink marketing strategy. Journal of business and management studies, 4(2), 277-293.
[8]. Fitzpatrick, A. (2017). Shopping While Female: Who Pays Higher Prices and Why?. American Economic Review, 107(5), 146-149.
[9]. Mitchell, V. W.,& Walsh, G. (2004). Gender differences in German consumer decision-making styles. Journal of Consumer Behaviour: An International Research Review, 3(4), 331-346.
[10]. Van der Tas, M.(2021). The Pink Tax: Marketing Strategy or Gender Discrimination? Comparing Female and Male Consumers ' Price and Packaging Preferences. [Master Thesis, University of Fribourg].
[11]. Office of the Leading Group of the State Council for the Seventh National Population Census. 2020. Zhongguo Renkou Pucha Nianjian-2020. [China Population Census Yearbook 2020] https://www.stats.gov.cn/sj/pcsj/rkpc/7rp/zk/indexch.htm
[12]. Reji, R., Nicholas, A., & Jignesh Shah, K. (2023). A Study on Perception of Female Consumers towards Pink Tax with Special Reference to Cochin City. [Bachelor Thesis St. Teresa’s College (Autonomous), Ernakulam].
Cite this article
Fu,Y. (2024). Investigating Factors Influencing Acceptance of Pink Tax on Personal Care Products among Chinese Urban Women. Communications in Humanities Research,42,118-125.
Data availability
The datasets used and/or analyzed during the current study will be available from the authors upon reasonable request.
Disclaimer/Publisher's Note
The statements, opinions and data contained in all publications are solely those of the individual author(s) and contributor(s) and not of EWA Publishing and/or the editor(s). EWA Publishing and/or the editor(s) disclaim responsibility for any injury to people or property resulting from any ideas, methods, instructions or products referred to in the content.
About volume
Volume title: Proceedings of 3rd International Conference on Interdisciplinary Humanities and Communication Studies
© 2024 by the author(s). Licensee EWA Publishing, Oxford, UK. This article is an open access article distributed under the terms and
conditions of the Creative Commons Attribution (CC BY) license. Authors who
publish this series agree to the following terms:
1. Authors retain copyright and grant the series right of first publication with the work simultaneously licensed under a Creative Commons
Attribution License that allows others to share the work with an acknowledgment of the work's authorship and initial publication in this
series.
2. Authors are able to enter into separate, additional contractual arrangements for the non-exclusive distribution of the series's published
version of the work (e.g., post it to an institutional repository or publish it in a book), with an acknowledgment of its initial
publication in this series.
3. Authors are permitted and encouraged to post their work online (e.g., in institutional repositories or on their website) prior to and
during the submission process, as it can lead to productive exchanges, as well as earlier and greater citation of published work (See
Open access policy for details).
References
[1]. Barrera Bello, L.N. (2021). How Do Female and Male Consumers Respond to a “Pink Tax” ? (Doctoral dissertation, Europa_Universitat Viadrina Frankfurt). (2.3.1)
[2]. Barnes, K., & Brounstein, J. (2022). The Pink Tax: Why Do Women Pay More? SSRN Electronic Journal. https://doi.org/10.2139/ssrn.4269217
[3]. Ferrell, O. C., Kapelianis, D., Ferrell, L., & Rowland, L. (2018). Expectations and attitudes toward gender-based price discrimination. Journal of Business Ethics, 152, 1015-1032.
[4]. Fine, C., & Rush, E. (2018). “Why does all the girls have to buy pink stuff?” The ethics and science of the gendered toy marketing debate. Journal of Business Ethics, 149, 769-784.
[5]. Ou, X. (2024, Feb 23). Urban consumption in China from 2011 to 2021, by age group. [Chart]. Statista.https://www.statista.com/statistics/715552/china-urban-consumption-by-age-group/
[6]. Park, S. (2023). The occurrence and the background of ‘Pink Tax’, the interaction between consumers and industries. International Journal of Costume and Fashion, 23(1), 46-58.
[7]. Chua, A. B., Hidalgo, A., Huyo-a, J. J., & Santos, A. J. G. (2022). Pink power: The extent of awareness, driving factors, and overall perception ofFilipina youth consumers in Metro Manila, Philippines on pink tax caused by pink marketing strategy. Journal of business and management studies, 4(2), 277-293.
[8]. Fitzpatrick, A. (2017). Shopping While Female: Who Pays Higher Prices and Why?. American Economic Review, 107(5), 146-149.
[9]. Mitchell, V. W.,& Walsh, G. (2004). Gender differences in German consumer decision-making styles. Journal of Consumer Behaviour: An International Research Review, 3(4), 331-346.
[10]. Van der Tas, M.(2021). The Pink Tax: Marketing Strategy or Gender Discrimination? Comparing Female and Male Consumers ' Price and Packaging Preferences. [Master Thesis, University of Fribourg].
[11]. Office of the Leading Group of the State Council for the Seventh National Population Census. 2020. Zhongguo Renkou Pucha Nianjian-2020. [China Population Census Yearbook 2020] https://www.stats.gov.cn/sj/pcsj/rkpc/7rp/zk/indexch.htm
[12]. Reji, R., Nicholas, A., & Jignesh Shah, K. (2023). A Study on Perception of Female Consumers towards Pink Tax with Special Reference to Cochin City. [Bachelor Thesis St. Teresa’s College (Autonomous), Ernakulam].