


1. Introduction
In the past, traditional media organizations acted as a tool of the bourgeoisie to control and rule the people, manipulating public opinion by creating false information and misleading content to control the people [1]. However, the emergence of the Internet allows for the diversification and high-speed dissemination of information with the advantages of freedom, democracy, openness, and interaction [2]. As a result of the prevalence of democratization, the bourgeoisie, decentralized and losing its dominant position, could only manipulate public opinion through indirect means to achieve its own ends [3]. Therefore, the paper aims to examine the attitudes of Douyin users towards social issues, public opinion, and social bots in the digital environment, and explore the willingness of Internet users to express their opinions when online public opinion and social bots produce and disseminate information that is consistent with or hostile to them. In addition, it seeks to address the question of whether the positions of online public opinion, user discourse, and social bots in the production and dissemination of event information are mutually interactive. Prior studies have only explored the relationship between any two of the three factors: online public opinion, user discourse, and the production and dissemination of information by social bots, while more discussion is needed on the complex relationship between the three. This paper aims to fill this research gap.More importantly, it delves into the role of the spiral of silence theory in news at different times, applying the theory’s original measurement criteria to the online public sphere. Meanwhile, it combines different norms of consideration and contributes to the spiral of silence theory from both empirical and theoretical perspectives.
2. Literature Review
2.1. The Spiral of Silence Theory and Its Application in the Digital Age
The spiral of silence theory is widely regarded as a comprehensive framework for analyzing public opinion [4]. Neumann identifies two principal conceptualisations of public opinion. The first is as a means of influencing decision-making processes within democratic societies. The second is as a mechanism for social control, which is evidenced by the spiral of silence and ensures alignment between state behaviour and public consensus [5]. Since its initial presentation in 1974, the theory has been subjected to rigorous examination across a multitude of contexts. The theory posits that individuals, fearful of social ostracism, initially assess prevailing public opinion before expressing their views, evaluating whether their opinions align with or diverge from the dominant discourse [6]. When an individual’s views align with mainstream opinions, they are more likely to participate in public discussion, thereby reinforcing the dominant narrative while marginalizing dissenting perspectives [7]. This dynamic poses a significant challenge to democratic engagement and the diversity of public discourse [8]. However, Preiss found that empirical findings from a large-scale 20-day study were inconsistent with the predictions of the spiral of silence theory, suggesting the need for broader applications that incorporate individuals’ perceptions of the public opinion climate [9]. Furthermore, the advent and proliferation of the Internet have introduced complexities in the theory’s application. While the open, democratic nature of online spaces fosters greater expression, it also amplifies individuals’ fear of exclusion, thereby perpetuating the spiral of silence in digital environments [10].
2.2. Media Manipulation and the Role of Social Bots in Shaping Opinion
Traditional media, including newspapers, television, and radio, were once the dominant channels for news dissemination, with the primary goal of conveying the truth behind events [11]. However, due to bourgeois monopolies, traditional media have been manipulated to serve their interests, often shaping public opinion to influence political outcomes [1]. The public’s heightened concern about unverified rumors and fake news, coupled with confirmation bias, predisposes individuals to accept familiar information regardless of its veracity [12]. Early on, traditional media and online public opinion were particularly susceptible to such bias, manipulating user discourse. While the rise of the Internet has facilitated more expression, the fear of social isolation persists, sustaining the spiral of silence in the digital age. A clear example is the spread of fake news, such as during the 2019 U.S. presidential election, when Trump’s tweets about fake news influenced public opinion and garnered support [13]. The proliferation of fake news is closely tied to the use of social bots, which manipulate online opinion by creating and disseminating false information [14]. Social bots not only distribute content but also alter users’ views on social issues by simulating human behavior (e.g., liking, sharing, and commenting), a phenomenon known as “social self” [15,16]. This causes users to perceive bots as human, increasing their susceptibility to the misinformation they spread, often resulting in silence or conformity to the dominant narrative [17]. In addition, social bots with persuasive capabilities can directly impact user attitudes and behaviors, making their intervention crucial in shaping users’ opinions [18].
2.3. Self-Presentation on Social Media and Symbolic Analysis of Public Opinion
In the real world, face-to-face self-presentation often induces shyness, leading many individuals to remain silent [19]. However, the anonymity provided by cyberspace transforms social media into a platform for free expression, allowing users to present their “better selves” without the constraints of real-world identification and providing ample time for reflection [20]. This anonymity not only encourages users to express themselves more openly but also facilitates social interaction, helping individuals expand their networks and build connections with like-minded people [21]. As a result, social media's relaxed environment fosters habitual self-expression, which, in turn, increases the motivation to share one’s views [10]. Particularly in the context of social issues, the popularity of certain events often leads to greater attention on the expressed opinions. The openness of the platform allows users to easily access and engage with these views, fostering a sense of attachment and resonance [22]. As more users adopt similar stances, the influence and direction of online public opinion gradually shift [23]. This process of opinion formation can be analyzed through semiotic theories. Roland Barthes’ semiotic concepts, such as signifier and signified, surface and punctuation, outlined in Mythologies, offer a theoretical foundation for linguistic and sociological analysis [24]. Through semiotic analysis, online public discourse can be understood as a system of symbols, revealing the deeper meanings and cultural values conveyed through both the expression and content of user-generated texts. This approach is particularly useful for examining the role of linguistic symbols in online public opinion and understanding the complex interplay between user discourse, information generation, and social bot dissemination.
2.4. Research Gap and Hypothesis
The study aims to explore the interrelationships between online opinion, user discourse, and social bots in information dissemination and to analyze the application of the spiral silence theory to digital environments. Thus, it is hypothesized that the perceived atmosphere of opposing opinions is negatively correlated with the willingness of individuals to express their opinions; there is a positive correlation between the production of social bots and online public opinion when they disseminate fake news and a negative correlation with the willingness of users to express their personal opinions. In addition, social robots serve as a moderating influence in in information dissemination, affecting the relationship between user discourse and online public opinion. When they spread fake news, a consistent opinion climate is positively correlated with individuals’ willingness to express their own opinions. Finally, individuals’ tendency to self-express on social media is also positively correlated with his or her willingness to express personal opinions online.
3. Methodology
3.1. Research Method and Selection
This research combines the quantitative research method of questionnaire survey and the qualitative research method of text analysis. Questionnaire surveys are chosen mainly due to their efficiency in saving time, money, and human resources, while quickly yielding results [25], permitting efficient returns with less investment and is easily quantifiable for statistics and analysis [26]. Moreover, the questionnaire format allows access to a large number of respondents, ensures adequate sample size, and improves response rates and data quality due to its flexibility [27]. In addition, text analysis, as a qualitative research method, has the advantages of being in-depth, interpretive and illuminating. It can explore the reasons and motives behind the text, helps to understand the deeper meaning of language, and stimulates new perspectives of thinking [28].
3.2. Sample Description
In the respondent recruitment and selection, the study used the WJX platform and combined it with a sample service, which ensures the randomness of the sample and the representativeness of the sample. In addition, the total number of samples in this study was 492, and 414 valid samples were screened out by using sample services. Among them, the number of male samples is 163, and the total number of female samples is 251, aged 18 years and above. The respondents were all Chinese Internet users who were required to have known and come into contact with social bots that produce and disseminate information in the course of using the Internet.
3.3. Sampling Process and Data Collection
In this study, the WJX platform was used as a recruitment channel and its sample service was used. Specifically, it sets an age and whether or not the person knows or has been in contact with the human-machine number as restriction conditions to select more representative samples as data. In addition, the data for this study were collected from Chinese Internet users, and respondents were recruited from potential participants on the Chinese Internet. The sampling method used was option quota sampling, including five age groups: 18 to 29 years old (n=228), 30 to 40 years old (n=172), 41 to 50 years old (n=8), 51 to 60 years old (n=6) and over 60 years old (n=0). Educational attainment was divided into four levels: below college (n=30), undergraduate (n=343), postgraduate (n=38), and doctorate and above (n=3). The gender ratio of the sample was nearly balanced (male, n=163; female, n=251). The collection of questionnaires ends when quotas are balanced or similar in two gender groups. The utilization of such sampling process allows for a more representative sample due to the cross-gender, cross-age, and cross-age-of-education design, and the similar gender ratio of the sample allows for accurate survey sampling and reduced survey bias. This survey was conducted on a specialized online questionnaire survey platform, WJX. After the respondents agreed to participate in the study, they were required to answer questions in the process based on their previous experience in media use and perception and contact with social robots that produce and disseminate information. In addition, after the respondents completed the questionnaire, the raw data were automatically included in the sample pool in the backend of the WJX system.
3.4. Measurement Method
Prior to the formal online survey, the questionnaire was submitted to the local institutional review board for approval to comply with academic ethics. Also, personal information from respondents was collected, including five age groups and two gender options for respondents to choose from. Once these preparations were completed, the formal questionnaire commenced. The study utilizes a five-point scale ranging from 1 (strongly disagree), 3 (neutral) to 5 (strongly agree), with the correct answer coded as 5.
H1 refers to the study Under Surveillance: Examining Facebook’s Spiral of Silence Effects in the Wake of NSA Internet Monitoring [8], which found that the ordinary least squares (OLS) regression model explains 32% of the variance in individuals’ willingness to voice opinion online, with a great negative impact from the opinion environment (β=−.18, p <0.05). The highly significant correlation provides compelling evidence that the hypothesis of this study is a robust and reliable one. H2, H3, and H4 are all based on the findings in Making Social Robots More Attractive: The Effects of Voice Pitch, Humor and Empathy [29], which found that when social robots randomly enter the network and create and spread false information, the tendency of online public opinion to its position and the willingness of individuals to express their opinions change with the changes in its position. Internal validity is ensured by measuring the random variation, thereby ensuring credibility. In other words, this indicates that the hypotheses of these studies are reliable and valid. H5 refers to the impact of interdependence in online public spheres: How community-level interactions affect the evolution of topics in online discourse published [30]. The study used multiple regression analysis to conclude that the amount of user interaction in the online community will significantly affect the direction of online public opinion. Therefore, the significant correlation proves that the reliability of this study hypothesis is high.
In addition, the data were analyzed using SPSS tools. In this process, reliability analysis was to ensure the credibility of the sample, which provided consistency and stability to the results while validating the accuracy of the measurement tools. Correlation analysis was to ensure that there is a correlation between online public opinion, user discourse, and social robots (variables) to prepare for the subsequent establishment of linear regression analysis. Exploratory factor analysis was used to measure each factor and explain the rationality of the dimensional structure of the scale to a large extent. Validity analysis was to ensure the consistency and fit between the measurement tools and concepts, which can make the research results valid. Based on the correlation between the three variables, a linear regression analysis (mediated effects analysis) was then conducted to explore whether the relationship between the three variables was relevant and significant.
4. Results
4.1. Reliability Analysis
To verify the reliability of Likert scale and the consistency and stability of the sample, Cronbach’s alpha was used to test the reliability of the data. After deleting Q7, Q8, and Q10, a=0.627 and I=2 can be obtained. At this point, the data satisfies a>=0.6, and I>=2, indicating that the research has a certain reference value.
4.2. Correlation Analysis
To test the correlation between online public opinion (a), willingness to express opinions (b), and the information production and dissemination by social bots (c), these three aspects were analyzed as variables for correlation analysis. The results indicate that the significance (R) between a and b = 0.000, with Pearson correlation coefficient (P) and |P| both at 0.776. R between a and c = 0.000, with P and |P| both at 0.763. R between b and c is 0.000, with P and |P| both at 0.787. All three relationships have R values less than 0.05, and P and |P| are between -1 and 1, close to 1, indicating a strong correlation among the variables. More studies have used validity analysis (also known as exploratory factor analysis) to demonstrate whether questionnaires are valid. This paper uses Likert scale questions as five variables to explore the factors that affect the relationship. From the KMO and Bartlett test, the KMO sampling suitability measure = 0.626 (KMO>0.6), and the significance in the Bartlett sphericity test = 0.000 (Bartlett<0.05). Therefore, the data sample is suitable for factor analysis.
It can be seen that the extracted factors are not significant due to the large number of variable indicators in the study, so it is necessary to extract the common factor variables after rotating the factors. In the total variance explained, there are two factors with characteristic roots greater than one. The first factor explains 36.490% of the total variance, and the second factor explains 20.230% of the total variance. The cumulative variance explanation rate of these two common factors is 56.720%, and the proportion is greater than 50%, proving that the factor analysis results are valid. It has certain research significance. In Figure 1, it is possible to judge whether the common factor can be extracted more intuitively. Among them, the factor with a characteristic root greater than one can be extracted. Based on this, the first two factors shown in the figure can be obtained.
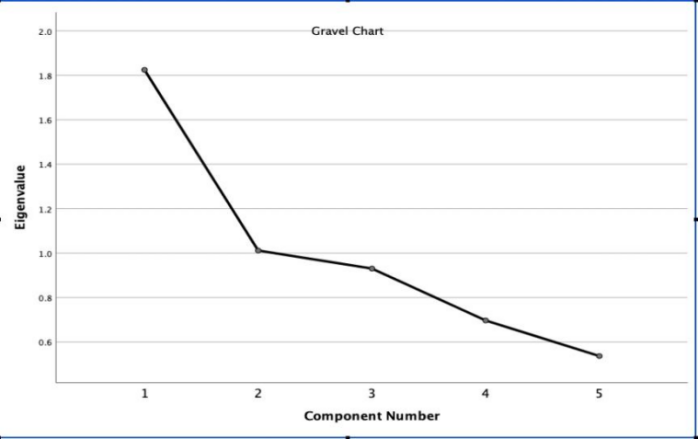
Figure 1: Gravel Chart
As shown in Table 1, the absolute values of variables 1, 2 and 5 have higher loading values in component one. The absolute values of variables two and four have higher loading values in component two. In addition, the absolute values of the factor loading coefficients for variables 1, 2, 3, 4 and 5 are all greater than 0.4, which indicates that components one and two are closely related to these five questions. This shows that these five scale questions are justified on the scale.
Table 1: Rotated Component Matrix
1 | 2 | |
The degree to which an individual is willing to express his or her opinions in a hostile environment | 0.865 | 0.060 |
The degree to which human and machine users create and disseminate information on the internet and influence online public opinion | 0.819 | 0.201 |
The extent to which the opposing views of human and machine users affect individuals’ willingness to express their opinions | 0.042 | 0.781 |
In a consistent online public opinion atmosphere, the degree to which the opinions of human and machine users influence the willingness of individuals to express their opinions | 0.163 | 0.727 |
The influence of individual opinions on online public opinion | 0.084 | 0.446 |
As shown in Table 2, it can be seen that the covariance between components one and two is equal to 0, which ensures that the rotated components are independent of each other.
Table 2: Component Score Covariance Matrix
Element | 1 | 2 |
1 | 1.000 | 0.000 |
2 | 0.000 | 1.000 |
This confirms that the two components are independent, indicating a good level of structural validity for the data.
4.3. Linear Regression (Mediation Effect Analysis)
This study uses two univariate regression analyses (models 1 and 2) and two hierarchical regression analyses (models 3 and 4, 5 and 6) to further explore the complex relationship between Online public opinion (a), individual willingness to express opinions (b), and Social robots (human-machine) that produce and disseminate information (c). (The dependent variable in the chart is Y and the independent variable is X). As shown in Table 3, 4, 5 and 6, six models of R2 are close to 1, which shows that all of model fits well and can explain the variation in a. Moreover, they are in the Durbin-Watson test between 0 and 4, which can be considered that the data is independent.
Table 3: Summary of Model 1b
Model | R | R Square | Adjusted R-squared | Error in standard estimates | Durbin Watston |
1 | .763a | .582 | .581 | .37744 | 1.984 |
a. Predictor variables: (constant), a
b. Dependent variable: c
Table 4: Summary of Model 2b
Model | R | R Square | Adjusted R-squared | Error in standard estimates | Durbin Watston |
2 | .787a | .620 | .619 | .35978 | 1.962 |
a. Predictor variables: (constant), b
b. Dependent variable: c
Table 5: Summary of Model 3 and 4c
Change Statistics | ||||||||||
Model | R | R Square | Adjusted R-squared | Error in standard estimates | R-squared change | F Change | Degrees of Freedom 1 | Degrees of Freedom 2 | Significant F change | Durbin Watston |
3 | .860a | .739 | .738 | .27882 | .739 | 1165.454 | 1 | 412 | .000 | 1.998 |
4 | .883b | .780 | .779 | .25602 | .042 | 77.647 | 1 | 411 | .000 | 1.983 |
a. Predictor variables: (constant), a
b. Predictor variables: (constant), a & c
c. Dependent variable: b
Table 6: Summary of Model 5 and 6c
Change Statistics | ||||||||||
Model | R | R Square | Adjusted R-squared | Error in standard estimates | R-squared change | F Change | Degrees of Freedom 1 | Degrees of Freedom 2 | Significant F change | Durbin Watston |
5 | .860a | .739 | .738 | .29513 | .739 | 1165.454 | 1 | 412 | .000 | 2.004 |
6 | .871b | .758 | .757 | .28430 | .019 | 32.992 | 1 | 411 | .000 | 2.011 |
a. Predictor variables: (constant), b
b. Predictors: (constant), b & c
c. Dependent variable: a
In six models of ANOVA, all of P = 0.000 (P<0.05). Therefore, the overall results of the six models are significant, which indicates that there is a significant linear relationship between the variables. According to Table 7, 8, 9 and 10, six models of VIF are less than 10. Therefore, there are no collinearity in these models. At the same time, the P values of X in the six models are all less than 0.05, which has a significant impact on Y.
Table 7: Coefficient of Model 1a
Non-standardized coefficient | Standardized coefficient | Collinearity Statistics | ||||||
Model | B | Standard Error | Beta | t | Significance | Tolerance | VIF | |
1 | (constant) | .726 | .122 | 5.972 | .000 | |||
a | .771 | .032 | .763 | 23.929 | .000 | 1.000 | 1.000 | |
a. Dependent variable: c
Table 8: Coefficient of Model 2a
Non-standardized coefficient | Standardized coefficient | Collinearity Statistics | ||||||
Model | B | Standard Error | Beta | t | Significance | Tolerance | VIF | |
2 | (constant) | .633 | .116 | 5.461 | .000 | |||
b | .842 | .032 | .787 | 25.915 | .000 | 1.000 | 1.000 | |
a. Dependent variable: c
Table 9: Coefficient of Model 3 and 4a
Non-standardized coefficient | Standardized coefficient | Relevance | Collinearity Statistics | ||||||||
Model | B | Standard Error | Beta | t | Significance | Zero Order | Bias | part | Tolerance | VIF | |
3 | (constant) | .495 | .090 | 5.515 | .000 | ||||||
a | .812 | .024 | .860 | 34.139 | .000 | .860 | .860 | .860 | 1.000 | 1.000 | |
4 | (constant) | .281 | .086 | 3.275 | .001 | ||||||
a | .585 | .034 | .619 | 17.330 | .000 | .860 | .650 | .401 | .418 | 2.390 | |
c | .294 | .033 | .315 | 8.812 | .000 | .787 | .399 | .204 | .418 | 2.390 | |
a. Dependent variable: b
Table 10: Coefficient of Model 5 and 6a
Non-standardized coefficient | Standardized coefficient | Relevance | Collinearity Statistics | ||||||||
Model | B | Standard Error | Beta | t | Significance | Zero Order | Bias | part | Tolerance | VIF | |
5 | (constant) | .524 | .095 | 5.511 | .000 | ||||||
b | .910 | .027 | .860 | 34.139 | .000 | .860 | .860 | .860 | 1.000 | 1.000 | |
6 | (constant) | .382 | .095 | 4.032 | .000 | ||||||
b | .722 | .042 | .682 | 17.330 | .000 | .860 | .650 | .420 | .380 | 2.630 | |
c | .224 | .039 | .226 | 5.744 | .000 | .763 | .273 | .139 | .380 | 2.630 | |
a. Dependent variable: a
In short, in the result analysis of the F test, it can be concluded that the significance P=0.000 is significant at the level, and the null hypothesis that the regression coefficient is 0 is rejected. Therefore, model 1-6 meets the requirements. In terms of the collinearity of the variables, VIF <10, so there is no multicollinearity problem in the model, and the model construction is good. The formula of the regression model is as follows:
Y=0.726+0.771*X (model1)(1)
Y=0.633+0.842*X (model2)(2)
Y=0.495 + 0.812*X(model3)(3)
Y=0.281+0.585*Xa+0.294*Xb(model4)(4)
Y=0.524+ 0.910 *Xb (model5)(5)
Y=0.382+0.722*Xb+0.224*Xc (model6)(6)
Based on this, we can derive the overall regression coefficient B1=3.6019071, B2=3.6003764, B3=3.5238412, B4=3.5214497, B5=3.918391, B6=3.8814874, which is not equal to 0, indicating that there is a regression relationship between the variables. By comparing the overall regression coefficient B3 and B4, the absolute value of B4 (|B4|=3.5214497) / B6 (|B6|=3.8814874)<B3 (B3=3.5238412) /B5 (B5=3.918391), which indicates that the mediating effect of m is significant and acts as a partial mediating effect.
4.4. Results Analysis and Hypothesis Testing
In Model 1, the regression coefficient value of c is B1 = 3.6019 (t = 23.929, p < 0.05), indicating that c has a significant positive effect on a. Therefore, Hypothesis 2 is accepted. In Model 2, the regression coefficient of c is B2 = 3.6004 (t = 25.915, p < 0.05), which means that c also has a significant positive effect on b. Therefore, Hypothesis 4 is accepted. In model 3, the regression coefficient of b is B3 = 3.5238 (t = 34.139, p < 0.05), which indicates that b has a significant positive effect on a. Therefore, hypothesis 5 is accepted. In model 4, the regression coefficient of b is B4 = 3.5214 (t = 8.812, p < 0.05), which indicates that b has a significant positive effect on c. The regression coefficient value of |B4| is B2 = 3.6004 (t = 25.915), which indicates that c also has a significant positive effect on b. The comparison reveals that |B4| < B3 (|B4| = 3.5214, B3 = 3.5238), indicating that the mediating effect of M is significant and presents a partial mediating effect. This suggests that a has a more significant positive effect on b through c. Hypothesis 4 is thus accepted. In model 5, the regression coefficient of a is B5 = 3.9184 (t = 34.139, p < 0.05), which indicates that a has a significant positive effect on b. Therefore, hypothesis 1 is accepted. In model 6, the regression coefficient of a is B6 = 3.8815 (t = 5.744, p < 0.05), which indicates that a has a more significant positive effect on c. The regression coefficient of a is B6 = 3.8815 (t = 5.744, p < 0.05). The comparison shows that |B6| < B5 (|B6| = 3.8815, B5 = 3.9184), further indicating that the mediation effect of M is significant and presents a partial mediation effect. This means that the positive effect of b on a through c is more significant, and therefore Hypothesis 3 is accepted. In short, the six regression models not only verified the five hypotheses, but found two new significant positive influence relationships of b on c and a on c.
4.5. Difference Analysis
The independent sample t-test and one-way ANOVA were used to examine the differences in three variables, online public opinion (a), individual willingness to express (b), and the role of social robots (human-machine) in information production and dissemination (c), based on gender, age, and education level. The independent sample test results show that for variable a, significance P = 0.651 (P > 0.05), sig. (two-tailed) = 0.235; for variable b, significance P = 0.058 (P > 0.05), sig. (two-tailed) = 0.086; and for variable c, significance P = 0.306 (P > 0.05), sig. (two-tailed) = 0.307. This indicates that there are no significant gender differences across the three variables. In the one-way ANOVA analysis for age and education level, results show that the significance P-values for all three variables are greater than 0.05, indicating that homogeneity of variance is met. In the multiple comparisons, variable b has a significant P-value of 0.087 (P < 0.05) within the age group, with a mean difference of 0.09420, indicating that respondents aged 30-40 have a more positive attitude toward variable b than those aged 18-29. Overall, aside from the significant impact of age on variable b, gender and education level show no significant differences across the three variables.
5. Conclusion
Based on the spiral of silence theory and combined with quantitative study through a questionnaire survey, the paper employed SPSS for reliability analysis, correlation analysis, exploratory factor analysis (validity analysis), linear regression analysis (mediating effect analysis), and difference analysis to explore the complex relationships between online public opinion depth, user willingness to express, and social robots in information production and dissemination. The results support five hypotheses and reveal two new significant variable relationships, enriching the understanding of the interaction mechanisms among online public opinion, user willingness, and social bots. Despite the rich findings of this study, certain limitations remain. In particular, the questionnaire survey method is constrained by the diverse backgrounds of respondents, which may affect the response rate and data quality due to uncontrollable factors. Furthermore, the impact of the online public opinion atmosphere was not controlled in the questionnaire design and data analysis, potentially impacting respondents’ subjective perceptions of the online environment and affect the accuracy of the data to a certain extent. Further studies should introduce control variables to explore the relationship of variables in different opinion atmospheres and enhance the interpretability of the data and the robustness of the results. The combination of methods, such as in-depth interviews or focus groups, has the potential to address the limitations of the questionnaire survey in uncovering more profound issues, thereby facilitating a more comprehensive understanding.
References
[1]. Habermas, J. (2019) The Public Sphere: An Encyclopedia Article (1974). In Routledge eBooks, 11–19.
[2]. Vaske, J.J. (2011) Advantages and Disadvantages of internet Surveys: Introduction to the special issue. Human Dimensions of Wildlife, 16(3): 149-153.
[3]. Garrod, J. (2016) The real world of the decentralized autonomous society. tripleC Communication Capitalism & Critique Open Access Journal for a Global Sustainable Information Society, 14(1).
[4]. Scheufle, D.A., and Moy, P. (2000). TWENTY-FIVE YEARS OF THE SPIRAL OF SILENCE: a CONCEPTUAL REVIEW AND EMPIRICAL OUTLOOK. International Journal of Public Opinion Research, 12(1): 3-28.
[5]. Noelle-Neumann, E. (1974) The spiral of silence a theory of public opinion. Journal of Communication, 24(2): 43-51.
[6]. Noelle-Neumann, E. (1993). The spiral of silence: Public Opinion--Our Social Skin. University of Chicago Press.
[7]. Matthes, J. (2014) Observing the “Spiral” in the spiral of silence. International Journal of Public Opinion Research, 27(2), 155-176.
[8]. Stoycheff, E. (2016). Under surveillance. Journalism & Mass Communication Quarterly, 93(2), 296-311.
[9]. Preiss, R.W. (2007) Mass Media Effects research: Advances Through Meta-analysis. Psychology Press.
[10]. Hakobyan, A. (2020) Digitalization of Communication and the Spiral of Silence Theory. Wisdom, 14(1), 19-30.
[11]. Harcup, T. and O’Neill, D. (2016) What is News? Journalism Studies, 18(12): 1470-1488.
[12]. Michela, D. V., Gaito, S., Quattrociocchi, W., Zignani, M., & Zollo, F. (2017, February 20). Public discourse and news consumption on online social media: A quantitative, cross-platform analysis of the Italian Referendum.
[13]. Wright, S. (2021) Special issue: Discourses of Fake news: $hedited by Scott Wright.
[14]. Chen, L., Chen, J. and Xia, C. (2022). Social network behavior and public opinion manipulation. Journal of Information Security and Applications, 64, 103060.
[15]. Wischnewski, M., Ngo, T., Bernemann, R., Jansen, M. and Krämer, N. (2022). “I agree with you, bot!” How users (dis)engage with social bots on Twitter. New Media & Society, 26(3): 1505-1526.
[16]. Bakardjieva, M. (2015) Rationalizing Sociality: an unfinished script for Socialbots. The Information Society, 31(3), 244-256.
[17]. Ibrahim, Y. and Safieddine, F. (2020). Fake news in an era of social media: Tracking Viral Contagion. Rowman & Littlefield.
[18]. Breazeal, C. (2008) Persuasive robotics : how robots change our minds.
[19]. Bazarova, N. N., & Choi, Y. H. (2014). Self-Disclosure in social media: Extending the functional approach to disclosure motivations and characteristics on social network sites. Journal of Communication, 64(4), 635-657.
[20]. Schlosser, A.E. (2020). Self-disclosure versus self-presentation on social media. Current Opinion in Psychology, 31: 1-6.
[21]. Wang, M., Zuo, W. and Wang, Y. (2016). An improved density peaks-based clustering method for social circle discovery in social networks. Neurocomputing, 179: 219-227.
[22]. McGregor, S.C. (2019). Social media as public opinion: How journalists use social media to represent public opinion. Journalism, 20(8), 1070-1086.
[23]. Pang, H. and Zhang, K. (2024). Determining the influence of service quality on user identification, belongingness, and satisfaction on mobile social media: Insight from an emotional attachment perspective. Journal of Retailing and Consumer Services, 77: 103688.
[24]. Christensen, H.D. (2010) Roland Barthes: On semiology and taxonomy. Critical Theory for Library and Information Science, 15.
[25]. Lavrakas, P.J. (2008) Encyclopedia of Survey Research Methods. SAGE Publications.
[26]. Addington-Hall, J.M. (2007). Survey research: methods of data collection, questionnaire design and piloting. In Oxford University Press eBooks, 61-82.
[27]. Hoonakker, P. and Carayon, P. (2009). Questionnaire survey nonresponse: A comparison of postal mail and internet surveys. International Journal of Human-Computer Interaction, 25(5), 348-373.
[28]. Kuckartz, U. (2014) Qualitative text analysis: A guide to methods, practice and using software.
[29]. Ross, B., et al. (2019). Are social bots a real threat? An agent-based model of the spiral of silence to analyse the impact of manipulative actors in social networks. European Journal of Information Systems, 28(4): 394–412.
[30]. Yang, A., et al. (2021). The influence of interdependence in Networked Publics spheres: How Community-Level Interactions affect the evolution of topics in online discourse. Journal of Computer-Mediated Communication, 26(3), 148-166.
Cite this article
Li,J. (2024). Exploring the Relationship Between Online Public Opinion, User Discourse, and Social Bot Production and Information Dissemination. Communications in Humanities Research,61,20-30.
Data availability
The datasets used and/or analyzed during the current study will be available from the authors upon reasonable request.
Disclaimer/Publisher's Note
The statements, opinions and data contained in all publications are solely those of the individual author(s) and contributor(s) and not of EWA Publishing and/or the editor(s). EWA Publishing and/or the editor(s) disclaim responsibility for any injury to people or property resulting from any ideas, methods, instructions or products referred to in the content.
About volume
Volume title: Proceedings of the 4th International Conference on Literature, Language, and Culture Development
© 2024 by the author(s). Licensee EWA Publishing, Oxford, UK. This article is an open access article distributed under the terms and
conditions of the Creative Commons Attribution (CC BY) license. Authors who
publish this series agree to the following terms:
1. Authors retain copyright and grant the series right of first publication with the work simultaneously licensed under a Creative Commons
Attribution License that allows others to share the work with an acknowledgment of the work's authorship and initial publication in this
series.
2. Authors are able to enter into separate, additional contractual arrangements for the non-exclusive distribution of the series's published
version of the work (e.g., post it to an institutional repository or publish it in a book), with an acknowledgment of its initial
publication in this series.
3. Authors are permitted and encouraged to post their work online (e.g., in institutional repositories or on their website) prior to and
during the submission process, as it can lead to productive exchanges, as well as earlier and greater citation of published work (See
Open access policy for details).
References
[1]. Habermas, J. (2019) The Public Sphere: An Encyclopedia Article (1974). In Routledge eBooks, 11–19.
[2]. Vaske, J.J. (2011) Advantages and Disadvantages of internet Surveys: Introduction to the special issue. Human Dimensions of Wildlife, 16(3): 149-153.
[3]. Garrod, J. (2016) The real world of the decentralized autonomous society. tripleC Communication Capitalism & Critique Open Access Journal for a Global Sustainable Information Society, 14(1).
[4]. Scheufle, D.A., and Moy, P. (2000). TWENTY-FIVE YEARS OF THE SPIRAL OF SILENCE: a CONCEPTUAL REVIEW AND EMPIRICAL OUTLOOK. International Journal of Public Opinion Research, 12(1): 3-28.
[5]. Noelle-Neumann, E. (1974) The spiral of silence a theory of public opinion. Journal of Communication, 24(2): 43-51.
[6]. Noelle-Neumann, E. (1993). The spiral of silence: Public Opinion--Our Social Skin. University of Chicago Press.
[7]. Matthes, J. (2014) Observing the “Spiral” in the spiral of silence. International Journal of Public Opinion Research, 27(2), 155-176.
[8]. Stoycheff, E. (2016). Under surveillance. Journalism & Mass Communication Quarterly, 93(2), 296-311.
[9]. Preiss, R.W. (2007) Mass Media Effects research: Advances Through Meta-analysis. Psychology Press.
[10]. Hakobyan, A. (2020) Digitalization of Communication and the Spiral of Silence Theory. Wisdom, 14(1), 19-30.
[11]. Harcup, T. and O’Neill, D. (2016) What is News? Journalism Studies, 18(12): 1470-1488.
[12]. Michela, D. V., Gaito, S., Quattrociocchi, W., Zignani, M., & Zollo, F. (2017, February 20). Public discourse and news consumption on online social media: A quantitative, cross-platform analysis of the Italian Referendum.
[13]. Wright, S. (2021) Special issue: Discourses of Fake news: $hedited by Scott Wright.
[14]. Chen, L., Chen, J. and Xia, C. (2022). Social network behavior and public opinion manipulation. Journal of Information Security and Applications, 64, 103060.
[15]. Wischnewski, M., Ngo, T., Bernemann, R., Jansen, M. and Krämer, N. (2022). “I agree with you, bot!” How users (dis)engage with social bots on Twitter. New Media & Society, 26(3): 1505-1526.
[16]. Bakardjieva, M. (2015) Rationalizing Sociality: an unfinished script for Socialbots. The Information Society, 31(3), 244-256.
[17]. Ibrahim, Y. and Safieddine, F. (2020). Fake news in an era of social media: Tracking Viral Contagion. Rowman & Littlefield.
[18]. Breazeal, C. (2008) Persuasive robotics : how robots change our minds.
[19]. Bazarova, N. N., & Choi, Y. H. (2014). Self-Disclosure in social media: Extending the functional approach to disclosure motivations and characteristics on social network sites. Journal of Communication, 64(4), 635-657.
[20]. Schlosser, A.E. (2020). Self-disclosure versus self-presentation on social media. Current Opinion in Psychology, 31: 1-6.
[21]. Wang, M., Zuo, W. and Wang, Y. (2016). An improved density peaks-based clustering method for social circle discovery in social networks. Neurocomputing, 179: 219-227.
[22]. McGregor, S.C. (2019). Social media as public opinion: How journalists use social media to represent public opinion. Journalism, 20(8), 1070-1086.
[23]. Pang, H. and Zhang, K. (2024). Determining the influence of service quality on user identification, belongingness, and satisfaction on mobile social media: Insight from an emotional attachment perspective. Journal of Retailing and Consumer Services, 77: 103688.
[24]. Christensen, H.D. (2010) Roland Barthes: On semiology and taxonomy. Critical Theory for Library and Information Science, 15.
[25]. Lavrakas, P.J. (2008) Encyclopedia of Survey Research Methods. SAGE Publications.
[26]. Addington-Hall, J.M. (2007). Survey research: methods of data collection, questionnaire design and piloting. In Oxford University Press eBooks, 61-82.
[27]. Hoonakker, P. and Carayon, P. (2009). Questionnaire survey nonresponse: A comparison of postal mail and internet surveys. International Journal of Human-Computer Interaction, 25(5), 348-373.
[28]. Kuckartz, U. (2014) Qualitative text analysis: A guide to methods, practice and using software.
[29]. Ross, B., et al. (2019). Are social bots a real threat? An agent-based model of the spiral of silence to analyse the impact of manipulative actors in social networks. European Journal of Information Systems, 28(4): 394–412.
[30]. Yang, A., et al. (2021). The influence of interdependence in Networked Publics spheres: How Community-Level Interactions affect the evolution of topics in online discourse. Journal of Computer-Mediated Communication, 26(3), 148-166.