


1. Introduction
There are more Japanese language schools and students in China than any other country, according to the Survey Report on Japanese-Language Education Abroad 2021. As a result, the acquisition of Japanese phonetics by L1 Mandarin speakers has emerged as a key research focus, especially as it relates to phenomena like vowel devoicing and the Japanese pitch accent. Mandarin, as a tonal language, has a distinct phonetic system from Japanese, which uses a pitch accent system. And this difference, coupled with the vowel devoicing, poses challenges to Mandarin speakers in accurately grasping pronunciation and perception of Japanese. Interlanguage theory highlights L1 transfer as a common factor in Chinese students’ acquisition of Japanese pitch accent [1]. The relationships between perception and production has also been a longstanding topic in L2 phonetics research [2]. Recent advancements in phonological theory, acoustic and articulatory phonetics, and multimedia tools have furthered this field [3]. Therefore, this study investigates how Mandarin speakers acquire pitch accents in three-mora Japanese words with devoiced vowels through production and perception tests. It also examines the correlation between these two aspects.
2. Literature Review
2.1. The Characteristics of Japanese Pitch Accent and Vowel Devoicing
In modern standard Japanese, the pitch accent, stemming from ancient Japanese, is defined by the transition from a high to a low tone within a word. Words are classified as accented (kifukukata) or accentless (hebankata), with the particular mora containing the accent nucleus (akusentokaku) that determines the pitch pattern [4]. The pitch accent notations are labeled in three ways: circular, linear, and numeric. In this study, the Numerical Type A system is used, where numbers indicate the mora at which the pitch drops. For example, Pattern 0 (P0) denotes no accent, while P1 places the highest F0 on the first mora. Native speaker tests reveal that P1 starts with a higher frequency, while P0 and other patterns exhibit smoother slopes, as shown in Figure 1 [3].
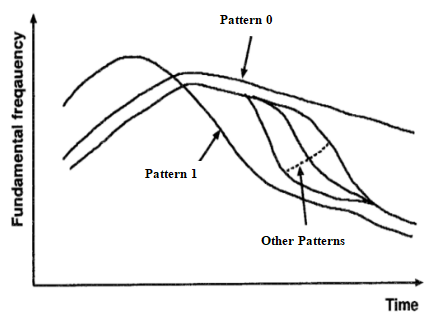
Figure 1: The Fundamental Frequency of Each Accent Type [3]
High vowels [i] and [ɯ] in standard Japanese are often devoiced between voiceless consonants, particularly following /k/ [5]. For example, gakusei (student) is often pronounced [gakɯ̥seː] rather than [gakɯseː]. And vowel devoicing preserves closure segments, remaining unaffected by syllable pulse strength or post-closure properties, which is more prevalent in the Kanto region and among younger speakers [6, 7]. Vowel devoicing disrupts regular pitch accent patterns, often causing the accent nucleus to shift [8]. Martin argued that final high vowels in accented words must devoice if unaccented, but devoicing is absent in accentless words [9]. However, Hasegawa refuted this view, pointing out that it applies only to disyllabic unaccented words, and emphasizing that high pitch cannot align with voiceless segments, requiring adjustments in pitch accent analysis [10]. As such, though there is a certain regularity in Japanese pitch accent and vowel devoicing, the prevalence of devoicing and individual differences still affect the stability of pitch patterns. The integration of pitch accent and vowel devoicing in language transfer among L2 learners, particularly influenced by their native language, is a significant area of research.
2.2. L2 Acquisition of Japanese Pitch Accent and Vowel Devoicing, and the Perception-Production Relationship
Numerous studies have examined the acquisition of Japanese pitch accent and vowel devoicing by learners from various L1 backgrounds. Regarding pitch accent acquisition, Toda found that learners typically acquire the -2 and -3 patterns before the 0 pattern, with a tendency to overuse the -2 pattern [11]. L1 English speakers often made accent errors, while L1 Korean and Chinese speakers faced more mora-related issues. Liu compared the acquisition of compound verbs by Beijing and Shanghai dialect speakers, revealing that Beijing dialect speakers were more prone to misusing the up-down pitch pattern (agesagekata), though both groups exhibited common production errors [12]. Regarding vowel devoicing, Yasuda and Hayashi found that advanced learners in Taiwan exhibited vowel devoicing rates similar to those of native speakers of the Kinki dialect, suggesting that vowel devoicing is an acquirable skill [13]. Hwang observed that vowel devoicing increased with age in children’s L1 acquisition, except at word-final positions [14]. Peterson investigated the influence of L1 on pitch accent acquisition, finding that L1 Chinese speakers showed minimal treatment effects, attributed to the tonal nature of Chinese [15].
The relationship between production and perception in L2 learners has also been widely explored. Whalen highlighted three types of associations between perception and production [16]. However, Sharon and Camillia tested French-English bilinguals at varying proficiency levels and found that while pronunciation accuracy improved with increased nativelike proficiency, performance in perception tasks did not follow a clear pattern [17]. Despite advancements in research on pitch accent and vowel devoicing acquisition, the interplay between perception and production in L2 learners continues to be intricate. The relationship between production and perception is influenced by variables including age, L1 background, and learning experience. Consequently, further research is needed to explore specific phonetic phenomena and their dynamic interplay in L2 acquisition.
Previous studies showed that pitch accent and vowel devoicing in Japanese follow regular patterns, but vowel devoicing leads to individual differences. However, research on pitch accent and vowel variation based on acoustic analysis remains limited and there is a lack of consensus on the relationship between articulation and perception. Therefore, the paper explores how Mandarin native speakers acquire pitch accent in four-syllable Japanese words with devoiced vowels through production and perception tests, aiming to reveal cross-linguistic feature differences. Also, it further examines the correlation between these two aspects, focusing on difficulties faced by Mandarin speakers in acquiring these specific features of Japanese phonetics.
3. Experimental Design
3.1. Participants
The study involved 36 Japanese major students from Tianjin Foreign Studies University, including juniors and seniors, with similar academic backgrounds. All participants had achieved at least N2 proficiency in the Japanese Language Proficiency Test, ensuring intermediate to advanced Japanese competence. None of them had overseas study experience in Japan, providing a uniform linguistic environment, and reducing potential biases related to cultural or language immersion. Moreover, all were native speakers of Northern Mandarin, which helped control for dialectal variation in speech patterns. Prior to testing, their familiarity with the Numerical Type A pitch accent notation was assessed. To mitigate any bias, participants were assured that their audio recordings would remain confidential and that their test performance would not impact their academic standing. Randomly assigned identification numbers for the production test further enhanced the methodological rigor. These procedural safeguards ensure the representativeness and validity of the sample in relation to the study's objectives.
3.2. Test Materials
Using a MacBook with an external microphone as the experimental setup, the production test was conducted in a soundproof recording studio at Tianjin Foreign Studies University. The experimental materials for the production test are shown in the following Table 1:
Table 1: The Sequences for the Production Test
Sequence | IPA Symbol | Accent Pattern |
かきく◎ が(kakikuga) | [ka↑ki̥kɯga] | pattern 0 |
かきく① が(kakikuga) | [ka↓ki̥kɯga] | pattern 1 |
かきく② が(kakikuga) | [ka↑ki↓̥kɯga] | pattern 2 |
To eliminate potential semantic influences, this study used meaningless word sequences (e.g., か,き,く+が) to ensure that pitch accent production was influenced solely by the accent patterns and not word familiarity. Each syllable, composed of “k” + a vowel, allowed for clear acoustic analysis. Following Yoshida Natsuya, the second kana (き) was positioned between the vowel “a” and the high vowel “i” to encourage vowel devoicing. The particle が was included for natural sentence-like pronunciation. The sequences used the same kana but differed in pitch accent (P0, P1, and P2), with P3 excluded as devoicing often shifts the accent, making it indistinguishable from P2. Participants were asked to read each sequence three times, with recordings saved on the MacBook. The perception test, conducted in a quiet environment, consisted of two sections: pitch accent identification (PAI) and naturalness judgment (NJ). Participants could not replay or pause the audio and responded based on their initial judgment.
Figure 2: The Composition of the PAI Audio
In the PAI Section, synthesized audio materials of the word かきくが (kakikuga) were created using VoiceVox, representing three pitch accent patterns (P0, P1, and P2). Each pattern was played three times with controlled intervals, as shown in Figure 2, and participants identified the matching pattern from three options.
The NJ section assessed participants’ perception of pitch accent naturalness by varying the pitch frequency differences between high and low tones. Using Melodyne, pitch values were adjusted in 10 Hz increments (Δd=10) to create 22 audio samples. Participants judged each sample as “Does not match,” “Matches but sounds unnatural,” or “Matches and sounds natural.” Both sections used Praat to compile audio tracks and ensure consistent playback, capturing detailed perceptual data.
3.3. Data Analysis Methods
The analysis of the production test audio followed a qualitative approach, excluding samples with incorrect pitch accent patterns (e.g., P1 pronounced as P2). The remaining samples were processed using Praat to measure the maximum and minimum F0 values. The difference between these values was then calculated for each sample, and the average of three measurements was taken as the final value representing the pitch accent type. A statistical comparison was carried out to explore whether L2 learners exhibit interlanguage characteristics distinct from native speakers across various pitch accent types.
The normality of the distribution for each pitch accent pattern was tested using SPSS software, as shown in Figure 2. The results indicated that the data for Pattern 0 and Pattern 2 followed a normal distribution (p = 0.335 > 0.05, p = 0.240 > 0.05), while the data for Pattern 1 did not (p = 0.028 < 0.05). As a result, parametric tests were used for Patterns 0 and 2, and non-parametric tests were applied to Pattern 1. For normally distributed data (Patterns 0 and 2), one-sample t-tests were conducted to compare the production data with native Japanese speech (simulated by VoiceVox). For non-normally distributed data (Pattern 1), the Wilcoxon rank-sum test was used to make comparisons.
Table 2: Tests of Normality of The Production Sample
Kolmogorov-Smirnova | Shapiro-Wilk | |||||
Statistic | df | Sig. | Statistic | df | Sig. | |
pattern 0 | .129 | 22 | .200* | .951 | 22 | .335 |
pattern 1 | .154 | 22 | .188 | .899 | 22 | .028 |
pattern 2 | .129 | 22 | .200* | .944 | 22 | .240 |
*. This is a lower bound of the true significance.
a. Lilliefors Significance Correction
For the perception test, the accuracy of the PAI section was first calculated. In the NJ section, scores of 0, 1, and 2 were assigned to the three response options. The average score for each audio sample across all participants was computed, and the audio with the highest average score was identified. This score was then used to determine the most salient pitch frequency difference, which was considered the most perceptible feature of pitch accent for Chinese learners of Japanese. To analyze the relationship between perception and production, one-sample t-tests and the Wilcoxon rank-sum test were conducted, comparing the perceived pitch frequency differences with the actual pitch frequency differences measured in the production phase.
4. Results
4.1. Analysis of Mispronunciation Pattern
A categorical statistical analysis was conducted on the mispronounced samples that were excluded from the quantitative analysis, as seen in Table 3. For each pitch accent type, there were 7 instances of mispronunciation, yielding an overall accuracy rate of 80.6%. This result suggests that Chinese students exhibit a consistent tendency for misreading across all pitch accent types.
Table 3: Mispronunciation Pattern Statistics Table
Pattern | Mis-pronounciate Pattern | Sample |
P0 | P3 | S3 S6 S15 S26 S31 S35 |
P1 | S16 | |
P1 | P2 | S19 S10 |
P3 | S3 S13 S16 S25 | |
Other | S27 | |
P2 | P0 | S5 S25 |
P1 | S16 S27 | |
P3 | S13 S15 S23 |
The mispronunciation of P0 was mainly observed as a shift to P3, where the pitch drop occurred at the particle “が” at the end of the word sequence. In a one-on-one interview after the experiment, sample S3 explained that P0 only applies to the word itself, not the following particle, and thus chose to apply a falling tone to the particle. In the case of the mispronunciation of P1 by participant S16, the post-test interview revealed that the participant was unfamiliar with the pitch accent system and read the sequence randomly. It can thus be concluded that this misapplication pattern arises from an inaccurate understanding of the pitch accent notation rules.
For the mispronunciation of P1, both P2 and P3 showed a tendency to interpret the high-rise type as a rising-falling type. Additionally, sample S27 produced two instances of an upward pitch pattern. In the post-test interview, S27 attributed this to a lack of understanding of pitch accent notation, which led to random pronunciation. The reasons for the misinterpretation of the high-rise type as rising-falling remain unclear and warrant further investigation. The cause of this phenomenon can be attributed to the effect of over-generalization. Due to an insufficient understanding of the target language input, learners may form incorrect hypotheses based on limited perception, simplifying Japanese pitch accent rules to “the high pitch should occur at the center of the word.” And this assumption explains why P0 is often misread as P2 or P3. Such a hypothesis reflects the systematic errors in learners’ interlanguage and highlights the importance of explicit instruction and clear input in the acquisition of pitch accent. For the mispronunciations of P2, the error patterns were random. Notably, the post-test interview revealed that participants found the consonant “k” challenging to pronounce, which may have contributed to the errors.
Based on the above analysis, it is evident that Chinese learners of Japanese tend to mispronounce pitch accent patterns in predictable ways: P0 to P3, where learners often misinterpret the pitch drop at the particle “が” as part of the preceding word, leading to a P0 to P3 shift; P1 to P2, P1 to P3, where L2 learners tend to confuse the high-rise type (P1) with the rising-falling type (P2 or P3), likely due to over-generalization of pitch patterns; and P2 to P0, P1 to P2, P3 to P2, where mispronunciations of P2 were more random, possibly reflecting perceptual issues and articulatory challenges, particularly with difficult consonants.
4.2. Quantitative Analysis of the Production Test
As shown in Table 4, for P0, native Japanese speakers, using Voicevox-generated values as a reference, exhibited a 27.3 Hz increase in F0 from a low to a high pitch. An independent sample t-test was conducted with 27.3 Hz as the test value. The results showed that the one-sided p = 0.213 > 0.05, and the two-sided p = 0.425 > 0.05, indicating no significant difference in pitch values between Chinese learners of Japanese and native speakers for P0. And this can be attributed to L1 transfer from Mandarin, where the “First level tone” resembles the flat pitch pattern of Japanese P0, allowing L2 learners to more accurately acquire this pitch.
For P2, the acoustic feature reflecting pitch accent is the Hertz change when the pitch drops from relatively high to relatively low. Using Voicevox-generated values as a reference, native Japanese speakers exhibited a decrease in F0 by 55.4 Hz. An independent sample t-test was conducted with 55.4 Hz as the test value. The results showed that the one-sided p<0.001, and the two-sided p < 0.001, indicating a significant difference in pitch values between Chinese learners of Japanese and native speakers for P2.
Table 4: Result of T-Test for the Production Test of P0 and P2
Pattern | Test Value | t | df | One-sided p | Two-sided p |
P0 | 27.3 | 0.813 | 21 | 0.213 | 0.425 |
P2 | 28.7 | 5.146 | 21 | <0.001 | <0.001 |
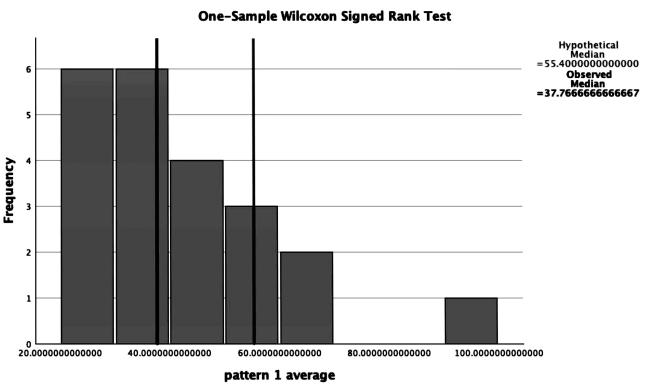
Figure 3: Wilcoxon rank-sum test result of P1
As shown in Figure 3, for P1, the acoustic feature reflecting pitch accent is the Hertz value of the pitch drop between the first and second morae. Since the data did not follow a normal distribution, the Wilcoxon rank-sum test was used for the difference analysis. The two-sided p = 0.003, which is less than 0.05, indicating a significant difference between Chinese learners of Japanese and native speakers. Mandarin’s “fourth tone,” which shares a similar high-to-low pitch pattern with Japanese P0, led to the expectation that participants would perform comparably to native Japanese speakers in P0. However, the test results did not show significant evidence of L1 transfer in this regard. This can be explained by the fact that Japanese pitch accent operates as a suprasegmental phonological feature, while Mandarin tones are confined to individual syllables. As a result, L1 transfer does not always apply. It can be concluded that, based on the quantitative analysis, in three-mora sequences containing devoiced vowels, Chinese learners of Japanese indicate no huge difference from native speakers in P0 (unaccented words), but significant differences are observed in P1 and P2. The mean value for P2 is 46.333, significantly higher than the native speakers’ 28.7, while the median value for P1 is 36.767, lower than the native speakers’ 55.4. Additionally, vowel devoicing was observed 7 times in P0, 6 times in P1, and 5 times in P2. This indicates that Chinese learners of Japanese are not accustomed to producing vowel devoicing. Nevertheless, it is possible that, under the testing conditions, participants intentionally avoided vowel devoicing to produce clearer readings. Thus, further investigation in more natural speech contexts is needed to understand the acquisition of devoicing by Chinese learners of Japanese.
4.3. Quantitative Analysis of the Perception Tests
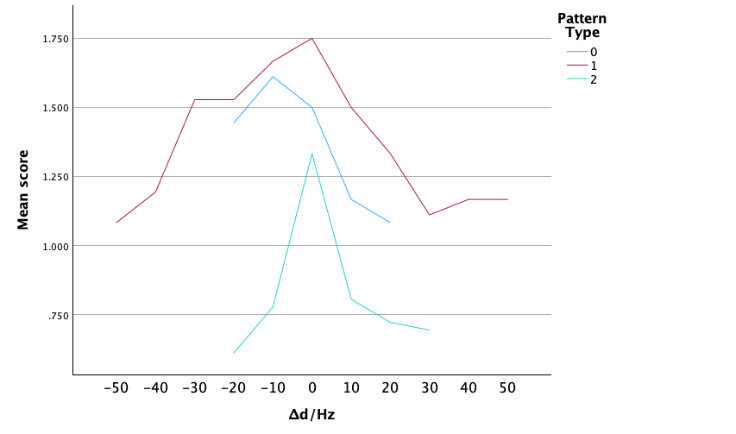
Figure 4: The Relationship Between the Perceptual Scores and Pitch Frequency
In the PAI section, the accuracy for P0 was 100%, while the accuracy for P1 and P2 was 94.4% and 91.7% respectively. This indicates that, overall, learners’ perceptual accuracy is higher than their production accuracy. Furthermore, there was little difficulty in distinguishing unaccented words. In the NJ section, the perceptual scores for all students were calculated by averaging their scores across different pitch frequency difference variations. A line graph plotting the change in perceptual scores with pitch frequency difference variation helped identify the most sensitive pitch frequency difference perception range, as seen in Figure 4. Overall, Chinese learners of Japanese demonstrated the highest sensitivity in perceiving P1 pitch accent patterns, with the lowest sensitivity observed for P2. The most sensitive pitch frequency difference for P0 was 17.3 Hz (Δd = -10), while for P1 and P2, the most sensitive pitch frequency difference was Δd = 0, with values of 55.4 Hz and 28.7 Hz, respectively. It is found that in three-mora sequences, Chinese learners were able to identify the most natural pitch frequency difference between high and low tones, similar to native speakers. However, for unaccented words (P0), they tended to perceive the pitch frequency difference as smaller.
This phenomenon can be attributed to the fact that P1 has a more distinct pitch pattern compared to P0 and P2. Specifically, P1 is the only pattern where the pitch drops from a relatively high to a low level at the beginning of the word sequence, making it easier to perceive and recognize. It is worth noting that five participants reported that all the P2 audio files were incorrect in the test. This issue arose because the VoiceVox-generated P2 audio followed patterns from prior research, where pitch accent on devoiced vowels is shifted. Consequently, the participants mistakenly identified the pattern as P3 rather than P2. After the situation was explained, the test was repeated a week later. This suggests that Chinese learners of Japanese may not fully grasp the rules governing pitch accent shifts on devoiced vowels, which often relies on a more mechanical interpretation of pitch accent patterns.
4.4. The Correlation Test between Production and Perception
Since the sensitive pitch frequency difference for P1 and P2 measured in the perception test exactly match the unedited audio (test values), it can be concluded that there is a significant discrepancy between perception and production in these two items. This indicates that there is no correlation between perception and production for Chinese learners of Japanese in P1 and P2.
For P0, the test value was set to 17.3 Hz, based on the most sensitive pitch frequency difference. A one-sample t-test was conducted again, showing that both the one-sided and two-sided p< 0.01, which indicates that there is a huge difference between perception and production for P0. Based on the above results, it can be concluded that, for three-mora sequences containing devoiced vowels, there is no significant correlation between L2 learners’ production and perception of pitch accent.
Several factors may explain this discrepancy. Firstly, perception and production involve different cognitive processes: perception relies on the auditory system’s immediate response to input signals, while production requires more complex phonetic planning, muscular coordination, and auditory feedback. Even if learners can identify pitch accent patterns during perception, they may find it hard to replicate them in production due to inadequate articulatory coordination. Secondly, some learners rely on memorized rules, such as “pitch should drop at a specific syllable,” rather than developing an intuitive sense of pitch accent via auditory perception. While this strategy may aid in perception tasks, it often fails in production tasks, where real-time application of rules is required. Finally, devoiced vowels often lack clear F0 cues, which are essential for both pitch accent perception and production. This absence of clear acoustic markers makes it more difficult for learners to accurately perceive and replicate pitch accent patterns. Overall, the lack of correlation between perception and production indicates a disconnect between how Chinese learners of Japanese perceive and produce pitch accents. This may be due to differences in cognitive processes and language features.
5. Conclusion
This study examines Chinese learners’ perception and production of three-mora Japanese words with devoiced vowels through error analysis and quantitative evaluation. The results show that perception errors are lower than production errors, with tendencies to produce P0 as P3 and P1 as a rising-falling type. Quantitative analysis of correct samples indicates no significant difference in P0 production compared to native speakers, while P1 exhibits lower and P2 higher pitch frequency differences. In perception, learners can distinguish natural pitch differences but perceive smaller frequency differences for P0. No evidence was found linking perception and production of pitch accent in these word sequences. However, there are several limitations. The sample size is relatively small, and all participants are from the same university. Expanding the sample size and including participants from diverse backgrounds will enhance the validity and generalizability. Additionally, the use of three-mora sequences in the experiment may appear overly isolated compared to natural speech, potentially affecting learners' perception and production due to the lack of contextual cues. Differences in task demands between the perception and production tests may also contribute to potential errors. For instance, perception tasks often require fine discrimination, whereas production tasks focus on accurate replication. These factors could introduce variability into the experimental results.
References
[1]. Liu, Z. (2017) A note on learning Japanese accent: by analysis on Mandarin speaker to learn Japanese. Inquires into Japanese language, 3: 31-43.
[2]. Strange, W. (1995) Phonetics of Second-Language Acquisition: Past, Present, Future. In 13th International Congress of Phonetic Sciences. Stockholm, Sweden. Vol 4: 76-83
[3]. Kumagai, Y., Yoshida, K. and Miwa, J. (1999) On a Decision Method of Accent Type for Japanese Learning. IPSJ SIG technical reports, 16(1998-MUS-029): 71-78.
[4]. Satou, H. (1993) Accent analysis of common Japanese words. Acoustical Science and Technology, 49(11): 775-784.
[5]. Hirayama, M. (2024) Morphological (Non-)Effect in High Vowel Devoicing in Japanese. Journal of the Phonetic Society of Japan, 28(2): 17-26.
[6]. Matsui, M. (2023) The Temporal Feature of the Base Status of Japanese Devoiced Vowels. Theoretical and Applied Linguistics at Kobe Shoin, 26: 15-31.
[7]. Byun, H. (2007) Regional and Generational Differences of High Vowel Devoicing in Japanese. Studies in the Japanese language, 3(1): 33-48.
[8]. Yoshida, N. (2004) A Phonetic Study of Japanese Vowel Devoicing [D]. Kyoto University. http://hdl.handle.net/2433/147406.
[9]. Samuel, E.M. (1953) Morphophonemics of Standard Colloquial Japanese. The Far Eastern Quarterly, 13(1): 101-104.
[10]. Hasegawa, Y. (1999) Pitch Accent and Vowel Devoicing in Japanese. In 14th International Congress of Phonetic Sciences (ICPhS-14). San Francisco, CA, USA. pp. 523-526.
[11]. Toda, T. (1999) Usage and Acquisition of Accent of English Loanwords by Japanese Learners : an Analysis based on Conversational Data from English,Chinese and Korean Speakers. Studies in language and literature. Language, 36: 89-111.
[12]. Liu, J. (2010) A Study on the Acquisition of Japanese Accent by Chinese Speaking Learners: Focus on compound verb. Waseda studies in Japanese language education, 8: 15-28.
[13]. Yasuda, L.and Hayashi, R. (2011) Acquisition of vowel devoicing in Japanese as a second language by Taiwanese learners of Japanese. Journal of the Phonetic Society of Japan, 15(2): 1-10.
[14]. Hwang, H.K. and Hirayama, M. (2024) Acquisition of high vowel devoicing in Japanese: A production experiment with three and four year olds. In Interspeech 2024. Kos Island, Greece. pp. 4180-4183.
[15]. Jeff, P. (2018) A Japanese pitch accent practice program and L1 influence on pitch accent acquisition. In The 92nd Annual Meeting of the Linguistic Society of America. Salt Lake City, USA. pp. 1-12
[16]. Whalen, D.H. (1999) Three Lines of Evidence for Direct Links Between Production and Perception. In 14th International Congress of Phonetic Sciences (ICPhS-14). San Francisco, CA, USA. pp. 1257-1260.
[17]. Sharon, P. and Camillia, B. (2011) The Relation Between Perception and Production in L2 Phonological Processing. In Interspeech 2011, 12th Annual Conference of the International Speech Communication Association. Florence, Italy. pp. 161-164.
Cite this article
Li,S. (2025). The Production and Perception of Japanese Accent by Native Mandarin Speakers: A Study of Three-Mora Word Sequences Containing Devoiced Vowels. Communications in Humanities Research,60,27-35.
Data availability
The datasets used and/or analyzed during the current study will be available from the authors upon reasonable request.
Disclaimer/Publisher's Note
The statements, opinions and data contained in all publications are solely those of the individual author(s) and contributor(s) and not of EWA Publishing and/or the editor(s). EWA Publishing and/or the editor(s) disclaim responsibility for any injury to people or property resulting from any ideas, methods, instructions or products referred to in the content.
About volume
Volume title: Proceedings of the 4th International Conference on Literature, Language, and Culture Development
© 2024 by the author(s). Licensee EWA Publishing, Oxford, UK. This article is an open access article distributed under the terms and
conditions of the Creative Commons Attribution (CC BY) license. Authors who
publish this series agree to the following terms:
1. Authors retain copyright and grant the series right of first publication with the work simultaneously licensed under a Creative Commons
Attribution License that allows others to share the work with an acknowledgment of the work's authorship and initial publication in this
series.
2. Authors are able to enter into separate, additional contractual arrangements for the non-exclusive distribution of the series's published
version of the work (e.g., post it to an institutional repository or publish it in a book), with an acknowledgment of its initial
publication in this series.
3. Authors are permitted and encouraged to post their work online (e.g., in institutional repositories or on their website) prior to and
during the submission process, as it can lead to productive exchanges, as well as earlier and greater citation of published work (See
Open access policy for details).
References
[1]. Liu, Z. (2017) A note on learning Japanese accent: by analysis on Mandarin speaker to learn Japanese. Inquires into Japanese language, 3: 31-43.
[2]. Strange, W. (1995) Phonetics of Second-Language Acquisition: Past, Present, Future. In 13th International Congress of Phonetic Sciences. Stockholm, Sweden. Vol 4: 76-83
[3]. Kumagai, Y., Yoshida, K. and Miwa, J. (1999) On a Decision Method of Accent Type for Japanese Learning. IPSJ SIG technical reports, 16(1998-MUS-029): 71-78.
[4]. Satou, H. (1993) Accent analysis of common Japanese words. Acoustical Science and Technology, 49(11): 775-784.
[5]. Hirayama, M. (2024) Morphological (Non-)Effect in High Vowel Devoicing in Japanese. Journal of the Phonetic Society of Japan, 28(2): 17-26.
[6]. Matsui, M. (2023) The Temporal Feature of the Base Status of Japanese Devoiced Vowels. Theoretical and Applied Linguistics at Kobe Shoin, 26: 15-31.
[7]. Byun, H. (2007) Regional and Generational Differences of High Vowel Devoicing in Japanese. Studies in the Japanese language, 3(1): 33-48.
[8]. Yoshida, N. (2004) A Phonetic Study of Japanese Vowel Devoicing [D]. Kyoto University. http://hdl.handle.net/2433/147406.
[9]. Samuel, E.M. (1953) Morphophonemics of Standard Colloquial Japanese. The Far Eastern Quarterly, 13(1): 101-104.
[10]. Hasegawa, Y. (1999) Pitch Accent and Vowel Devoicing in Japanese. In 14th International Congress of Phonetic Sciences (ICPhS-14). San Francisco, CA, USA. pp. 523-526.
[11]. Toda, T. (1999) Usage and Acquisition of Accent of English Loanwords by Japanese Learners : an Analysis based on Conversational Data from English,Chinese and Korean Speakers. Studies in language and literature. Language, 36: 89-111.
[12]. Liu, J. (2010) A Study on the Acquisition of Japanese Accent by Chinese Speaking Learners: Focus on compound verb. Waseda studies in Japanese language education, 8: 15-28.
[13]. Yasuda, L.and Hayashi, R. (2011) Acquisition of vowel devoicing in Japanese as a second language by Taiwanese learners of Japanese. Journal of the Phonetic Society of Japan, 15(2): 1-10.
[14]. Hwang, H.K. and Hirayama, M. (2024) Acquisition of high vowel devoicing in Japanese: A production experiment with three and four year olds. In Interspeech 2024. Kos Island, Greece. pp. 4180-4183.
[15]. Jeff, P. (2018) A Japanese pitch accent practice program and L1 influence on pitch accent acquisition. In The 92nd Annual Meeting of the Linguistic Society of America. Salt Lake City, USA. pp. 1-12
[16]. Whalen, D.H. (1999) Three Lines of Evidence for Direct Links Between Production and Perception. In 14th International Congress of Phonetic Sciences (ICPhS-14). San Francisco, CA, USA. pp. 1257-1260.
[17]. Sharon, P. and Camillia, B. (2011) The Relation Between Perception and Production in L2 Phonological Processing. In Interspeech 2011, 12th Annual Conference of the International Speech Communication Association. Florence, Italy. pp. 161-164.