


1. Introduction
In this post-COVID-19 pandemic era, economic crisis, work crisis, family crisis, and peer pressure all have seriously threatened and affected people’s mental health and put people at increased risk of developing mental disorders such as depression. Also known as depressive disorder, depression is a common mental disorder that involves symptoms such as a sad mood, loss of pleasure or interest in activities, being listless, having sleep problems, and attention difficulties for extended periods [1]. According to the statistics from the World Health Organization [2], a total of 3.8% of the world’s population suffers from depression, and there is a 25% increase in the rate of the global prevalence of anxiety and depression in the first year of the Covid-19 pandemic [3].
Data from the 2022-2023 Blue Book on National Depression [4] indicates that there are 95 million patients with depression in China, and the incidence group is getting younger: 30.28% of the total population of depression patients are under the age of 18, and 50% of them are school students. Previous studies on factors contributing to youth depression in China indicate that family relationships and parental abuse are the major causes. Data report shows that 69.57% of the student patients are prone to depression in family relationships, and 63% of the student patients reported repeated experiences of harshness/control, neglect/lack of care, and conflict/domestic violence in their families [4]. Data from the All-China Women’s Federation points out that more than 43% of Chinese children aged 10-17 have suffered corporal punishment or verbal or psychological abuse from either or both parents [5].
Scientific research has supported the notion that parental abuse negatively impacts children’s mental health. Firstly, the results of Yap and Jorm’s [6] study suggest that parental factors are associated with childhood depression, with interpersonal conflict and aversions, less warmth, more abusive parenting, and over-involvement, increasing children’s risk for depression and internalizing problems. Secondly, the study focuses on the East Asia and Pacific region by Fry et al. [7] explores that children who have been exposed to maltreatment are at increased risk of experiencing mental and physical health consequences and suicidal ideation and attempts. Thirdly, Teicher et al.’s [8] study illustrates why parental verbal aggression is a latent form of child maltreatment, with results showing that there is a moderately strong effect on depression when exposing to verbal abuse. Those who have been exposed to combined types of emotional abuse, such as verbal aggression and witnessing domestic violence, scored 2.8 times higher on depression than those who never experienced it [8]. Also, Teicher et al.’s [8] study suggests that exposure to multiple types of abuse or maltreatment is more likely to develop depression, and the types of maltreatment are defining factors that lead to different outcomes.
As the number of Chinese adolescents with depression grows, and as parental abuse has become an increasingly influential factor leading to youth depression, psychologists must find more scientific evidence to explain why children do not benefit from those types of abuse and why a healthy family relationship and environment is vital for children’s development. Even though there have been many research studies on different parenting styles and child maltreatment, relatively, there has been little discussion focusing on how specific types of parental maltreatment, including parental absence, directly suffered or witnessed domestic violence, and parental verbal aggression, increase the risk of youth depression in the Chinese context. Thus, this study aims to study the seriousness of parental maltreatment, with a focus on parental absence, domestic violence, and parental verbal aggression, on Chinese children and adolescents’ mental health. It is hypothesized that the more frequently the participants are exposed to parental maltreatment, the more severe their depressive symptoms are. Data analysis methods include principal component analysis (PCA), descriptive statistical analysis, Pearson correlational analysis, and multiple regression analysis. The results of this study will fill in the existing research gaps in the field and provide scientific evidence of how parental abuse could negatively influence children’s mental health conditions. Helpful guidance for future family education models and parenting styles will be indicated.
2. Method
2.1. Design
The CES-D-10 scale was used to examine the severity of participants' depressive symptoms. A quantitative survey was used to investigate the fundamental demographic indicators and parental maltreatment experiences. In this study, the dependent variable is depressive symptoms severity, and the three independent variables are parental absence, domestic violence (directly suffered or witnessed), and parental verbal aggression. If both parents worked out of town and communicated with their children less than once a day, then it is defined as parental absence. Participants, who have directly suffered from physical pain from any form of maltreatment, or, witnessed parental fights and arguments that lead to emotional suffering, are classified as experiencing domestic violence. Parental verbal aggression includes any form of aggressive insult, scolding, yelling, threat, and harsh or mean wordings that parents say to their children.
2.2. Participants
The participants in this study were chosen using single-stage cluster sampling. In the eight provinces of Hubei, Guangdong, Shanxi, Anhui, Hebei, Jiangxi, Sichuan, and Gansu, 11 schools agreed to participate in this survey, and a total of 4525 students participated in the survey on a class basis. There were 4225 valid questionnaires, of which males accounted for 47.6%, and females accounted for 52.4%. Participants are fifth to ninth graders aged between 10 and 18, with 93.3% of whom are between the age range of 12 to 15. The majority of 94.8% are from the Han ethnic group, and the rest are from the Tibetan, Dai, Tujia, Miao, Hui, Manchu, and Yi ethnic groups.
2.3. Survey
The contents of the survey include:
Firstly, there are questions investigating the general demographic indicators, such as age, gender, nationality, and place of residence.
Secondly, 11 items ask about the participants’ parents’ involvement level. Questions include the age at which their parents started working outside the home city, the length and number of years they worked in other places, the frequency of video chatting or voice calls with their parents, and self-rating the closeness of the parent-child relationships. If both parents work in other places and the frequency of communication is less than once a day, the answer is that parents are absent from the child’s growth.
Thirdly, 16 questions investigate whether participants have directly suffered or witnessed domestic violence in the last year. Specifically, regarding the experience of witnessing domestic violence, there are two questions asking participants if they have ever seen and been frightened of adults shouting, yelling, quarreling, or arguing with each other at home and if they have seen adults at home hitting, kicking, slapping, punching or otherwise causing harm to each other physically. Those who answered yes to one or both experiences are classified as having witnessed domestic violence in childhood.
Regarding directly suffered domestic violence, 14 questions are asking if they have experienced any forms of corporal punishments such as making a stand while holding a heavy object, causing burns or scalding, being tied up or chained in a locked room for a long time, being hit or beaten with a belt, stick, or other object, try to suffocate or drown you, twisting your ears, and so on. Questions are asking whether participants have ever experienced starvation and thirst even though everyone else is satiated, whether they could only wear dirty, tattered, and out-of-season clothing even if the family can afford better ones or buy new ones, and whether they had received medical care and medication when they were injured or sick. Those who answered yes to one or more questions are classified as having directly suffered domestic violence in the last year.
Additionally, five items are included to investigate if participants have experienced parental verbal aggression. Questions include whether anyone yelled at you in a very aggressive and loud manner, said mean things to you or cursed you, said they wished you died or were never born, threatened to leave you forever or abandon you, threatened to harm or kill you, including summoning evil spirits against you. Those who answered yes to one or more questions are classified as having suffered from parental verbal aggression.
Finally, the CES-D-10 (Center for Epidemiologic Studies Depression Scale-10) is used to evaluate depressive symptoms severity. The score range of the CES-D-10 is 0 to 30 points, and each item is scored on a four-level scale of 0 to 3 points. The higher the score, the more pronounced the depressive symptoms are. Scores of 0-9 represent low to no depressive symptoms, 10-15 for mild, 16-24 for moderate, and 25 and above represent severe depressive symptoms.
Using a self-report survey that is anonymous, participants could feel safe sharing their true experiences, which would help ensure the reliability and credibility of the results.
2.4. Procedure
The students were surveyed using an anonymous self-completed survey on a class-by-class basis. Questionnaires were mailed to each school, and students self-completed the survey in their classrooms with the teacher in charge of the class. The informed consent is on the first page of the questionnaire to inform the students that this survey is voluntary and anonymous. If the students agree to participate in this study, they must sign their names on the first page. After students had filled out the questionnaire, they put the survey into the file pocket, and the schools were responsible for shipping the questionnaires back to the research team.
2.5. Data analysis
Data from the questionnaires were entered into an Excel table and then cleaned, filtered, and analyzed using SPSS. Excluding questionnaires without signatures on the informed consent, 4267 questionnaire data were entered into an Excel table. Questionnaires with more than 20% missing values in the ten items of CES-D-10 were considered invalid and were deleted. Four thousand two hundred thirty-one data were remaining. Two ways of replacing missing values – series mean and mean of two nearby points – were applied, and CES-D-10 scores were calculated. However, the results of both times showed that six people had scores higher than the total score (30). The data of these six participants was also deleted. So, in the end, there were 4225 valid data for further data analysis.
The missing values of the other items of the 4225 data were replaced with series means since the proportion of missing values for each item is less than 10%. Specifically, 303 replaced missing values for age, 192 for gender, and 3 for ethnic groups. For the 11 items of the independent variable of parental absence, a total of 716 missing values were replaced. There are 209 replaced missing values for the 16 items of the independent variable of domestic violence. There are 113 of replaced missing values for the five items of the independent variable of parental verbal aggression.
The score of CES-D-10 was calculated in SPSS using the formula of “Q1 + Q2 + Q3 + Q4 + (4 - Q5) + Q6 + Q7 + (4 - Q8) + Q9 + Q10.” The mean, standard deviation, score distribution, and four-score range distribution were analyzed using descriptive statistical analysis. Next, a principal component analysis was performed to reduce the data's dimension and extract the principal components for further analysis since there are multiple questions for each independent variable. The Pearson correlation analysis was followed using the principal components of the three independent variables to test their correlational relationships with the CES-D-10 score. Finally, multiple regression analysis was performed to study the relationship between the dependent variable and multiple independent variables. This step aims to assess the effects of independent variables on dependent variables, as well as the magnitude and direction of these effects.
3. Results
3.1. General demographic indicators
Among the 4225 participants were 2013 males, accounting for 47.6%, and 2212 females, accounting for 52.4%. The age range is 10-18-year-olds, of which 17.2% are 12-year-olds, 25.9% are 13-year-olds, 37% are 14-year-olds, and 13.2% are 15-year-olds. (See Figure 1). Regarding regional distribution, 38.9% are from Hebei, 12.7% from Guangdong, 11.6% from Hubei, and 11% from Gansu. (See Figure 2). Besides the majority of 95% Han participants, there are 4.7% Tibetan and 0.2% Hui participants.
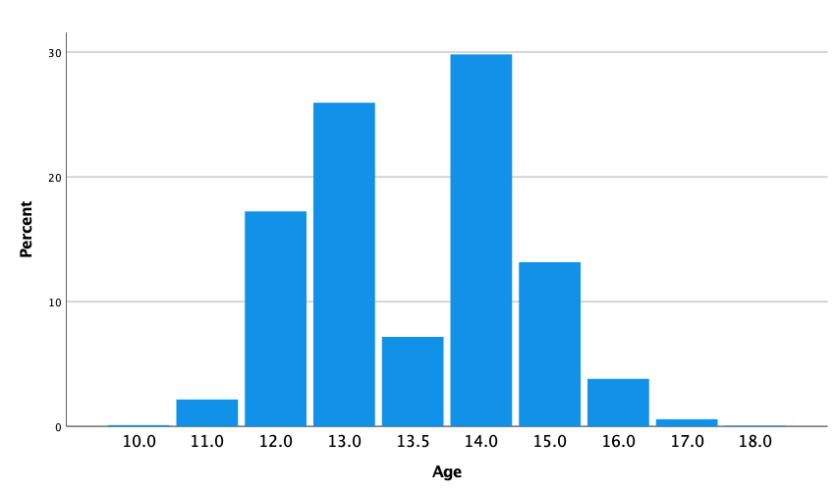
Figure 1: Bar chart of the distribution of age
Note. The y-axis displays the percentage, while the x-axis is the age between 10-18. Since the missing values were replaced with the series mean, there are 7.2% of participants whose age appeared to be 13.5. In the results, this 7.2% was considered as 14-year-olds.
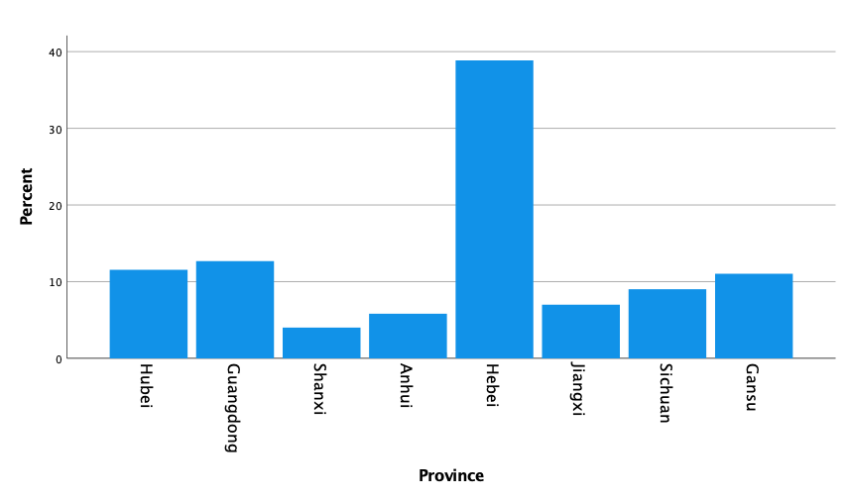
Figure 2: Bar chart of the distribution of provinces
Note. The y-axis shows the percentage, while the x-axis displays eight different provinces of China.
3.2. CES-D-10 scale
The mean of participants’ test scores was 10.00 on the CES-D-10 scale (M = 10.00, SD = 5.70). The median is 9 (Median = 9), the 25th percentile is 6 (P25 = 6), and the 75th percentile is 13 (P75 = 13). Among the participants, 54% scored in the score range of 0-9, 29.6% scored in the score range of 10-15, 13.6% scored in the score range of 16-24, and 2.2% scored in the range of 25-30 (See Figure 3). Specifically, from the highest to the lowest distribution, there are about 8.9% of participants scored 8 points, 7.7% scored a 5, 7.3% scored a 7, 6.7% scored a 6, 6.6% scored a 9, 6.4% scored a 10, 5.9% scored a 4, and 5.4% scored a 11. (See Figure 4).
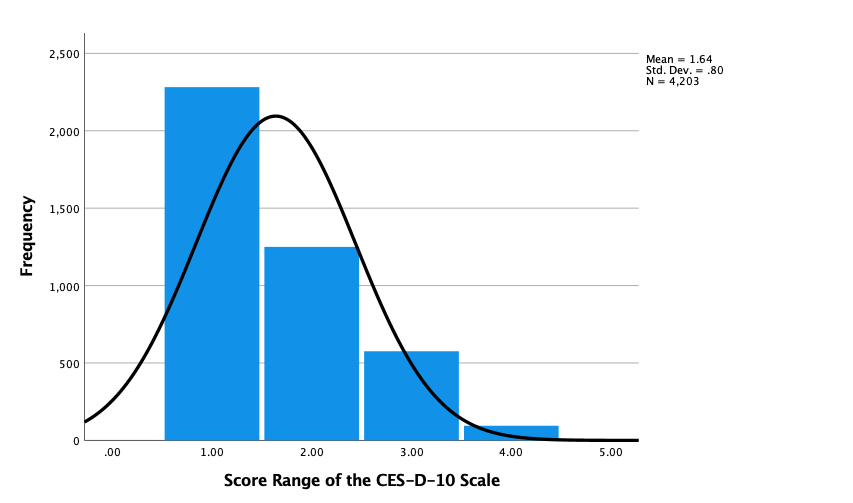
Figure 3: Histogram of the distribution of four score range of the CES-D-10 scale
Note. On the x-axis, the number 1 represents the score range between 0 and 9; the number 2 represents the score range between 10 and 15; the number 3 represents the score range between 16 and 24; and the number 4 represents the score range between 25 and 30. The y-axis shows the frequency number.
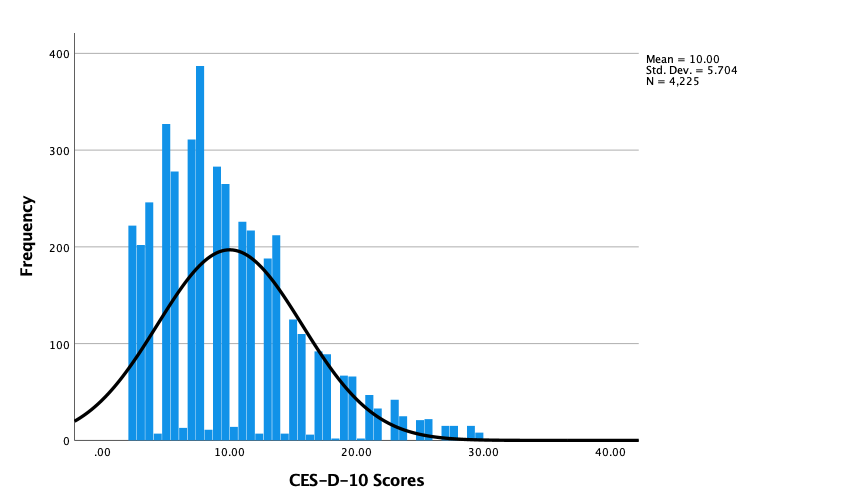
Figure 4: Histogram of the distribution of the CES-D-10 scores
Note. The CES-D-10 score, which ranges from 0 to 30, is shown on the x-axis, and the frequency number is shown on the y-axis.
3.3. Descriptive statistical analysis
3.3.1. Comparison of CES-D-10 score range by age
For the 10-year-olds, the box is larger, and the interquartile range (IQR) is wide. The median is close to the first quartile and has longer whiskers and outliers existed. Specifically, at the age of 10, the box is larger and the interquartile range of the scores is wider, which reflects the greater differences in emotional states among the participants. The long whisker demonstrates that the distribution of scores is more scattered and there may exists some extreme values. The median of this age group shows that the scores in the lower half are more concentrated.
For the 11-17 age groups, the boxplot exhibits more consistent and narrower interquartile ranges. The medians for this age group are in the center of the interquartile ranges, indicating a symmetrical distribution of scores. The whiskers are relatively shorter and there exist fewer outliers. For the 19-year-olds group, the interquartile range is wide, the distribution of data is relatively scattered, and there are many extreme values or outliers. Most of the scores are concentrated in the lower range, while a few score significantly higher than others. (See Figure 5).
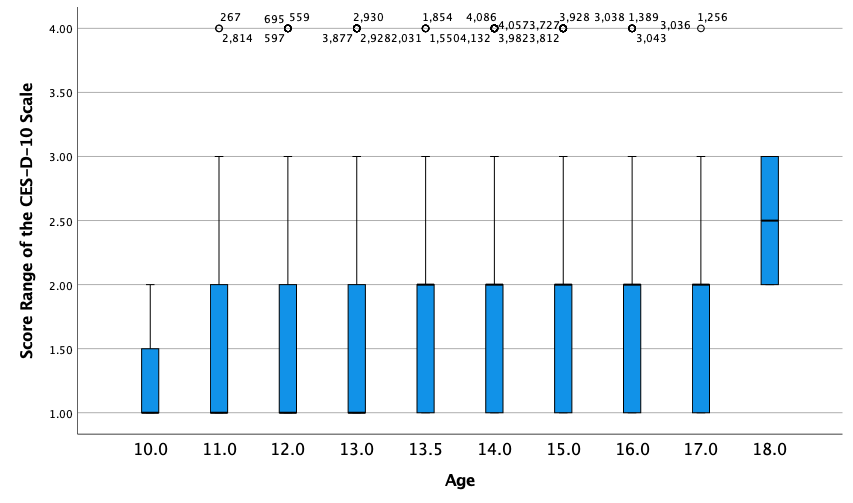
Figure 5: Boxplot of the comparison of the CES-D-10 score range by age
Note. On the y-axis, the number 1 represents the score range between 0-9; the number of 2 represents the score range between 10-15; the number of 3 represents the score range between 16-24; and the number of 4 represents the score range between 25-30. On the x-axis, the number represents different ages. Since the missing values of age were replaced with series mean, the data of 13.5 was included into the data of 14-year-olds in the results.
3.3.2. Comparison of the CES-D-10 score range by gender
For males, the upper and lower bounds of all boxplots are in the lower score range, with one data set showing a wider range of scores.
The boxplot shows that the median is in the lower-scoring region for females. However, the boxplot at the far right shows a relatively higher upper score limit for females compared to males, indicating that some females exhibit more severe symptoms of depression.
Multiple outliers are in the plot, which may represent individual subjects with depressive symptom severity significantly higher than the average for their respective gender groups. In particular, there was one outlier among males and two outliers among females. (See Figure 6).
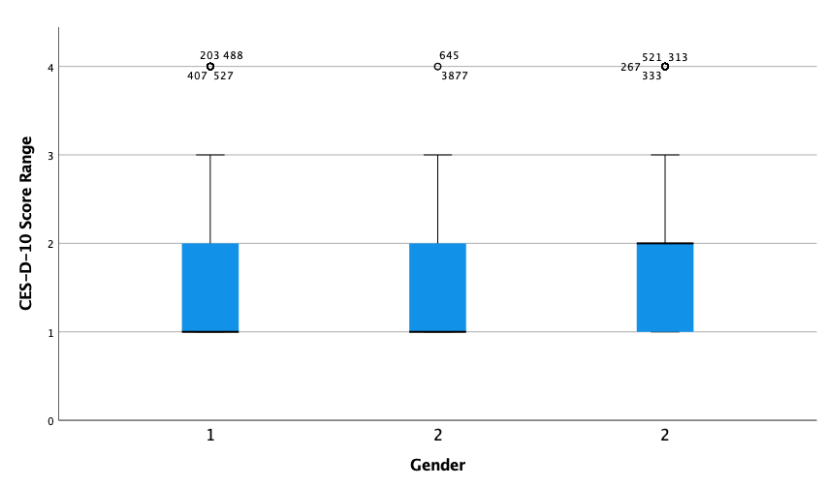
Figure 6: Boxplot of the comparison of the CES-D-10 score range by gender
Note. On the y-axis, the number 1 represents the score range between 0-9; the number of 2 represents the score range between 10-15; the number of 3 represents the score range between 16-24; and the number of 4 represents the score range between 25-30. On the x-axis, the number represents different gender. The number 1 represents males, and the number 2 represents females.
3.4. Principal component analysis (PCA)
Five principal components were extracted from the 11 items for the independent variable of parental absence, and they cumulatively explain 74.98% of the total variance (See Table 1&2). Four components were extracted from the 16 items for the independent variable of domestic violence, explaining approximately 43.95% of the variance (See Tables 3&4). Only one component (5 items) was extracted for the independent variable of parental verbal aggression, explaining 38.89% of the variance (See Table 5).
Table 1: Component loadings of the 11 items of parental absence
Items | Component 1 Loadings | Component 2 Loadings | Component 3 Loadings | Component 4 Loadings | Component 5 Loadings |
PA1 | .810 | -.153 | .192 | ||
PA2 | .305 | .879 | |||
PA3 | .323 | .869 | |||
PA4 | .730 | .348 | |||
PA5 | .122 | .817 | .109 | .118 | |
PA6 | .673 | .434 | |||
PA7 | .145 | .816 | .177 | .101 | |
PA8 | .305 | .842 | |||
PA9 | -.140 | .294 | .835 | ||
PA10 | .843 | ||||
PA11 | .830 |
Table 2: Variance explained and naming of the principal components of parental absence
Principal Components | Variance Explained (%) | Cumulative Variance Explained (%) | Naming |
Component 1 | 17.197 | 17.197 | The time and years of father worked outside home |
Component 2 | 16.935 | 31.131 | The time and years of mother worked outside home |
Component 3 | 14.795 | 48.926 | The start time when parents started out-migration for work |
Component 4 | 13.187 | 62.113 | Frequency of Communication |
Component 5 | 12.863 | 74.976 | Closeness of Parent-Child Relationship |
Table 3: Component loadings of the 16 items of domestic violence
Items | Component 1 Loadings | Component 2 Loadings | Component 3 Loadings | Component 4 Loadings |
DV1 | .619 | |||
DV2 | .174 | .176 | .674 | |
DV3 | .104 | .678 | ||
DV4 | .192 | .260 | .267 | .156 |
DV5 | .205 | .623 | ||
DV6 | .155 | .645 | ||
DV7 | .633 | |||
DV8 | .707 | .141 | ||
DV9 | .783 | .118 | ||
DV10 | .686 | .103 | ||
DV11 | .173 | .598 | ||
DV12 | .553 | .255 | ||
DV13 | .104 | .733 | .100 | |
DV14 | .703 | .118 | ||
DV15 | .366 | .175 | ||
DV16 | .643 |
Table 4: Variance explained and naming of the principal components of domestic violence
Principal Components | Variance Explained (%) | Cumulative Variance Explained (%) | Naming |
Component 1 | 14.909 | 14.909 | Physical Violence |
Component 2 | 11.168 | 26.077 | Extreme Physical Abuse |
Component 3 | 9.094 | 35.171 | Neglect |
Component 4 | 8.779 | 43.950 | Witnessing |
Table 5: Component loadings of the 5 items of parental verbal aggression
Items | Component 1 Loadings |
VB1 | .646 |
VB2 | .655 |
VB3 | .695 |
VB4 | .610 |
VB5 | .492 |
3.5. Pearson correlational analysis
3.5.1. Parental absence
The correlation coefficient between component 1 and the CES-D-10 score is -0.017, indicating little linear relationship between those two variables. The significance level (p = 0.260) is greater than 0.05, indicating that the correlation is insignificant.
The correlation coefficient between component 2 and the CES-D-10 score is -0.029, indicating a weak and negative linear relationship between these two variables. The significance level (p = 0.059) is close to 0.05 but does not reach statistical significance.
The correlation coefficient between component 3 and the CES-D-10 score is -0.059, indicating a weak negative correlation. The significance level (p = 0.000) is less than 0.01, indicating that the correlation is significant.
The correlation coefficient between component 4 and the CES-D-10 score is -0.049, indicating a weak negative correlation. The significance level (p = 0.002) is less than 0.01, indicating that the correlation is significant.
The correlation coefficient between component 5 and the CES-D-10 score is 0.320, indicating a moderately strong positive correlation. The significance level (p = 0.000) is less than 0.01, confirming the correlation's statistical significance.
3.5.2. Domestic violence
The correlation coefficient between component 1 and the CES-D-10 score is -0.219, indicating a weak negative correlation between these two variables. The significance level (p = 0.000) is less than 0.01, indicating that the correlation is statistically significant. The higher the component 1 score, the lower the CES-D-10 score.
The correlation coefficient between component 2 and CES-D-10 score is 0.043, indicating a very weak positive correlation. The significance level (p = 0.005) is less than 0.01, indicating that the correlation is significant.
The correlation coefficient between component 3 and the CES-D-10 score is -0.158, indicating a weak negative correlation. The significance level (p = 0.000) is less than 0.01, indicating that the correlation is significant. The higher the component 3 score, the lower the CES-D-10 score.
The correlation coefficient between component 4 and the CES-D-10 score is -0.115, indicating a weak negative correlation. The significance level (p = 0.000) is less than 0.01, indicating that the correlation is significant. The higher the component 4 score, the lower the CES-D-10 score.
3.5.3. Parental verbal aggression
The correlation coefficient between component 1 and the CES-D-10 score is -0.357, indicating a moderately strong negative correlation between the two variables. The significance level (p = 0.000) is less than 0.01, indicating this negative relationship is statistically significant. The higher the component 1 score, the lower the CES-D-10 score.
3.6. Multiple regression analysis
According to the results of the ANOVA table, the F value of the model is 111.219, which indicates that the overall model is significant, that is, the independent variables included in the model jointly have a significant predictive effect on the CES-D-10 score. The Sig. value is less than 0,001, which means that we can reject the null hypothesis that the regression coefficients of all independent variables are zero and the model is statistically significant.
According to the results of the coefficient table, the regression coefficient of the constant is 10.005, the standard error is 0,078, the t value is 128.032, and the significance level is p<0.001. This constant term represents the expected value of the dependent variable (CES-D-10 score) when all independent variables (principal components) have a value of 0. This means that in the absence of any absentee parents, domestic violence, and verbal aggression, the average CES-D-10 score would be expected to be 10.005. This can be considered a baseline depressive symptom severity (See Table 6).
3.6.1. Parental absence
Among the five components, PA_component3, PA_component4 and PA_component5 are statistically significant, especially the positive coefficient of PA_component5 strongly indicates that some forms of parental absence have a great impact on children's depression. For the other two components, although their coefficients are somewhat predictive, they are not statistically significant.
For PA_component1, the coefficient (B) is -0.017, indicating that when PA_component1 increases by one unit, the CES-D-10 score decreases by 0.017 on average. The p-value is 0.830, indicating that this result is not statistically significant and that this variable may not be an important predictor in this model.
For PA_component2, the coefficient (B) is -0.064, which means that when PA_component2 increases by one unit, the CES-D-10 score decreases by 0.064. The p-value is 0.412, which also indicates that this result is not statistically significant and may not be a key predictor variable.
For PA_component3, the coefficient (B) is -0.252, indicating that as PA_component3 increases, the CES-D-10 score decreases by 0.252 on average. A p-value of 0.001 indicates that this result is statistically significant, and this dimension is an important predictor.
For PA_component4, the coefficient (B) is -0.224, indicating that an increase in PA_component4 is associated with a decrease in CES-D-10 score. The p-value of 0.004 supports the statistical significance of this result, indicating that this is also a critical dimension.
For PA_component5, the coefficient (B) is 1.418, indicating that an increase in PA_component5 is closely related to an increase in CES-D-10 score. The p-value is 0.000, which is highly significant and emphasizes the importance of this dimension in predicting depressive symptoms (See Table 6).
3.6.2. Domestic violence
For DV_component1, the coefficient (B) is -0.434, indicating that when DV_component1 increases by one unit, the CES-D-10 score decreases by 0.434 on average. The significance level is p<0.001, indicating that this result is statistically significant.
For DV_component2, the coefficient (B) is 0.408, indicating that for every unit increase in DV_component2, the CES-D-10 score increases by 0.408 on average. The significance level is p<0.001, proving that the association is statistically significant.
For DV_component3, the coefficient (B) is -0.418, indicating that for every unit increase in DV_component3, the CES-D-10 score decreases by 0.418 on average. The significance level is p<0.001, proving that the association is statistically significant.
For DV_component4, the coefficient (B) is -1.195, which is the largest impact among all components, indicating that for every unit increase in DV_component4, the CES-D-10 score decreases by an average of 1.195. The significance level is p<0.05, supporting that this association is statistically significant.
Both DV_component1 and DV_component3 show negative effects, while DV_component2 and DV_component4 show positive effects. These mixed results suggest that different aspects of domestic violence may have both positive and negative effects on depressive symptoms.
3.6.3. Parental verbal aggression
For VA_component1, the coefficient (B) is -1.425, the standard error is 0.097, the standardized coefficient (β) is -2.50, the t value is -14.728, and the significance level is p<0.001. This means that parental verbal aggression had a significant negative effect on depressive symptom severity (See Table 6).
Table 6: Coefficients table of the multiple regression analysis results of the dependent variable (CES-D-10 score) and the independent variables (principal components)
Unstandardized B | Coefficients Std. Error | Standardized Coefficients Beta | t | Sig. | |
(constant) | 10.005 | .078 | 128.032 | .000 | |
VA_component1 | -1.425 | .097 | -.250 | -14.728 | .000 |
DV_component1 | -.434 | .089 | -.076 | -4.865 | .000 |
DV_component2 | .408 | .079 | .071 | 5.155 | .000 |
DV_component3 | -.418 | .082 | -.073 | -5.107 | .000 |
DV_component4 | -.195 | .082 | -.034 | -2.387 | .017 |
PA_component1 | -.017 | .078 | -.003 | -.214 | .830 |
PA_component2 | -.064 | .078 | -.011 | -.821 | .412 |
PA_component3 | -.252 | .078 | -.044 | -3.224 | .001 |
PA_component4 | -.224 | .078 | -.039 | -2.858 | .004 |
PA_component5 | 1.418 | .080 | .249 | 17.702 | .000 |
4. Discussion
4.1. CES-D-10 score interpretation and distribution
Four different score ranges can first interpret the score of the CES-D-10 scale. From the least serious to the most serious, there is a 0-9 score range, 10-15 score range, 16-24 score range, and 25-30 score range. According to the results of this study, the majority of 54% of participants were in the range of 0-9, which means that individuals exhibit very few or no depressive symptoms. No obvious signs of depression are found. A total of 29.6% of participants were in the range of 10-15, which indicates that the individuals might experience some depressive symptoms, such as low mood and sleep problems. However, they do not significantly affect daily life. The 13.6% of participants in the score range of 16-24 may exhibit more frequent or severe depressive symptoms that may begin to affect their daily functioning and quality of life. This means that participants in this range might experience persistent low mood, significant loss of energy, changes in appetite, and reduced interest or pleasure in daily activities they used to enjoy. Those who scored between 25-30 points (2.2%) indicate that it is likely that they are suffering from severe depressive symptoms that are likely to significantly interfere with their work, school, family life, and social activities. This group of people needs to seek professional mental health care and treatment as soon as possible.
Taken as a whole, the mean of the participants’ test score (M = 10.00) is at the threshold of mild depressive symptoms, meaning that the participants had some degree of depressive symptoms on average. The high standard deviation (SD = 5.70) indicates that the score distribution is more dispersed, and the differences between individual scores are significant, which means that while some participants have low scores, others scored higher. The median (Median = 9) is lower than the mean, indicating that the data distribution may be slightly skewed, with more data leaning toward the low-scoring range and fewer people scoring higher. This means that more than half of the participants scored 9 or below, indicating that most people exhibit lower levels of depressive symptoms. Additionally, 25% (P25 = 6) of the participants scored below or equal to 6, and 75% (P75 = 13) scored 13 or below. The results show that most people scored in the lower range of depressive symptoms, while 25% scored in the range of mild to moderate depressive symptoms.
4.2. Comparisons of the CES-D-10 score range between age and gender
4.2.1. Age
From the perspective of score distribution trends, the score range of the CES-D-10 scale does not seem to have an obvious trend of increasing or decreasing year by year between the age of 10 to 18. The score range of the 10-year-olds is wider, but the scoring range trends gets narrow as the age increases. Until the age of 18, the scoring range expands again.
Specifically, at the age of 10, the box is larger and the interquartile range of the scores is wider, which reflects the greater differences in emotional states among the participants. The long whisker demonstrates that the distribution of scores is more scattered and there may exists some extreme values. The median of this age group shows that the scores in the lower half are more concentrated. For the 11 to 17 age groups, the box heights are relatively small and consistent, the whiskers are shorter, and the median is roughly in the middle of the box. These characteristics indicate that participants in these age groups have smaller differences in the CES-D-10 scores and are relatively consistent in emotional states. The distribution is concentrates and relatively symmetrical with fewer extreme values and no obvious skew distribution. In contrast, there is an increase in both box height and whisker length for the 18-year-olds, and the median is lower. This suggests that differences in emotional states become larger at this age, which could be explained with increased inter-individual differences as adulthood approaches.
Moreover, the different sample sizes for each age could explain the differences in results. In some age groups, such as 13.5 and 14 years old, the sample size is larger, which may have resulted in less fluctuation in the score range. In other age groups, such as 18-year-olds, the sample size is smaller and could result in increased fluctuations. Lastly, the error bars represent the degree of variation (or certainty) in the data. As a result, there is little difference in the length of error bars among different age groups, indicating that the magnitude of score variation among each age group is relatively consistent.
4.2.2. Gender
Male’s CES-D-10 scores have a narrower range and are concentrated in the lower score range. This suggests that most of the males who participated showed low depressive symptoms, a manageable situation. Females have a wider distribution of scores across the two bins, with the first bin having a score range like that of men, while the second bin shows a wider score range and a higher upper bound, suggesting that within this subsample, there are women who show higher levels of depressive symptoms. The median scores for both gender groups were close and at the lower end of the score range, indicating that most participants had mild depressive symptoms, further reinforcing the manageable nature of the situation. The results indicate that most participants in this study showed low depressive symptoms. Although the median scores were similar for both sexes, female scores ranged slightly wider, suggesting that women may exhibit more depressive symptoms in the high-scoring range.
4.3. Principal component analysis (PCA)
Five components were extracted for the first independent variable, parental absence. The first component covers the questions of the time and years the father worked outside the home, while the second component covers the same part of the mother. The third component focuses on when the parents began to out-migration for work. The fourth component covers the frequency of Facetime or video chat, and the fifth component discusses the children’s rating of the closeness of the parent-child relationship.
For the second variable, domestic violence, four components were extracted. The naming of the first component is physical violence, which mainly covers acts of direct physical violence, such as beating, pushing, binding, and injury. The naming of the second component is extreme physical abuse, which includes violence such as suffocating and burning. The naming of the third component is neglect, including no emotional and essential supplies support and refusal to provide medical care. The naming of the fourth component is witnessing, which covers the cases where children are emotionally hurt due to witnessing violence at home. Only one component was extracted for parental verbal aggression, which covers various types of verbal violence and psychologically threatening behaviors. For instance, children were threatened by their parents to abandon them or leave them forever.
4.4. Pearson correlation analysis
4.4.1. Parental absence
The results revealed that the time and years of parents working outside the home are not statistically significantly correlated with the CES-D-10 scores. The younger the children were when their parents started working far from home, the higher the children’s CES-D-10 scores. The statistically significant result of component 4 indicates that the more frequent video chat or phone calls between children and their parents, the lower the children’s depressive symptom scores. Component 5 is moderately strongly correlated with the CES-D-10 score, which means that the more distant the parent-child relationships, the more depressive symptoms the children experience.
4.4.2. Domestic violence
All components in the domestic violence variable have significant correlations with CES-D-10 scores. Components 1, 3, and 4 all show significant negative correlations, while component 2 has a significant but weak positive correlation with CES-D-10 scores.
A negative correlation means that when the scores of principal components are lower, the scores of CES-D-10 are higher. Here, lower principal component scores mean domestic violence occurs more frequently, and higher CES-D-10 scores mean more severe depressive symptoms. Therefore, the negative correlations here indicate that the more the participants experience physical violence, including kicking, pushing, scratching, slapping, and hitting using belts or sticks, the more frequently the participants witness domestic violence at home, and the less parents care about their children in basic needs and emotional supports, the more severe the participants’ depressive symptoms are.
Interestingly, there is a weak positive relationship between component 2 and the CES-D-10 scores. This suggests that the fewer or no instances of severe physical violence, like suffocating and burning, the higher the CED-D-10 scores are. This result suggests that there may be some specific characteristics or differences in the sample that make this dimension have a different relationship with depressive symptoms than expected. For instance, participants may have experienced other forms of stressors or trauma but relatively few experiences of extreme physical violence. So, participants with higher scores may be exposed to other factors that contribute to depressive symptoms. Also, the measurement tool of depressive symptoms (CES-D-10) may have limitations in capturing specific types of psychological reactions. Violent experiences may lead to different forms of psychological stress reactions, which may not be fully reflected in depressive symptoms, leading to unexpected results in correlation analysis.
4.4.3. Parental verbal aggression
There was a significant negative correlation between the principal component of parental verbal aggression and CES-D-10 scores. Here, lower principal component scores also mean more frequency. Therefore, the results reveal that the more frequently the participants experienced parental verbal aggression, such as shouts and threats of abandonment, the more severe depressive symptoms they displayed.
4.5. Multiple regression analysis
The F-value of the model is very high (111.219), and the associated p-value is much less than 0.001, indicating that the overall model is statistically significant. This means that the set of independent variables (principal components) included in the model significantly predicts the severity of depressive symptoms.
4.5.1. Parental absence
For the first two components, there slightly negative coefficient is scientifically insignificant, which means that the impact of the time and years the father and mother worked outside the home are relatively non-significant to depressive symptoms severity. However, the slightly different coefficient value of these two components indicates that in terms of parental absence, mother’s absence has more impact on depressive symptoms than fathers’ absence.
The results of component 3 and 4 show negative coefficients, which are scientifically significant. Component 3 refers to when the parents began to out-migration for work, while component 4 refers to the frequency of Facetime or video chat between parent and children. For component 3, the larger the value, the older the children were when their parents started to work outside the town. Thus, the negative coefficient means that the younger the children were when their parents started to work outside the home, the more severe the depressive symptoms are. Since the larger the value means more frequent contact, the negative coefficient of component 4 indicates that the more frequent the contact, the less severe the depressive symptoms are.
The positive coefficient of PA_component5 indicates that its increase is closely related to the increase of CES-D-10 score. This component refers to the intimate degree of parent-child relationships. The larger the values, the less intimate the relationships are. This suggests that the worst the relationships between the parents and children, the higher the CES-D-10 scores the children get on the CES-D-10 test score, the more severe their depressive symptoms severity are.
4.5.2. Domestic violence
The effects of the principal components of domestic violence on depressive symptoms are complex, and different principal components show different effect directions, which may reflect the diversity and complexity of domestic violence.
The first principal component of domestic violence is defined as physical violence, which covers acts such as beating, pushing, and binding. Since higher values indicate fewer violent incidents, the negative coefficient of the first principal component of domestic violence indicates that as violent incidents decrease, so does the severity of depressive symptoms. Secondly, the positive coefficient of component 2, which refers to extreme physical abuse, indicates that increased incidents of domestic violence in this dimension are associated with higher depressive symptom severity. Like component 1, larger values represent a reduction in violent incidents. The result of component 3 shows a negative correlation between neglect and depressive symptoms severity, in which the less the neglect incident, the less the depressive symptoms. Moreover, witnessing domestic violence is the definition of component 4. The result suggests that reductions in this form of violence have a significant positive impact on reductions in depressive symptoms. These results reveal the complexity and diversity of domestic violence, with different dimensions of domestic violence having varying impacts on individual mental health.
4.5.3. Parental verbal aggression
In the answers choices of the principal component of parental verbal aggression, larger numbers represent fewer occurrences, while smaller numbers represent more occurrences. Thus, the significant negative effect of parental verbal aggression on depressive symptom severity means that as the number of occurrences of verbal aggression decreases, the CES-D-10 score also decreases. This suggests that reductions in verbal aggression are significantly associated with reduced severity of depressive symptoms. These findings are of utmost importance, as they highlight the significant impact of parental verbal aggression on mental health. In other words, the more verbal aggression, the more severe the depressive symptoms, and vice versa, underscoring the need for further research and intervention. Since the p-value for this coefficient is less than 0.001, this means that there is solid statistical evidence in this study to support a significant association between reduced frequency of verbal aggression and reduced severity of depressive symptoms. This result highlights the importance of reducing parental verbal aggression because these negative family interactions significantly increase the risk of depressive symptoms. When designing prevention and intervention measures, reducing verbal aggression in the home may be an effective strategy for reducing depressive symptoms in adolescents and adults.
These results provide insights into how different types of family environmental factors influence adolescent or adult mental health. Research shows that reducing violence and verbal aggression within the family and addressing the negative factors associated with parental absence may be effective ways to reduce the severity of depressive symptoms. In particular, the positive coefficient of PA_component5 emphasizes that the intimate degree of parent-child relationship may have a serious negative impact on children's mental health, which requires further attention and intervention.
5. Limitations
This study has limitations in terms of measurement tools for depressive tendencies. First, the CES-D-10 is a shortened questionnaire of CES-D, and it is not a clinical mental health evaluation. A higher score does not confirm a clinical diagnosis. Second, due to cultural sensitivities, the manifestations of depression may vary across cultures. So, some items of the CES-D-10 may not apply to all cultural or social contexts, which means that this study’s results may not necessarily apply to adolescent populations in all contexts. Third, CES-D-10 reflects the status of the past week, which results could be affected by temporary factors, such as life events or health conditions. Those who scored higher in this study might score lower next time. Finally, there is a possibility that students may be untruthful and self-protective in some of their responses, which could affect the results.
6. Conclusion
This research examines the relationship between parental maltreatment, precisely parental absence, domestic violence, and verbal aggression, and the severity of depressive symptoms among Chinese adolescents. The findings support the hypothesis that increased exposure to these forms of abuse is associated with more severe depressive symptoms. Notably, the findings underscore the negative impact of parental maltreatment on children’s mental health conditions, that frequent communication between parents and children is linked to lower CES-D-10 scores, while distant parent-child relationships and frequent exposure to violence and neglect are correlated with higher CES-D-10 scores.
Although more than half of the participants display little to no depressive symptoms, there is a proportion of participants who have mild to moderate depressive symptoms. Further emotional support and mental health evaluation are needed for those who score above the average. Despite the contributions this study made to contributing factors of Chinese youth depression, it is also noticeable that the results may not be generalized for populations in all cultural contexts. Future research should study the individual differences in depressive symptoms and employ different measurement tools that could include more kinds of depressive symptoms and are not affected by transient factors.
References
[1]. American Psychiatric Association. (2024, April). What is depression. https://www.psychiatry.org/Patients-Families/Depression/What-Is-Depression
[2]. World Health Organization. (2023, March 31). Depressive disorder (depression). https://www.who.int/news-room/fact-sheets/detail/depression
[3]. World Health Organization. (2022, March 2). Covid-19 pandemic triggers 25% increase in prevalence of anxiety and depression worldwide. https://www.who.int/news/item/02-03-2022-covid-19-pandemic-triggers-25-increase-in-prevalence-of-anxiety-and-depression-worldwide
[4]. Shanghai Center of Biomedicine Development. (2023, October 4). Blue book on national depression (2022-2023): 50% of depression patients are students. ByDrug. https://bydrug.pharmcube.com/news/detail/233e0f10bc4c9337ac9ee758ebdc9a61
[5]. Chen, T., & Lv, P. (2017, March 1). Safeguarding children against domestic violence in China. The Asia Foundation. https://asiafoundation.org/2017/03/01/safeguarding-children-domestic-violence-china/
[6]. Yap, M. B. H., & Jorm, A. F. (2015). Parental factors associated with childhood anxiety, depression, and internalizing problems: A systematic review and meta-analysis. Journal of Affective Disorders, 175, 424-440. https://doi.org/10.1016/j.jad.2015.01.050
[7]. Fry, D., McCoy, A., & Swales, D. (2012). The consequences of maltreatment on children’s lives: A systematic review of data from the East Asia and Pacific region. Trauma, Violence, & Abuse, 13(4), 209-233. https://doi.org/10.1177/1524838012455873
[8]. Teicher, M. H., Samson, J. A., Polcari, A., & McGreenery, C. E. (2006). Sticks, stones, and hurtful words: Relative effects of various forms of childhood maltreatment. American Journal of Psychiatry, 163(6), 993-1000. https://doi.org/10.1176/ajp.2006.163.6.993
Cite this article
Zan,Y. (2025). The Correlation Between Parental Maltreatment and Depressive Symptoms Severity in Adolescents in the Chinese Context. Communications in Humanities Research,70,1-17.
Data availability
The datasets used and/or analyzed during the current study will be available from the authors upon reasonable request.
Disclaimer/Publisher's Note
The statements, opinions and data contained in all publications are solely those of the individual author(s) and contributor(s) and not of EWA Publishing and/or the editor(s). EWA Publishing and/or the editor(s) disclaim responsibility for any injury to people or property resulting from any ideas, methods, instructions or products referred to in the content.
About volume
Volume title: Proceedings of the 3rd International Conference on Interdisciplinary Humanities and Communication Studies
© 2024 by the author(s). Licensee EWA Publishing, Oxford, UK. This article is an open access article distributed under the terms and
conditions of the Creative Commons Attribution (CC BY) license. Authors who
publish this series agree to the following terms:
1. Authors retain copyright and grant the series right of first publication with the work simultaneously licensed under a Creative Commons
Attribution License that allows others to share the work with an acknowledgment of the work's authorship and initial publication in this
series.
2. Authors are able to enter into separate, additional contractual arrangements for the non-exclusive distribution of the series's published
version of the work (e.g., post it to an institutional repository or publish it in a book), with an acknowledgment of its initial
publication in this series.
3. Authors are permitted and encouraged to post their work online (e.g., in institutional repositories or on their website) prior to and
during the submission process, as it can lead to productive exchanges, as well as earlier and greater citation of published work (See
Open access policy for details).
References
[1]. American Psychiatric Association. (2024, April). What is depression. https://www.psychiatry.org/Patients-Families/Depression/What-Is-Depression
[2]. World Health Organization. (2023, March 31). Depressive disorder (depression). https://www.who.int/news-room/fact-sheets/detail/depression
[3]. World Health Organization. (2022, March 2). Covid-19 pandemic triggers 25% increase in prevalence of anxiety and depression worldwide. https://www.who.int/news/item/02-03-2022-covid-19-pandemic-triggers-25-increase-in-prevalence-of-anxiety-and-depression-worldwide
[4]. Shanghai Center of Biomedicine Development. (2023, October 4). Blue book on national depression (2022-2023): 50% of depression patients are students. ByDrug. https://bydrug.pharmcube.com/news/detail/233e0f10bc4c9337ac9ee758ebdc9a61
[5]. Chen, T., & Lv, P. (2017, March 1). Safeguarding children against domestic violence in China. The Asia Foundation. https://asiafoundation.org/2017/03/01/safeguarding-children-domestic-violence-china/
[6]. Yap, M. B. H., & Jorm, A. F. (2015). Parental factors associated with childhood anxiety, depression, and internalizing problems: A systematic review and meta-analysis. Journal of Affective Disorders, 175, 424-440. https://doi.org/10.1016/j.jad.2015.01.050
[7]. Fry, D., McCoy, A., & Swales, D. (2012). The consequences of maltreatment on children’s lives: A systematic review of data from the East Asia and Pacific region. Trauma, Violence, & Abuse, 13(4), 209-233. https://doi.org/10.1177/1524838012455873
[8]. Teicher, M. H., Samson, J. A., Polcari, A., & McGreenery, C. E. (2006). Sticks, stones, and hurtful words: Relative effects of various forms of childhood maltreatment. American Journal of Psychiatry, 163(6), 993-1000. https://doi.org/10.1176/ajp.2006.163.6.993