


1. Introduction
Nowadays, the number of people using the internet is increasing, and the impact of social media on people’s happiness is also increasing. After experiencing COVID-19, it is even more apparent. COVID-19 has changed many objective factors in people, and the changes in these objective factors have also affected people’s happiness in using social media [1-3].
This paper first analyzes the impact of age, gender, and educational background on the happiness of netizens who are not affected by the epidemic, based on data from 2019 and 2023. Secondly, the data from 2019 and 2023 were used to analyze the happiness of netizens, which were significantly affected by the epidemic, including income, living area, and social media trust. It is indispensable for comparing the data for 2019 and 2023. Firstly, by comparing the two years before and after the epidemic, it can be determined that as the impact of the epidemic decreases, the happiness of netizens will have a changing trend. Secondly, by comparing the data from 2019 and 2023, it is possible to analyze the differences in the impact of the epidemic on factors that are easily affected and less easily affected, and to explore the differences in the impact of the same factor between different years, to determine whether this factor has a significant impact on the happiness of netizen [4-7].
This paper explores the above factors, identifies the factors that have a greater and lesser impact on the happiness of netizens through analysis, and attempts to find the reasons for this phenomenon. This study provides some references for social media platforms to adjust their operational strategies for promoting positive content and focusing on the target audience by making preliminary judgments on the happiness of different populations. Moreover, compare and analyze the differences in the impact of factors that have changed significantly before and after the epidemic on the happiness of netizens, and predict the trend of future changes in the happiness of netizens.
Overall, there is no necessary relationship between age, education level, annual income, and happiness. Women are more sensitive to happiness than men. After COVID-19, people’s annual income, level of urban living, and suspicion of information accuracy have all developed negatively, with significant changes. Their location and city level influences people. The lower the city level, the lower their sense of happiness. After COVID-19, people are more skeptical about the accuracy of information, which is inversely proportional to their happiness.
The exploration of the happiness of the netizens could produce several advantages for social media platforms, studies in the future, and the policy about limiting the use of social media [8-10]. Firstly, the results of this paper can provide specific reference values for the operation of social media platforms, such as facing the content pushed by different groups, understanding which groups have a stronger dependence on social media platforms, and understanding the specific aspects in which the epidemic has an impact on users’ use of social media. Secondly, through the research of data and the integration and analysis of data results, the aim is to provide a reference value for subsequent research. Lastly, according to the data of this study, the government may get more precise data about the relationship between various common factors and happiness, and according to the data and the study results, the policy will be more reasonable and efficient for improving the happiness of netizens. Meanwhile, more happiness will promote harmony and stability in society.
2. Acquisition of Questionnaire
The data for the 2019 survey questionnaire comes from CNSDA (China Academic Survey Data Base), designed by Professor Ma Deyong from the Renmin University of China and responsible for implementing the survey. Four thousand eight hundred eighty-two samples were collected from survey websites, WeChat, Weibo, and other channels. In this study, approximately 500 samples were randomly selected for research. This questionnaire designed 34 research questions, and in this study, factors that were less affected by the epidemic in 2019, including age, gender, and educational background, were extracted, as well as factors that were more susceptible to the impact of the epidemic in terms of income, region, and social media trust—corresponding the above factors to the overall happiness of netizens, where the overall happiness is judged from three perspectives: social status, economic development, and life and work status. Moreover, assign each option a score from low to high, and analyze the data by calculating and comparing the scores. The survey questionnaire for 2023 followed the nine questions from the 2019 questionnaire, and the data was collected through the questionnaire website. The survey sample was based on approximately 500 netizens who filled out the questionnaire, covering all aspects of coverage for the above factors. Moreover, assign the problem the same score to research the data for 2023. The Questionnaire is shown in Table 1.
Table 1: Questionnaire.
1. May I ask which age group do you actually belong to? (Multiple choice questions * mandatory) 1-10 |
A Under 18 years old; B 18-24 years old; C 25-29 years old; D 30-34 years old; E 35-39 years old; F 40-44 years old; G 45-49 years old; H 50-54 years old; I 55-59 years old; J 60 years old and above |
2. Your gender (multiple choice questions * mandatory) 1-2 |
A male; B female |
3. What is your highest educational level (including current education)? (Multiple choice questions * mandatory) 1-6 |
A Primary school and below; B Junior High School; C High School/Vocational School/Technical School; D College Junior College; E University Undergraduate; F Master’s degree or above |
4. May I ask what is your approximate annual income? (Multiple Choice Questions * Required) 3-11 |
A Up to 20000 yuan; B 20000 to 50000 yuan; C 50000 to 100000 yuan; D 100000 to 150000 yuan; E 150000-200000 yuan; F 200000-400000 yuan; G 400000-600000 yuan; H 600000-1 million yuan; I Over 1 million yuan |
5. May I ask if the area you live in belongs to (multiple choice question * required answer) 3-7 |
A mega city, major city, provincial capital city; B Medium sized city; C Small City; D Town; E Foreign, Overseas; |
6. Today, people are increasingly relying on various media to understand what is happening in the world. However, there is a view that the news that the general public hears, sees, and reads is carefully selected, adapted, and packaged. It is difficult for people to understand the truth of the matter. What is your attitude towards this viewpoint? (Multiple Choice Questions * Required) 3-8 |
A very opposed; B Objection; C Neutral; D agrees; E strongly agrees; F doesn’t know |
7. Overall, are you satisfied with our current communication situation? (Multiple Choice Questions * Required) 3-7 |
A very dissatisfied; B Not very satisfied; C General; D quite satisfied; E very satisfied |
8. Overall, are you satisfied with the current state of economic development? (Multiple Choice Questions * Required) 3-7 |
A is very dissatisfied; B Not very satisfied; C General; D is quite satisfied; E is very satisfied; |
9. Overall, are you satisfied with your current life and work status? (Multiple Choice Questions * Required) 3-7 |
A is very dissatisfied; B Not very satisfied; C General; D is quite satisfied |
3. Experimental Results and Analysis
This paper respectively corresponds to the impact of six factors of age, gender, education level, annual income, living city level, and trust in information on the happiness of netizens before and after the COVID-19 epidemic, and through analysis, it is concluded that there is no necessary relationship between the age and education of netizens and happiness, but gender has a certain impact on happiness. The result is that women’s sensitivity to happiness is higher than men’s, and people have a higher annual income after the epidemic. The level of the city in which they live and the doubt about the accuracy of the information is negative development compared with before the epidemic, and the change is large; after analysis, it is concluded that there is no necessary relationship between the comprehensive happiness of netizens and the annual income, but after experiencing the impact of the COVID-19 epidemic on the city level where people are located and the doubt about the accuracy of the information, the comparison shows that people are affected by the region and city level, the smaller the city level, people’s happiness will also decrease, and after the epidemic, people are more skeptical about the accuracy of information. It is also inversely proportional to their happiness.
3.1. The Correlation Between Age and Happiness
Table 2: 2019 Age/Happiness data overview.
Descriptive Statistics | |||||
N | Maximum | Minimum | Average | Standard Deviation | |
Happiness | 525 | 3 | 14 | 5.27 | 1.429 |
Age | 525 | 4 | 10 | 5.14 | 1.064 |
Number of valid cases (in columns) | 525 | ||||
Table 3: 2019 Age/Happiness correlation.
Correlation | |||
Happiness | Age | ||
Happiness | Pearson correlation | 1 | .088 |
Significance (Double tailed) | .045 | ||
Number of cases | 525 | 525 | |
Age | Pearson correlation | .088 | 1 |
Significance (Double tailed) | .045 | ||
Number of cases | 525 | 525 | |
According to data from Figure 1, the grouping correspondence between the mean values of y and x is (4, 5.2) (5, 5.22) (6, 5.4) (7, 5.11) (8, 5.66) (9, 4.5) (10, 7.2). From the perspective of age growth, the happiness of netizens under the age of 55 generally increases with age, reaching a low point between the ages of 45 and 49, reaching the lowest level among netizens aged 55 to 59, and reaching the highest level among netizens over 60. As netizens grow older, their understanding of entertainment interests and the learning and work content they face increases. Therefore, social media can meet the increasing needs of netizens as they age, thereby improving their sense of happiness. From the perspective of overall happiness among netizens, from Table 2 and 3, the overall happiness is lower than the average and more severe. Most netizens may empathize with unfortunate, stressful, and pessimistic comments to a greater extent from social media information and rarely actively absorb and understand more optimistic comments. From a specific perspective, Figure 1 shows exceptionally high and low happiness levels in all age groups. Therefore, the most significant factor affecting the happiness of netizens is not the overall development trend of social media but is more likely related to personal factors.
Figure 1: Statistics on the happiness and age of internet users in 2019 (x=Overall Happiness, y=Age).
Table 4: 2023 Age/Happiness data overview.
Descriptive Statistics | |||||
N | Minimum | Maximum | Average | Standard Deviation | |
Age(2023) | 502 | 1 | 10 | 4.58 | 2.563 |
Happiness(2023) | 502 | 3 | 15 | 7.31 | 2.879 |
Number of valid cases (in columns) | 502 | ||||
According to Figure 2, the corresponding relationship between the average values of y and x is (1, 7.4) (2, 7.29) (3, 7.63) (4, 7.01) (5, 6.9) (6, 6.38) (7, 7.7) (8, 7.65) (9, 6.84) (10, 6.85)
From the perspective of age growth, the overall trend is divided into two stages: 18-44 years old and 15-60+, with significant fluctuations among netizens aged 25-29. Netizens of this age group are usually between high-intensity learning and middle-aged crisis, so they experience more social pressure than other age groups.
Table 5: 2023 Age/Happiness correlation.
Correlation | |||
Age | Happiness | ||
Age | Pearson correlation | 1 | -.029 |
Significance (Double tailed) | .510 | ||
Number of cases | 502 | 502 | |
Happiness | Pearson correlation | -.029 | 1 |
Significance (Double tailed) | .510 | ||
Number of cases | 502 | 502 | |
Figure 2: Statistics on the happiness and age of internet users in 2023 (x=Overall Happiness, y=Age).
From the perspective of overall happiness among netizens, from Table 4, the majority still believe they are unhappy, but the situation has eased compared to 2019. The end of the frequent outbreak of large-scale epidemics has alleviated the overall trend of layoffs and forced homelessness among netizens, resulting in higher satisfaction for their overall social, employment, and living needs.
Comparative analysis of 2019 data and 2023 data. There is a strong positive correlation between the age of netizens and their sense of happiness in 2019, from Table 3, and a negative correlation between the age of netizens and their sense of happiness in 2023, from Table 5. This indicates that the impact of age on netizens’ sense of happiness is unstable, indicating that there is no necessary connection between the two.
3.2. The Correlation Between Gender and Happiness
In the 2019 questionnaire data, there were 355 males and 165 females. Based on our summary of the three main factors that affect happiness (communication, economy, and work), it is not difficult to see that both male and female satisfaction is higher than dissatisfaction, and happiness is higher. Moreover, in proportion, women have a higher sense of happiness than men. In 2019, 335 males (social status: 18 were very dissatisfied, 28 were not very satisfied, 53 were average, 107 were relatively satisfied, and 129 were very satisfied). Economic development status: 19 are very dissatisfied, 26 are not very satisfied, 49 are average, 97 are relatively satisfied, and 144 are very satisfied. Life and work status: 24 very dissatisfied, 33 not very satisfied, 54 average, 82 relatively satisfied, 142 very satisfied). Female 165 (communication status: 7 very dissatisfied, 12 not very satisfied, 23 average, 55 relatively satisfied, 68 very satisfied). Economic development status: 5 very dissatisfied, ten not very satisfied, 20 average, 63 relatively satisfied, 67 very satisfied. Life and work status: 7 are very dissatisfied, 11 are not very satisfied, 23 are average, 54 are relatively satisfied, and 70 are very satisfied.
In 2023, Male 280 (social status: 82 very dissatisfied, 92 not very satisfied, 72 average, 24 relatively satisfied, ten very satisfied). Economic development status: 56 are very dissatisfied, 80 are not very satisfied, 82 are average, 42 are relatively satisfied, and 20 are very satisfied. Life and work status: 57 very dissatisfied, 69 not very satisfied, 92 average, 48 quite satisfied, 14 very satisfied). Female 220 (social status: 62 very dissatisfied, 85 not very satisfied, 51 average, 15 relatively satisfied, seven very satisfied). Economic development status: 41 very dissatisfied, 75 not very satisfied, 68 average, 28 relatively satisfied, eight very satisfied. Life and work status: 55 are very dissatisfied, 57 are not very satisfied, 70 are generally satisfied, 30 are relatively satisfied, and eight are very satisfied. In the 2023 questionnaire data, there are 280 males and 220 females. Based on our summary of the three main factors that affect happiness (communication, economy, and work), it is not difficult to see that both male and female dissatisfaction is higher than satisfaction, and happiness is lower. Moreover, in proportion, women have lower levels of happiness than men. Combined with the data from two years after the COVID-19 epidemic, the happiness of both men and women has undergone tremendous changes. Before the epidemic, people’s happiness was high, but after the epidemic, people’s dissatisfaction with society surged, leading to a decline in happiness. Regarding our data ratio, women’s happiness is more evident than men’s in performance.
3.3. The Correlation Between Income and Happiness
Table 6: Overview of 2019 internet user income and happiness data.
Descriptive Statistics | |||||
N | Minimum | Maximum | Average | Standard Deviation | |
Happiness | 524 | 3 | 15 | 11.85 | 3.174 |
Income | 524 | 1 | 9 | 3.53 | 1.745 |
Number of valid cases (in columns) | 524 | ||||
Table 7: The correlation between netizen income and happiness in 2019.
Correlation | |||
Happiness | Income | ||
Happiness | Pearson correlation | 1 | .112 |
Significance (Double tailed) | .011 | ||
Number of cases | 524 | 524 | |
Income | Pearson correlation | .112 | 1 |
Significance (Double tailed) | .011 | ||
Number of cases | 524 | 524 | |
Figure 3: Statistics on the income and happiness of internet users in 2019 (x=Comprehensive Happiness y=Annual Income).
According to Figure 3, the corresponding relationships between the groups of y and x averages are (9.82, 1) (9, 2) (9, 3) (9, 4) (9.82, 5) (10.2, 6) (10.75, 7) (12.25,8) (9.67, 9).Learning costs of work for this group of people are relatively low, and high salaries mean a high quality of life, which is also a factor in the overall happiness of this group of people. From the overall data, the average comprehensive happiness of netizens in 2019 was 11.85, higher than the median of 9, indicating that the overall happiness of netizens is relatively high. From the perspective of the overall happiness of people with an annual salary of over 1 million, from Table 6 and 7, the overall happiness of this group of people is the most unstable and fluctuates the most. Therefore, the impact of annual salary on their overall happiness is the smallest for this group.
Table 8: Overview of 2023 internet user income and happiness data.
Descriptive Statistics | |||||
N | Minimum | Maximum | Average | Standard Deviation | |
happiness | 502 | 3 | 15 | 7.31 | 2.879 |
income | 502 | 1 | 9 | 3.43 | 1.891 |
Number of valid cases (in columns) | 502 | ||||
Table 9: The correlation between Internet users’ income and happiness in 2023.
Correlation | |||
happiness | income | ||
happiness | Pearson correlation | 1 | -.042 |
Significance (Double tailed) | .351 | ||
Number of cases | 502 | 502 | |
income | Pearson correlation | -.042 | 1 |
Significance (Double tailed) | .351 | ||
Number of cases | 502 | 502 | |
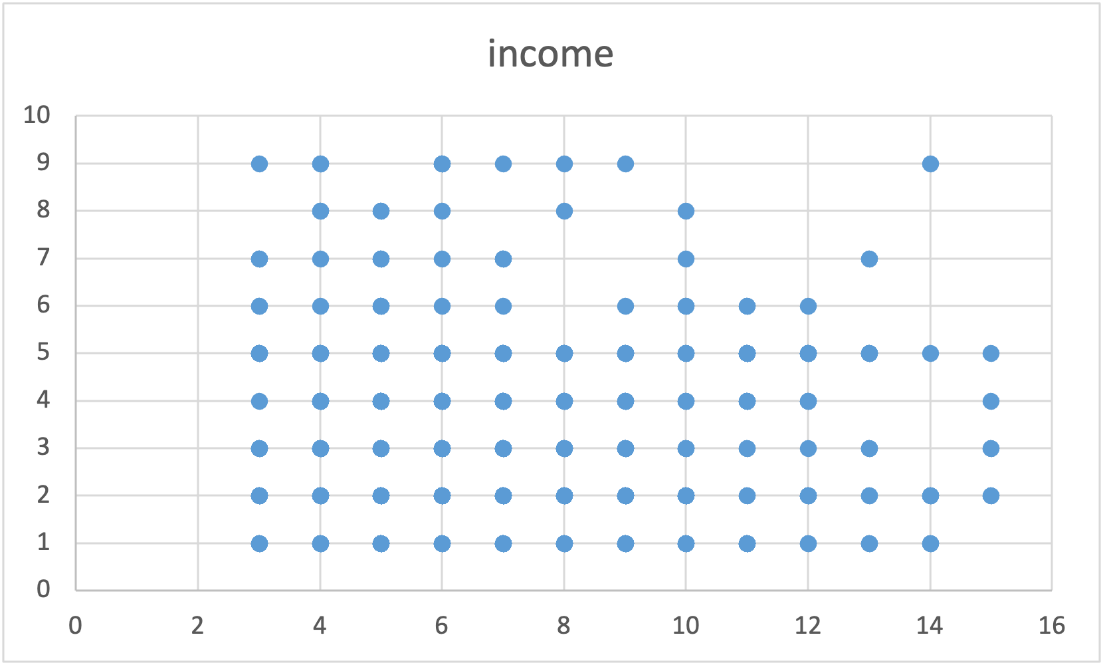
Figure 4: Statistics on the income and happiness of internet users in 2023 (x=Comprehensive Happiness y=Annual Income).
According to Figure 4, the corresponding relationships between the groups of y and x averages are (7.42, 1) (7.50, 2) (7.07, 3) (6.88, 4) (7.69, 5) (7.21, 6) (6, 8) (6.7, 9). From the perspective of the happiness trend, the overall happiness of netizens with an annual income of 0-100000 is higher than that of netizens with an annual income of over 600000. The overall trend shows a downward trend in happiness as the annual income increases. The economic situation in 2023 has led to a significant decline in income for various industries, and this situation has a significant impact on high-income groups while it has a small impact on low-income groups. Therefore, the overall happiness of high-income groups has significantly decreased and is generally low. From Table 8, the average happiness of netizens in 2023 was 7.31, which is lower than the average of 9, indicating that the overall happiness of netizens is relatively low, which has become one of the reasons why online discourse is becoming increasingly extreme and negative. It is worth noting that the distribution of comprehensive happiness among netizens with an annual income of 150000 to 200000 is average. In contrast, netizens with an income higher than this are more unstable and generally lower in terms of happiness. This means that when their income reaches 150000 to 200000 or more next year, the impact of annual income on their overall happiness will gradually decrease.
3.4. Comparative Analysis of 2019 Data and 2023 Data
The average comprehensive well-being of Internet users in 2019 is much higher than in 2023. Personally, this is closely related to the gradual increase of the impact of COVID-19, which not only accounts for the fact that the average annual income of Internet users in 2023 is lower than that in 2019 but also has a great impact on the overall well-being of Internet users in more aspects, such as mental health, employment rate and so on. In 2019, from table8, there was a weak correlation between the overall happiness of netizens and their annual income, while in 2023, from Table 9, there was a negative correlation between the overall happiness of netizens and their annual income, indicating that there is no necessary connection between the overall happiness of netizens and their annual income. The overall impact on the overall happiness of netizens gradually decreases with the increase in annual income.
3.5. The Correlation Between Location and Happiness
In 2019, this is the 500 data this paper collected, of which 139 people living in megacities, large cities, and provincial capitals, 7 said they were very dissatisfied with their communication situation, 7 said they were not very satisfied, 14 said they were average, and 39 were relatively satisfied 72 were very satisfied, 5 were very dissatisfied with the status quo of economic development, 11 were not very satisfied, 14 were average, 40 were somewhat satisfied, 69 were very satisfied, and 8 were very dissatisfied with their life and work status, and 10 were not very satisfied. 21 were average, 32 were somewhat satisfactory, and 68 were very satisfied. 204 people are living in medium-sized cities, of which 7 are very dissatisfied with their communication status, 19 are not very satisfied, 27 are average, 65 are somewhat satisfied, 86 are very satisfied, 7 are very dissatisfied with the current situation of economic development, 10 are not very satisfied, 26 are average, 67 are somewhat satisfied, 94 are very satisfied, 9 are very dissatisfied with their living and working status, 13 are not very satisfied, 25 are average, 57 are somewhat satisfied, and 100 are very satisfied. 118 people are living in small cities, of which 5 are very dissatisfied with their communication status, 11 are not very satisfied, 28 are average, 45 are somewhat satisfied, 29 are very satisfied, 8 are very dissatisfied with the current situation of economic development, 9 are not very satisfied, 24 are average, 42 are more satisfied, 35 are very satisfied, 11 are very dissatisfied with the state of life and work, 14 are not very satisfied, 24 are average, 38 are relatively satisfied, and 31 are very satisfied. 23 people are living in the town, of which 3 are very dissatisfied with their communication situation, 2 are not very satisfied, 5 are average, 8 are somewhat satisfied, 5 are very satisfied, 2 are very dissatisfied with the current situation of economic development, 2 are not very satisfied, 3 are average, 10 are relatively satisfied, 6 are very satisfied, 1 is very dissatisfied with the state of life and work, 4 are not very satisfied, 4 are average, 7 are somewhat satisfied, and 7 are very satisfied. 16 people are living abroad and abroad, of which 3 are very dissatisfied with their communication status, 1 is not very satisfied, 2 are average, 5 are somewhat satisfied, 5 are very satisfied, 2 are very dissatisfied with the current situation of economic development, 4 are not very satisfied, 2 are average, 1 is relatively satisfied, 7 are very satisfied, 2 are very dissatisfied with the state of life and work, 3 are not very satisfied, 3 are average, 2 are somewhat satisfied, and 6 are very satisfied. In the 500 questionnaires this paper surveyed in 2019, the proportion of people living in medium-sized cities and above was relatively high (68.6%), while the proportion of people living in small cities and towns was relatively low (28.2%), with only 0.32% living abroad or abroad. Combined with the three factors that affect happiness (communication, economy, life and work), it is easy to see that people living in medium-sized cities and above were more satisfied before the COVID-19 epidemic. In other words, people in small cities and towns were less happy, and many people were neutral in the choice of the three factors; People living abroad or abroad have lower levels of happiness, with lower satisfaction in all three factors. Overall, before the outbreak of the epidemic, people living in China had a higher sense of happiness than those living abroad or abroad, and the trend of happiness in China is to increase with the level of cities.
In 2023, this is the 500 data this paper collected, of which 45 people live in megacities, big cities, and provincial capitals, of which 15 are very dissatisfied with their communication status, 10 are not very satisfied, 14 are average, 4 are relatively satisfied, 2 are very satisfied, 8 are very dissatisfied with the status quo of economic development, 9 are not very satisfied, 18 are average, 8 are somewhat satisfied, 2 are very satisfied, 8 are very dissatisfied with their living and working status, 13 are not very satisfied, 17 are average. 7 are satisfactory, 0 are very satisfied. 141 people are living in medium-sized cities, of which 40 are very dissatisfied with the current state of communication, 46 are not very satisfied, 38 are average, 12 are somewhat satisfied, 5 are very satisfied, 28 are very dissatisfied with the current situation of economic development, 40 are not very satisfied, 45 are average, 23 are somewhat satisfied, 5 are very satisfied, 31 are very dissatisfied with their state of life and work, 32 are not very satisfied, 43 are average, 25 are somewhat satisfied, and 10 are very satisfied. There are 271 people living in small cities, of which 74 are very dissatisfied with their communication status, 104 are not very satisfied, 66 are average, 19 are somewhat satisfied, 8 are very satisfied, 47 are very dissatisfied with the current situation of economic development, 94 are not very satisfied, 76 are average, 37 are somewhat satisfied, 17 are very satisfied, 63 are very dissatisfied with their living and working status, 71 are not very satisfied, 88 are average, 39 are somewhat satisfied, and 10 are very satisfied. 43 people are living in the town, of which 15 are very dissatisfied with their communication situation, 17 are not very satisfied, 5 are average, 4 are somewhat satisfied, 2 are very satisfied, 14 are very dissatisfied with the current situation of economic development, 12 are not very satisfied, 11 are average, 2 are relatively satisfied, 4 are very satisfied, 10 are very dissatisfied with their living and working status, 15 are average, 6 are somewhat satisfied, and 2 are very satisfied. 0 people were living abroad or abroad. In the 500 questionnaires this paper surveyed in 2023, the number of people living in megacities, large cities, and provincial capital cities has significantly decreased compared to 2019, and the number of people living in medium-sized cities has also decreased significantly. Most people have gone to small cities, and the number of people in towns has also increased significantly compared to 2019, while the number of people living abroad and overseas has decreased to zero. In terms of personnel mobility, affected by the COVID-19 epidemic, many people who make a living in medium-sized cities and above may return to their hometown or go to other small cities to develop their lives because of work life, economic and other reasons. After COVID-19, the domestic sense of happiness has undergone tremendous changes. No matter what level of the city, people’s sense of happiness is very low, and people’s dissatisfaction with the three elements is far more than satisfaction. Based on the comparative analysis of the data from two years before and after the COVID-19 epidemic, it is not difficult to see that the epidemic’s impact on people’s happiness is huge. Before the outbreak of the epidemic, the happiness and satisfaction of domestic people were positive and positive; After the epidemic, many people have moved to small cities, and their sense of happiness and satisfaction has significantly decreased, which is in opposition to the relationship before the outbreak of the epidemic.
3.6. The Correlation Between Social Media and Happiness
As shown in question 6, in 2023, the most significant proportion was option D which was 325 people who agreed that the information was inaccurate. Moreover, the most minor proportion was option A, which was 22 people who were remarkably against inaccurate information. Then, 31 people were against the information that was not accurate, 96 people were neutralizing the attitude that the information was not accurate, 116 people exceptionally agreed that the information was inaccurate, and 28 people did not know about this question that the information was not accurate. Many people experienced inaccurate reporting during COVID-19. For example, some governments and authorities were benevolent enough to hide the truth about the death toll. So, the sense of happiness decreased because they knew that some information, reports, and data were untrue, thinking whether the governments may conceal more truth. This concern has a negligible impact on human life, they may waste time worrying about whether their view is true or false.
In 2019, the biggest proportion was option C which was 1456 people neutralizing their attitude that the information was inaccurate. Moreover, the smallest proportion was option F which was 74, which was people who did not know that the information needed to be more accurate about this question. Then, 406 people extremely against the information was not accurate, 616 people who against the information was not accurate, 1356 people agreed that the information was inaccurate, and 965 people extremely agreed that the information was inaccurate. Therefore, there were similar to the data in 2023, except the population of people who were extremely against the information was not accurately increased, and the population of people who were neutralizing attitudes toward the information needed to be accurately increased. Because they did not experience the false data period that was during the pandemic, they hesitated and did not indeed that whether believing the information from the press and media. When they got through COVID-19, their mind had a small quantity of change, which caused the difference in data.
4. Conclusion
Combined with the comparative analysis of data in the two years before and after the new crown epidemic, it is easy to see that it hit people’s happiness significantly before the epidemic outbreak. After the epidemic, happiness and satisfaction have decreased significantly, and there is an antithetical relationship with before the outbreak. In 2019, the correlation between age and happiness of netizens was solid and positive. In 2023, the correlation between age and happiness of netizens was negative, indicating that the influence of netizens’ age on netizens’ happiness was unstable, indicating that there was no necessary connection between the two. In 2019, women’s happiness was generally higher than that of men. In 2023, women’s happiness was generally lower than men’s, from which it was concluded that women were more sensitive to happiness than men. Comparing the data before and after the epidemic, it is found that these data are like the data in 2019, except that the number of people with college degrees is relatively reduced, and the impact of education on happiness is insignificant, indicating that there is no necessary connection. In 2019, netizens’ comprehensive happiness and annual income were weakly correlated. In 2023, the correlation between netizens’ comprehensive happiness and annual income was negatively correlated, indicating no necessary relationship between netizens’ comprehensive happiness and annual income. The overall impact on the overall happiness of netizens gradually decreases with the increase in annual income.
In 2019, the proportion of people living in medium-sized cities and above was relatively high. The happiness was generally higher, while the number of people living in megacities, large cities, and provincial capitals in 2023 was significantly reduced compared with 2019. The number of people living in medium-sized cities also decreased a lot. Most of them went to small cities. The townspeople also improved significantly compared with 2019, but the happiness was diametrically opposite to the pre-epidemic data. The data for 2019 is like that for 2023, except that the population, which is extremely opposed to the inaccurate increase in information, and the population with a neutral attitude towards the information does not increase accurately. Because they have not experienced a period of false data during the pandemic, they are hesitant and do not believe the information of the news media. Their minds changed a bit as they got through COVID-19, leading to data discrepancies. After the pandemic, people are more sceptical about the accuracy of information and less happy.
In general, there is no necessary relationship between the age and education of netizens and happiness, but in terms of gender, women are more sensitive to happiness than men; Comparing the data of the two years before and after the new crown epidemic, this paper found that after the epidemic, people’s annual income, the level of the city they live in and the doubt about the accuracy of the information are all negative, and the change is large, after analysis, it is concluded that there is no necessary relationship between the comprehensive happiness of netizens and the annual income, but after experiencing the impact of the new crown epidemic on the level of the city where people are located and the doubt about the accuracy of the information, the comparison concludes that people are affected by the region and city level, the smaller the city level, People’s happiness has also decreased, and after the pandemic, people have become more sceptical about the accuracy of information, which is inversely proportional to their happiness.
References
[1]. Andrew E. Clark, Paul Frijters, Michael A. Shields. Income and happiness: Evidence, explanations and economic implications. 2006. (halshs-00590436).
[2]. Mehrdadi, A., Sadeghian, S., Direkvand-Moghadam, A., & Hashemian, A. (2016). Factors Affecting Happiness: A Cross-Sectional Study in the Iranian Youth. Journal of clinical and diagnostic research : JCDR, 10(5), VC01–VC03. https://doi.org/10.7860/JCDR/2016/17970.7729
[3]. WANG Xue,ZHOU Haining. The influence of social media use on subjective well-being[J].Young Journalists,2019,000(23):19-20.).
[4]. Yang Jidong, Zou Hongwei Economic Analysis of the ‘Mid life Crisis’ - Evidence Based on Happiness Data [J]. Labor Economics Research, 2021,9 (03): 71-100.
[5]. CHOI CLEE J.YO0 M S,et al.South Korean children’s academic achievement and subjective well-eing: the mediation oiacademic stress and the moderation of perceived fairness of parents and teachers J].Children and Youth Services Review.2019( 5) : 222-230.
[6]. HUANG Feng,GUO Feng,HE Qingqing. The effect of cognitive failure on the subjective well-being of college students:The mediating role and gender difference of mobile phone addiction[J].Journal of Xinyang Normal University:Philosophy and Social Sciences,2023,43(2):75-80.).
[7]. Liu Fengyu, Wu Zhanyong, Chen Li. Family Income and Residents’ Happiness [J]. Journal of Nanyang Institute of Technology, 2023,15 (03): 55-60. DOI: 10.16827/j.cnki.41-1404/z.2023.03.009.
[8]. Fan Jixiang. The impact of the COVID-19 on residents’ income [J]. Qinghai Finance, 2020 (08): 41-44.
[9]. Chae, J. (2018). Reexamining the relationship between social media and happiness: The effects of various social media platforms on reconceptualized happiness. Telematics and Informatics, 35(6), 1656-1664.
[10]. Lan Yang. Analysis of influencing factors of subjective well-being of urban residents based on structural equation model[J].Journal of Xinyang Normal University:Natural Science Edition,2022,35(2):241-247.)
Cite this article
Liu,J. (2023). Analysis of the Influence of Common Factors on the Happiness of Internet Users. Communications in Humanities Research,12,208-220.
Data availability
The datasets used and/or analyzed during the current study will be available from the authors upon reasonable request.
Disclaimer/Publisher's Note
The statements, opinions and data contained in all publications are solely those of the individual author(s) and contributor(s) and not of EWA Publishing and/or the editor(s). EWA Publishing and/or the editor(s) disclaim responsibility for any injury to people or property resulting from any ideas, methods, instructions or products referred to in the content.
About volume
Volume title: Proceedings of the International Conference on Global Politics and Socio-Humanities (ICGPSH 2023)
© 2024 by the author(s). Licensee EWA Publishing, Oxford, UK. This article is an open access article distributed under the terms and
conditions of the Creative Commons Attribution (CC BY) license. Authors who
publish this series agree to the following terms:
1. Authors retain copyright and grant the series right of first publication with the work simultaneously licensed under a Creative Commons
Attribution License that allows others to share the work with an acknowledgment of the work's authorship and initial publication in this
series.
2. Authors are able to enter into separate, additional contractual arrangements for the non-exclusive distribution of the series's published
version of the work (e.g., post it to an institutional repository or publish it in a book), with an acknowledgment of its initial
publication in this series.
3. Authors are permitted and encouraged to post their work online (e.g., in institutional repositories or on their website) prior to and
during the submission process, as it can lead to productive exchanges, as well as earlier and greater citation of published work (See
Open access policy for details).
References
[1]. Andrew E. Clark, Paul Frijters, Michael A. Shields. Income and happiness: Evidence, explanations and economic implications. 2006. (halshs-00590436).
[2]. Mehrdadi, A., Sadeghian, S., Direkvand-Moghadam, A., & Hashemian, A. (2016). Factors Affecting Happiness: A Cross-Sectional Study in the Iranian Youth. Journal of clinical and diagnostic research : JCDR, 10(5), VC01–VC03. https://doi.org/10.7860/JCDR/2016/17970.7729
[3]. WANG Xue,ZHOU Haining. The influence of social media use on subjective well-being[J].Young Journalists,2019,000(23):19-20.).
[4]. Yang Jidong, Zou Hongwei Economic Analysis of the ‘Mid life Crisis’ - Evidence Based on Happiness Data [J]. Labor Economics Research, 2021,9 (03): 71-100.
[5]. CHOI CLEE J.YO0 M S,et al.South Korean children’s academic achievement and subjective well-eing: the mediation oiacademic stress and the moderation of perceived fairness of parents and teachers J].Children and Youth Services Review.2019( 5) : 222-230.
[6]. HUANG Feng,GUO Feng,HE Qingqing. The effect of cognitive failure on the subjective well-being of college students:The mediating role and gender difference of mobile phone addiction[J].Journal of Xinyang Normal University:Philosophy and Social Sciences,2023,43(2):75-80.).
[7]. Liu Fengyu, Wu Zhanyong, Chen Li. Family Income and Residents’ Happiness [J]. Journal of Nanyang Institute of Technology, 2023,15 (03): 55-60. DOI: 10.16827/j.cnki.41-1404/z.2023.03.009.
[8]. Fan Jixiang. The impact of the COVID-19 on residents’ income [J]. Qinghai Finance, 2020 (08): 41-44.
[9]. Chae, J. (2018). Reexamining the relationship between social media and happiness: The effects of various social media platforms on reconceptualized happiness. Telematics and Informatics, 35(6), 1656-1664.
[10]. Lan Yang. Analysis of influencing factors of subjective well-being of urban residents based on structural equation model[J].Journal of Xinyang Normal University:Natural Science Edition,2022,35(2):241-247.)