


1. Introduction
On the Internet, short videos are a form of content distribution that generally ranges from a few seconds to five minutes of video. Online platforms allow people to watch, browse, and share short videos at any time, and they have gradually expanded to shopping and social networking in recent years. They are using mobile Internet technology to spread to the audience, with entertainment, science, singing, dancing, and fashion as the main content, to attract the audience’s attention to obtain many attention and commercial value. With the rapid development of modern society, the popularization of Mobile terminals, and the acceleration of the network, the development of 5th Generation Mobile Communication Technology, the communication content, which is short-term, fast-growing, high-traffic, and efficient, has gradually won the attention of significant platforms, fans, and capital.
A short video has the characteristics of simple production, rapid dissemination, ease of acceptance by the general audience, low creation threshold, rich content, fascinating, short video communication mode fragmentation, and so on [1].
In recent years, TikTok has been an app that allows people to create, share, socialize, and consume short video content. With the increasing pressure of people’s lives and the fast-paced development of modern society, short videos have become a way for people to entertain and leisure, with a broad audience and unlimited development potential [2].
Mcquail thinks that the audience is not merely a passive recipient [3]. In short videos, the audience, including the creator, is also the user of the short video platform. Under certain circumstances, the audience and the platform interact with each other. Zhaoying G believes that in TikTok, everyone is considered ‘we media,’ and everyone has a microphone. TikTok makes it easy for people to get traffic, get attention, and get on the road to fame and makes every ordinary user realize the free conversion between audience, opinion leaders, and communicators [4]. This makes the platform more sensitive to the user’s feelings, “When you reply to user messages in real-time, not only do you keep the customer up to date, but you also show the world through your public feed that you are engaged [5]. In this process of e-commerce marketing, there is a strong correlation with social media. Azpeitia J. found that social media can further establish the relationship between businesses and consumers. As social media continues to change, companies must keep up with these changes to remain relevant [6]. There has been a continuous stream of marketing activities. Increasing daily active users and the endless stream of creators have quickly made TikTok popular, and it has many user fans [7].
Currently, TikTok has more than 250 million users. More than 500 million monthly active users. User boundaries continue to expand. User profiles are more diverse, active, and used [8]. Statistics show that 68.97% of TikTok users are under 24 years old, and 73.69% are over 30. A TikTok product researcher once mentioned that most of their main groups are after 95 or even after 00. As a group of college students who frequently use social media, TikTok has had a profound impact on the lifestyle of college students. Under the marketing of TikTok, college students’ consumption patterns and shopping needs have also undergone significant changes.
W. and Liu, X. It is found that emotional experience has a significant positive impact on experiential symbol consumption, and symbol consumption positively impacts brand loyalty [9]. Social e-commerce purchase consumption is no longer focused on the quality of consumption but on the development of the perceptual consumption stage; consumers are concerned about the novel fashion can fully show their personality and the unique value of the product, pay more attention to the emotional experience in the process of purchasing consumption, to meet the social, emotional needs of consumers has become a key measure to promote consumer purchase. However, most research on the effect of online word-of-mouth on consumers’ purchase intention is mainly direct references to Western scholars’ research and needs multi-perspective research in the context of Chinese social e-commerce.
This paper argues that when analyzing social media communication strategies and user behaviors, users’ behaviors should be benchmarked to social media communication strategies and relevant data can be integrated to achieve a more personalized communication mode. Make future network marketing more accurate and make the transaction more effective.
As the most active and mainstream group of TikTok, college students have essential reference significance for the study. This paper discusses the influence mechanism of word-of-mouth characteristics on college students’ purchase intention from the perspective of social media. It provides specific reference values for studying the word-of-mouth communication process and consumer information adoption in social e-commerce networks. In this paper, when brand marketing is enhanced, brand interaction, experience perception, interest, and perception are enhanced. The more frequently consumers interact with the brand, the more frequently they connect and communicate with it, and their purchasing behavior will be enhanced. College students’ average monthly disposable income strongly correlates with their consumption activities.
2. Method
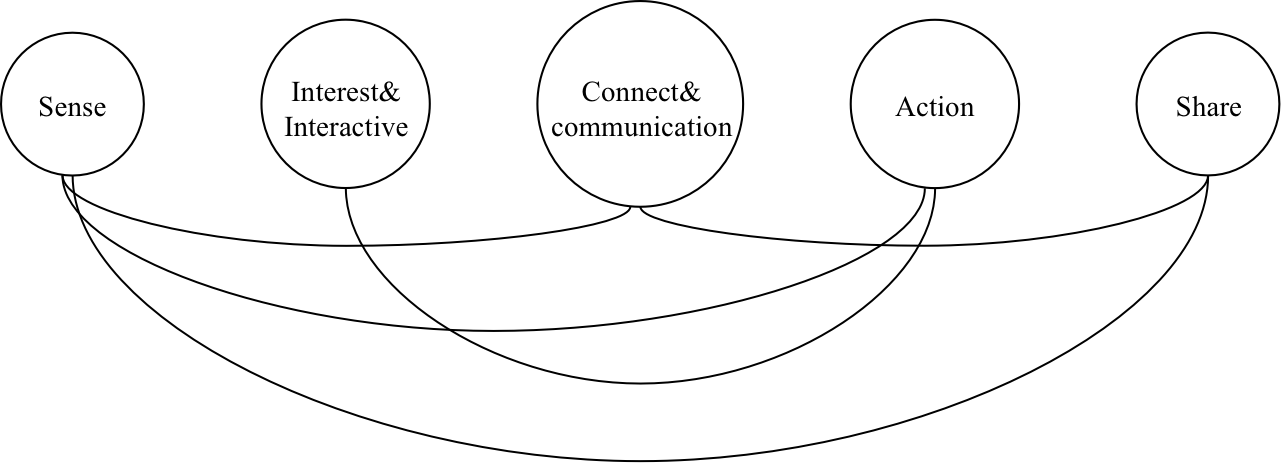
Figure 1: SICAS model.
In 2011, the China Internet Network Information Center proposed a digital consumption model based on the era of social networks called the SICAS model. The main body of social media marketing is consumers. Then, it comprehensively analyzes the five dimensions of the SICAS consumer behavior model between consumers and enterprises: mutual perception, interest interaction, interactive communication, action purchase, and experience sharing, and finally develops relevant marketing strategies, as shown in Figure 1 [10]. Figure 2 shows that these five dimensions are consistent with the research objectives and have corresponding relationships.
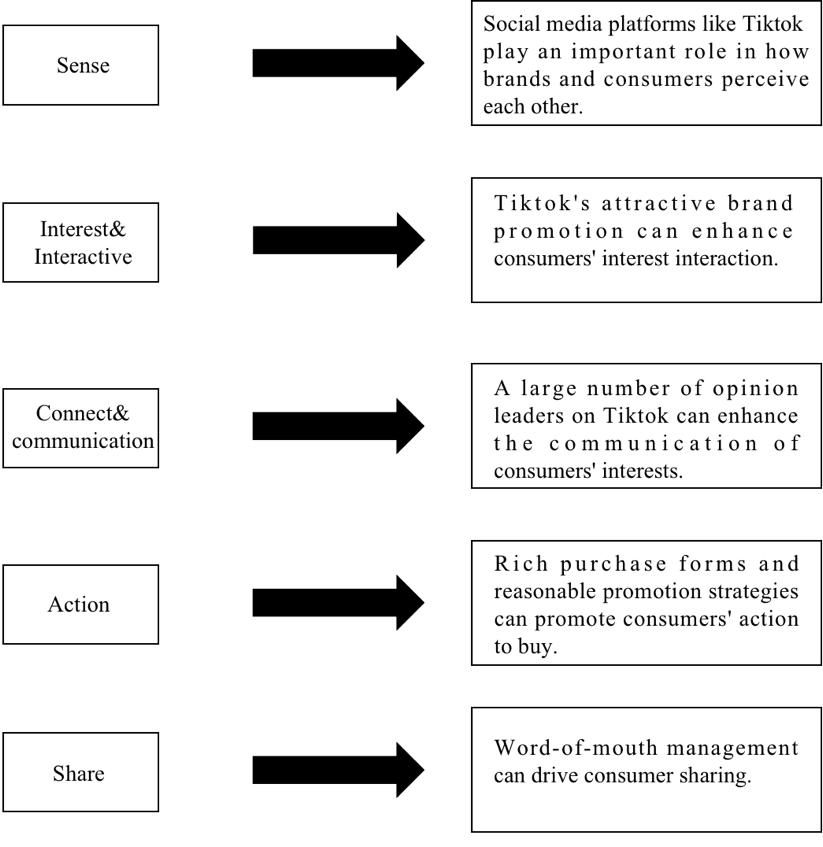
Figure 2: Dimensions consistent with the research objectives and have corresponding relationships.
2.1. Analysis of Variables
• Independent variable -- dependent variable
• Duration of use -- purchase behavior
• Brand promotion -- Buying behavior.
• Brand interaction -- Buying behavior.
Intermediary mechanism: stimulate purchase intention by influencing college students’ experience perception, interest, and interaction, contact and communication, thus producing purchase behavior.
2.2. Propose Research Hypotheses
The following are 15 basic assumptions of this paper.
• Assumptions related to independent variables (The duration of college students’ use of TikTok)
1) H1The duration of college students’ use of TikTok positively/negatively affects their experience perception.
2) H2The duration of use of TikTok by college students arouses interest and interaction in a positive/negative way.
3) H3The duration of college students’ use of TikTok positively/negatively affects their contact and communication.
4) H4The duration of college students’ use of TikTok positively/negatively affects their purchasing behavior.
• Assumptions related to independent variables (Brand promotion in TikTok)
5) H5Brand promotion in TikTok positively/negatively affects college students’ experience perception.
6) H6Brand promotion in TikTok positively/negatively affects college students’ interest and interaction.
7) H7Brand promotion in TikTok positively/negatively affects college students’ contact and communication.
8) H8Brand promotion in TikTok positively/negatively affects college students’ purchasing behavior.
• Assumptions related to independent variables (College students’ brand interaction in TikTok)
9) H9College students’ brand interaction in TikTok positively/negatively affects college students’ experience perception.
10) H10College students’ brand interaction in TikTok positively/negatively affects college students’ interest and interaction.
11) H11College students’ brand interaction in TikTok positively/negatively affects college students’ contact and communication.
12) H12College students’ brand interaction in TikTok positively/negatively affects college students’ purchasing behavior.
• Hypotheses related to independent variables (Buying behavior)
13) H13Experience perception positively/negatively affects buying behavior.
14) H14Interest and interaction positively/negatively influence buying behavior.
15) H15Connecting and interactive communication positively/negatively affects buying behavior.
2.3. Models
Based on the relevant theories of social media and the theoretical model of SICAS, a model of TikTok’s influence on college students’ purchasing behavior is constructed, and the influencing factors and communication mechanisms of TikTok on college students’ purchasing behavior are analyzed. This study takes college students’ purchasing behavior as the dependent variable, selects TikTok to use time, TikTok brand promotion, and brand interaction of college students as the independent variables, and experiences perception, interest, and interaction, contact, and communication as the intermediary variables.
2.4. Questionnaire Design
The questionnaire as shown in Table 1.
Table 1: Questionnaire.
Variable Names | Title number | Questions |
Duration of Tiktok use | A1 | I use Tiktok for a very long time every day |
A2 | I think the longer I use Tiktok, the more likely it is that I will make a purchase in the process of watching videos | |
Brand promotion | B1 | Do you know something about the brand because of the brand promotion you see on Tiktok? |
B2 | I think after promotion on TikTok platform, I buy more items on TikTok than on other platforms | |
B3 | I think the items purchased on Tiktok are of good quality, the items match the promotion and the prices are right | |
Brand interaction | C1 | I will develop a favorable impression on the products recommended by Tiktok and make a purchase |
C2 | I have often interacted with brands on Tiktok (e.g. comments, likes, shares, etc.) | |
Experience perception | D1 | I think the experience on Tiktok had a big impact on my buying behavior/willingness |
D2 | Do you think the experience on Tiktok has influenced your perception of the brand? | |
Interest and engagement | E1 | I’m excited about the interesting content I see on Tiktok |
E2 | I am more than willing to interact with interesting brands/goods I see on Tiktok | |
Contact and communication | F1 | Do you communicate with brands through Tiktok? |
F2 | Do you think communicating with brands through Tiktok has an impact on your purchase decision? | |
F3 | Have you ever made a purchase because of something you saw on Tiktok? |
3. Result Analysis
Obtain the relevant data by designing the questionnaire and issuing the questionnaire. In the end, the total number of questionnaires collected was 163.
3.1. Descriptive Analysis
3.1.1. Basic Information of Sample
Table 2: Basic Information of sample.
Frequency | Percentage % | ||
Gender | male | 29 | 17.8% |
female | 134 | 82.2% | |
Grade | freshman | 12 | 7.4% |
Sophomore year | 64 | 39.3% | |
Juniors | 52 | 31.9% | |
senior | 18 | 11.0% | |
Master’s degree or above | 17 | 10.4% | |
Average monthly disposable income | Less than 1000 | 9 | 5.5% |
1000-1500. | 53 | 32.5% | |
1500-2000. | 54 | 33.1% | |
2000-2500. | 21 | 12.9% | |
2500-3000. | 9 | 5.5% | |
3,000 + | 17 | 10.4% | |
As shown in Table 2, the study’s sample was disproportionately female, 82.2 percent, and male, 17.8 percent. This may reflect the specific context or purpose of the study or most users of the subject (for example, of a particular product or service). Most respondents were undergraduates, with sophomores accounting for the highest proportion at 39.3 percent, followed by juniors at 31.9 percent. Seniors and students with a master’s degree or above account for a relatively low proportion. Respondents’ average monthly disposable income is between 1,000 and 2,000 yuan, with 1,500-to-2,000-yuan accounting for 33.1 percent of the total, followed by those with 1,000 to 1,500 yuan at 32.5 percent. The proportion of respondents with less than 1,000 yuan and more than 3,000 yuan was relatively low.
3.1.2. Statistical Analysis of Each Dimensions
As shown in Table 3, data results from a descriptive statistical analysis across seven dimensions (brand marketing, brand interaction, experience perception, interest and interaction, connection and communication, purchase behavior, and duration of use). Based on the data, the minimum value of “Brand marketing” is 1.00, the maximum is 5.00, the average is 3.2270, and the standard deviation is 89711. This means that “brand marketing” scores are distributed between 1 and 5, with most scores clustered around the mean. The same is true for “brand interaction,” “experience perception,” “interest and interaction,” “connection and communication,” “purchase behavior,” and “duration of use.” Each variable has a minimum value of 1.00 and a maximum value of 5.00, and the mean and standard deviation values vary. However, all indicate that the scores for each dimension are clustered around the mean.
The sample size (N) for all variables is 163, meaning all variables have valid observations in the 163 sample and no missing data. Based on the mean, “Interest and interaction” had the highest score with an average of 3.4356, while “Duration of use” had the lowest score with an average of 2.8681. This may reflect that participant placed a higher value on “interest and interaction” and a lower value on “duration of use.” The standard deviation for all variables was slight, indicating that scores for each dimension were distributed around the mean, and there were no extreme scores. Among them, the standard deviation of “use time” is the largest, reaching 1.00589, indicating that the “use time” score significantly changes.
Table 3: Descriptive statistics.
Numbers | Minimum (M) | Maximum value (X) | Average (E) | Standard deviation | |
Brand marketing | 163 | 1.00 | 5.00 | 3.2270 | .89711 |
Brand Interaction | 163 | 1.00 | 5.00 | 2.9652 | .97261 |
Experiential perception | 163 | 1.00 | 5.00 | 3.3405 | .97453 |
Interest and interaction | 163 | 1.00 | 5.00 | 3.4356 | .92153 |
Contact and communication | 163 | 1.00 | 5.00 | 3.0429 | .96928 |
Buying behavior | 163 | 1.00 | 5.00 | 3.2883 | .98271 |
Duration of use | 163 | 1.00 | 5.00 | 2.8681 | 1.00589 |
3.2. Correlation Analysis
3.2.1. Analysis of Correction Between Dimensions and Grades
Table 4: Analysis of correlations between dimensions and grades.
dimensionality | Chi-square values | P value | Whether significant at a statistical level of 5% |
Brand Marketing | 47.218 | 0.505 | no |
Brand interaction | 58.434 | 0.144 | no |
Experience perception | 25.852 | 0.77 | no |
Interest and interaction | 25.624 | 0.78 | no |
Contact and communication | 31.496 | 0.492 | no |
Buying behavior | 36.618 | 0.263 | no |
Length of use | 47.521 | 0.038 | is |
The chi-square test was used to evaluate the correlation between each dimension and grade, and SPSS output results are shown in Table 4. Chi-square tests calculate chi-square values and P-values. P-values are used to evaluate whether the results of hypothesis tests are significant. If the P-value is less than 5% of the predetermined significance level, then we reject the null hypothesis and consider that there is a significant association between the variables. This table shows that only the P-value for the length of use is less than 0.05, concluding that there is a significant association between the length of use and grade at the 5% statistical level.
For the other dimensions (brand marketing, brand interaction, experience perception, interest and interaction, connection, and communication, purchasing behavior), they all have P-values higher than 5%, so we cannot reject the null hypothesis, that is, the relationship between these dimensions and grade level is not statistically significant.
3.2.2. Analysis of the Correction Between the Various Dimensions and Disposable Income
Table 5: Analysis of the correlation between the various dimensions and disposable income.
Dimensions | Chi-square values | P value | Whether there is a significant difference (5% statistical level) | Correlation with average monthly disposable income |
Brand Marketing | 64.735 | 0.315 | no | .674 |
Brand interaction | 64.62 | 0.318 | no | .405 |
Experiential perception | 50.442 | 0.125 | no | .001 |
Interest and interaction | 44.258 | 0.297 | no | .747 |
Contact and communication | 28.225 | 0.919 | no | .096 |
Buying behavior | 28.293 | 0.917 | no | .952 |
Duration of use | 39.189 | 0.507 | no | .801 |
The Table 5 show that the differences in average monthly disposable income by dimension, known as the Pearson Chi-square test, which measures the strength of the linear relationship between two variables. This value ranges from -1 to 1, with close to -1 indicating a strong negative linear relationship, close to 1 indicating a strong positive relationship, and close to 0 indicating no linear relationship. In this case, the correlation between all dimensions and average monthly disposable income is insignificant, and the P-value is more significant than 0.05. At the statistical level of 5%, the statistical result is insignificant, indicating no significant difference between the dimensions in average monthly disposable income.
3.2.3. Analysis of the Correction Between the Various Dimensions and Disposable Income
Corresponding characters replace the relevant information in the following correlation analysis table (Table 6). BM replaces brand marketing. BI replaces brand interaction. E. Interest replaces experience perception, I. Contact replaces interaction, communication is replaced by C. Buying behavior is replaced by B. U. Pearson Relevance replaces the Length of use is replaced by R. Salience (double tail) is replaced by S.
Table 6 is a Pearson correlation matrix showing the different marketing elements of a brand. The Pearson Correlation coefficient is a statistic used to measure the correlation between two variables, ranging from -1 to +1, where -1 means a perfect negative correlation, +1 means a perfect positive correlation, and 0 means no correlation. All the correlations in this table are positive and in the range of 0.5 to 0.8, which suggests a moderate to high positive correlation.
All of the significance values are 0.000, indicating that all of the correlations are significant, i.e., they cannot have happened randomly. This is done with a confidence (double measure) of 0.01, meaning there is only a 1% chance that these correlations are due to random error.
According to this table:
Brand marketing has a high positive correlation with all other variables, especially with brand interaction (0.724), experience perception (0.685), and interest and interaction (0.711). This means that these variables are generally enhanced when brand marketing is enhanced.
Brand interaction and connection and communication (0.764) have the highest correlation, which may mean that the more often consumers interact with the brand, the more often they connect and communicate with it.
Experience perception has the highest correlation with interest and interaction (0.750), indicating that the quality of consumers’ experience significantly impacts their interest and interaction behavior.
Buying behavior has the highest correlation with connection and communication (0.727) and brand interaction (0.744), which may indicate that the more consumers interact and communicate with brands, the more frequent the purchase behavior.
Table 6: Correlation analysis of each dimension.
BM | BI | E | I | C | B | U | ||
BM | R | 1 | .724** | .685** | .711** | .557** | .655** | .650** |
S | .000 | .000 | .000 | .000 | .000 | .000 | ||
N | 163 | 163 | 163 | 163 | 163 | 163 | 163 | |
BI | R | .724** | 1 | .690** | .701** | .764** | .744** | .592** |
S | .000 | .000 | .000 | .000 | .000 | .000 | ||
N | 163 | 163 | 163 | 163 | 163 | 163 | 163 | |
E | R | .685** | .690** | 1 | .750** | .662** | .675** | .572** |
S | .000 | .000 | .000 | .000 | .000 | .000 | ||
N | 163 | 163 | 163 | 163 | 163 | 163 | 163 | |
I | R | .711** | .701** | .750** | 1 | .672** | .694** | .568** |
S | .000 | .000 | .000 | .000 | .000 | .000 | ||
N | 163 | 163 | 163 | 163 | 163 | 163 | 163 | |
C | R | .557** | .764** | .662** | .672** | 1 | .727** | .490** |
S | .000 | .000 | .000 | .000 | .000 | .000 | ||
N | 163 | 163 | 163 | 163 | 163 | 163 | 163 | |
B | R | .655** | .744** | .675** | .694** | .727** | 1 | .563** |
S | .000 | .000 | .000 | .000 | .000 | .000 | ||
N | 163 | 163 | 163 | 163 | 163 | 163 | 163 | |
U | R | .650** | .592** | .572** | .568** | .490** | .563** | 1 |
S | .000 | .000 | .000 | .000 | .000 | .000 | ||
N | 163 | 163 | 163 | 163 | 163 | 163 | 163 | |
**. The correlation is significant at a confidence (double measure) of 0.01. | ||||||||
According to the above analysis, all hypotheses in this study are valid.
(1) According to the results of this study, when brand marketing is enhanced, other relevant variables related to experience perception generally increase as well. Therefore, when designing network marketing programs, enterprise managers and platform merchants can carry out precise marketing according to the experience and perception characteristics of college students to give full play to users’ dependence on the platform and interest in personalized products, increase college students’ interest in social media e-commerce, and ultimately transform into solid purchasing power.
(2) When merchants recommend product information, they should pay attention to the influence of authenticity and after-sales service guarantee on consumers, thoroughly select the influence of good quality and service on product promotion and promote the rapid spread of Internet word-of-mouth. Moreover, it encourages more consumers to find a sense of belonging and identity in the ultimate service experience.
(3) Compared with traditional e-commerce, social e-commerce has the support of massive information, and platform enterprises and merchants should pay more attention to the urgent needs of college students’ social e-commerce users. Based on paying attention to the fundamental value of products, platforms, and merchants should also timely and fully consider the consumption level of college students and recommend product information from the perspective of low price and high quality so that more college students can trust and rely on products and product brands in the process of social purchase and form higher user stickiness. Let consumers emotionally and psychologically accept the products the platform and merchants recommended.
4. Discussion
In the process of this research, the author tried his best to collect and review the relevant literature and materials. Although the research has enriched the theoretical research on relevant issues and has specific theoretical research significance and practical value, the research still needs to improve. It needs to be improved due to the limitations of the author’s theoretical research ability and objective conditions. In the future, relevant research can be combined with relevant research situations and methods to improve the conclusions of this study further.
(1) Limitations of measurement methods and data collection, experimental methods can be explored in the future. This study adopts a situational questionnaire to measure. Although the variables involved in the questionnaire refer to scales widely used at home and abroad, there may still be some cases in which the scale does not match well with the social e-commerce context, the respondent’s environment, and the gender limitation of questionnaire filling. In addition, practical questionnaire screening items and reverse questions are set in the questionnaire to screen out invalid data. However, there are still problems, such as the quality of questionnaire data collection and insufficient sample audience, which may lead to measurement errors and affect the universality of this study. Therefore, the experimental method can be explored for further research by controlling some variables in the future.
(2) Consumer purchase intention in social e-commerce is still very complex, and there are still limitations in the interaction between social media e-commerce platforms and users. In addition, other variables may affect consumers’ purchase intention. Therefore, in the follow-up research, other variables such as celebrity effect, consumption habits, and consumer psychology, as well as cultural dimension variables such as uncertainty avoidance and perception of face acquisition in the Chinese context, can be introduced into the social e-commerce research context to explore further the influence of individual emotional variables and cultural dimension variables on social e-commerce users’ purchasing behavior.
(3) The difference in the influence of product type needs to be paid attention to. In the future, product type variables can be considered to study further the influence of online word-of-mouth communication from different social relationship sources. Product types can be divided into two types according to consumer needs. Practical products are designed to protect consumers’ basic needs and pay attention to personal economic gains and losses. In contrast, hedonic products are designed to meet consumers’ personal product experience and emotional needs. Therefore, the future can focus on the social e-commerce network word-of-mouth communication of different product types through solid relationships, weak relationships, and quasi-social relationships to match the influence of different product types of information dissemination change. This also needs to be verified by subsequent studies.
5. Conclusion
Through the digital consumption model based on the era of social networking proposed by the China Internet Network Information Center, combined with the unique social attributes of short video platforms, this article takes the duration of use, brand promotion, and brand interaction as the independent variables of this study, to influence the experience perception, Interest, and interaction, contact and communication of college students. Stimulate the willingness to buy, and the resulting purchasing behavior is used as an intermediary mechanism. The purchasing behavior generated by college students under the influence of TikTok’s usage time, brand promotion, and brand interaction is used as a dependent variable. It builds a theoretical conceptual model between the use time of short videos, brand promotion, and brand interaction and the purchasing behavior of college students. Through the review and combing of previous studies, taking college students as the research object of this article, 163 valid sample data are collected through the questionnaire star of the online questionnaire platform, and all the research assumptions of this article are verified through spss analysis. The results show that when brand marketing is strengthened, these variables are usually It will also be enhanced. Brand interaction and contact and communication (0.764) has the highest correlation, which may mean that the more frequent the interaction between consumers and the brand, the more frequent their contact and communication with the brand; the correlation between experience perception and Interest and interaction is the highest (0.750), indicating that the quality of consumers’ experience to them Interest and interaction behavior have a significant impact; the correlation between purchasing behavior and related communication (0.727) and brand interaction (0.744) is the highest, indicating that the more interactions and communication consumers have with brands, the more frequent purchasing behaviors.
The contribution of this research is reflected in theory and practice. From a theoretical point of view, unlike the existing research, this article focuses on the consumption group of college students, builds a theoretical, conceptual model between the duration of short video use, brand promotion, and brand interaction, and the purchasing behavior of college students enriches the previous single research factors, and further explores the marketing of social media. The role path of the model on the psychological impact of consumers. It has deepened research into the influence of social e-commerce communication and enriched the research perspective on the impact of social e-commerce marketing behavior on consumer behavior. From a practical point of view, it is helpful for e-commerce and enterprises on social platforms to understand the internal needs of consumers. By creating a good brand image and interacting with consumers, they integrate consumption into social networking, pay attention to the internal psychological needs of consumers to achieve emotional resonance with consumers and accelerate the sale of goods.
Authors Contribution
All the authors contributed equally and their names were listed in alphabetical order.
References
[1]. Yang, S., Zhao, Y., & Ma, Y. (2019, July). Analysis of the reasons and development of short video application-Taking Tik Tok as an example. In Proceedings of the 2019 9th International Conference on Information and Social Science (ICISS 2019), Manila, Philippines (pp. 12-14).
[2]. Zhang, Y. (2019, February). Research on Micro-marketing Strategy of China Time-honored Brands. In 2019 4th International Conference on Financial Innovation and Economic Development (ICFIED 2019). Atlantis Press.
[3]. Mcquail, D. (2009). With the benefit of hindsight: reflections on uses and gratifications research. Critical Studies in Media Communication, 1(2), 177-193.
[4]. Zhaoying G. The Influence of Short Video Platform on Audience Use and Reflections—Take TikTok as an example[J]. Academic Journal of Humanities & Social Sciences, 2021, 4(4): 67-70.
[5]. Scott, D.M. 2020. The New Rules of Marketing & PR. 7th ed. John Wiley & Sons.
[6]. Azpeitia J. Social media marketing and its effects on TikTok users[J]. 2021.
[7]. G. Qingguang, Communication Course, Renmin University of China Press, 2011.
[8]. Wang, Y., Liu, S., Li, S., Duan, J., Hou, Z., Yu, J., & Ma, K. (2019). Stacking-Based Ensemble Learning of Self-Media Data for Marketing Intention Detection. Future Internet, 11(7), pp.155.
[9]. Tangsupwattana, W. and Liu, X. ”Effect of emotional experience on symbolic consumption in Generation Y consumers”, Marketing Intelligence & Planning, Vol. 36 No. 5, pp. 514-527. https://doi.org/10.1108/MIP-11-2017-0316
[10]. Wu Yuejia .Research on social media marketing strategies for online education Company A based on the SICAS model.Dissertation Submitted to Zhejiang Gongshang University for Master of Business Administration.p9-10.2021
Cite this article
Bi,R.;Feng,Y.;Ma,J. (2023). The Influence of Short Videos on College Students’ Purchasing Behavior. Communications in Humanities Research,19,42-53.
Data availability
The datasets used and/or analyzed during the current study will be available from the authors upon reasonable request.
Disclaimer/Publisher's Note
The statements, opinions and data contained in all publications are solely those of the individual author(s) and contributor(s) and not of EWA Publishing and/or the editor(s). EWA Publishing and/or the editor(s) disclaim responsibility for any injury to people or property resulting from any ideas, methods, instructions or products referred to in the content.
About volume
Volume title: Proceedings of the 2nd International Conference on Interdisciplinary Humanities and Communication Studies
© 2024 by the author(s). Licensee EWA Publishing, Oxford, UK. This article is an open access article distributed under the terms and
conditions of the Creative Commons Attribution (CC BY) license. Authors who
publish this series agree to the following terms:
1. Authors retain copyright and grant the series right of first publication with the work simultaneously licensed under a Creative Commons
Attribution License that allows others to share the work with an acknowledgment of the work's authorship and initial publication in this
series.
2. Authors are able to enter into separate, additional contractual arrangements for the non-exclusive distribution of the series's published
version of the work (e.g., post it to an institutional repository or publish it in a book), with an acknowledgment of its initial
publication in this series.
3. Authors are permitted and encouraged to post their work online (e.g., in institutional repositories or on their website) prior to and
during the submission process, as it can lead to productive exchanges, as well as earlier and greater citation of published work (See
Open access policy for details).
References
[1]. Yang, S., Zhao, Y., & Ma, Y. (2019, July). Analysis of the reasons and development of short video application-Taking Tik Tok as an example. In Proceedings of the 2019 9th International Conference on Information and Social Science (ICISS 2019), Manila, Philippines (pp. 12-14).
[2]. Zhang, Y. (2019, February). Research on Micro-marketing Strategy of China Time-honored Brands. In 2019 4th International Conference on Financial Innovation and Economic Development (ICFIED 2019). Atlantis Press.
[3]. Mcquail, D. (2009). With the benefit of hindsight: reflections on uses and gratifications research. Critical Studies in Media Communication, 1(2), 177-193.
[4]. Zhaoying G. The Influence of Short Video Platform on Audience Use and Reflections—Take TikTok as an example[J]. Academic Journal of Humanities & Social Sciences, 2021, 4(4): 67-70.
[5]. Scott, D.M. 2020. The New Rules of Marketing & PR. 7th ed. John Wiley & Sons.
[6]. Azpeitia J. Social media marketing and its effects on TikTok users[J]. 2021.
[7]. G. Qingguang, Communication Course, Renmin University of China Press, 2011.
[8]. Wang, Y., Liu, S., Li, S., Duan, J., Hou, Z., Yu, J., & Ma, K. (2019). Stacking-Based Ensemble Learning of Self-Media Data for Marketing Intention Detection. Future Internet, 11(7), pp.155.
[9]. Tangsupwattana, W. and Liu, X. ”Effect of emotional experience on symbolic consumption in Generation Y consumers”, Marketing Intelligence & Planning, Vol. 36 No. 5, pp. 514-527. https://doi.org/10.1108/MIP-11-2017-0316
[10]. Wu Yuejia .Research on social media marketing strategies for online education Company A based on the SICAS model.Dissertation Submitted to Zhejiang Gongshang University for Master of Business Administration.p9-10.2021