


1. Introduction
The issue of gender inequality has garnered significant attention in recent years as global efforts to promote gender equality continue to gain momentum. Scholars have extensively examined the causes, manifestations, and consequences of gender inequality, sparking widespread discussion and debate across various fields. Despite the implementation of policies and laws aimed at addressing this issue, women around the world continue to face unequal discrimination rooted in historical biases that are likely to persist into the foreseeable future [1]. Evidence from Sub-Saharan Africa suggests that disparities in educational opportunities and societal factors such as political representation and labor participation heavily favor males [2]. Existing research strongly indicates that gender inequality negatively impacts living standards, hinders productivity, fuels social conflicts, and ultimately undermines economic efficiency. Furthermore, biases within economic, social, cultural, and legal systems perpetuate gender disparities while impeding the development of effective legal frameworks [3], highlighting the urgent need for comprehensive research on the root causes of gender inequality. This effort is essential for achieving meaningful progress towards gender equality.
The current research predominantly focuses on the influence of social norms on gender inequality. For instance, entrenched cultural practices and socialization contribute to perpetuating gender inequality in rural Ghana [4]. Specifically, patriarchal social structures are prevalent in East Asia, South Asia, and Middle and North Africa, as evidenced by customs such as patrilineal inheritance of family name and responsibility for elderly care falling on sons, as well as limited job opportunities for women leading to their engagement in unpaid and informal work [5,6].
However, it is necessary to note that the pattern of social norms is deeply ingrained in an individual’s ideology, making it difficult to alleviate and ultimately eliminate the adverse impact of conventional norms on gender disparity within a certain period of time. In other words, backward social norms can be likened to a "chronic disease", and shaking its secular and historic nature may incur much higher costs than anticipated, especially in underdeveloped countries and regions. Therefore, the idea of promoting gender equality through reshaping social norms is unrealistic and inefficient.
Hence, it is essential to explore other influential factors of gender inequality that are more suitable for policy intervention in order to provide potential solutions for addressing gender inequality. Public education, which can be demonstrated through various indicators such as expected years of schooling and government expenditure on education, emerges as a critical and actionable factor. Therefore, examining the impact of public education on the level of gender inequality holds significant importance.
Public education, encompassing schooling, higher education, and vocational training provided by the government, yields significant individual and societal benefits and has long been a worthwhile area of government investment. Previous research on public education covers various aspects, with its most evident benefit being its impact on personal development. According to Marginson, higher education enhances students” cognitive and social abilities, fostering agency, confidence, knowledge, and imagination [7]. This results in a more intellectually astute, well-informed, and self-assured graduate population within a society where socially embedded human agency is widely distributed. This implies that public education can enhance individual cognitive abilities, leading to a more objective and rational perspective on gender. Highly educated individuals also have greater employment prospects. For example, Mitra asserts that high school graduation has historically been a significant signal for employers of an individual’s readiness for the workforce [8]. Even today, high school dropouts are more than twice as likely to be unemployed compared to college attendees. With the widespread availability of public education, women now have increased access to higher education and opportunities to develop their skills, thereby improving their competitiveness in the job market. Women with fulfilling careers and independent capabilities can break free from reliance on men. From a non-economic standpoint, research indicates a correlation between higher educational attainment and lower crime rates. When young people have access to tertiary education and avoid unemployment or idleness, their likelihood of engaging in criminal activities decreases [9]. Consequently, incidents of prejudice-motivated violence against women and girls are expected to decrease.
Accordingly, this paper investigates what will happen to the national level of gender inequality when the educational level of the whole country improves. By selecting three indicators, Average Years of Schooling (AYS), Gross Enrollment Ratio in Primary Education (ERP), and Total General Government Expenditure on Education (TGE), for the national educational level and Under Five Child Mortality Sex Ratio (CMSR) for the level of gender inequality, this paper constructs regression models to test the correlation between public education and gender inequality, then proposes some policy implications based on empirical results. Hopefully, this research could contribute to the promotion of gender equality worldwide.
For reminder of the structure: Section 2 examines the existing literature concerning public education and gender inequality, addressing their gap and discussing the contribution of this paper. Section 3 outlines the data used and measurement of variables. Section 4 presents the empirical analysis. The final section concludes and proposes potential policy implications.
2. Literature review
Existing studies concerning both public education and gender inequality can generally be categorized into two types. The first type, which is the majority, focuses on investigating gender inequality within the education system, manifesting as unequal distribution of education resources between girls and boys, abuse and bullying of school girls, etc. Many kinds of literature suggest that educational resources tend to lean towards boys, including a higher possibility of being enrolled, biased curriculum provision, and so on. And this is a global phenomenon. For instance, Jacobs analyzes existing papers and came to the conclusion that gender disparity is more clear-cut in education than in other aspects like income, job opportunities, and health care [10].
The second type regards public education as a key influencing factor of gender inequality. However, their findings about whether enhancing educational level hastens or impedes the amelioration of gender inequality is still in debate. On the one hand, some suggest that a low educational level, manifesting as a lack of access to public education, imperfection of the education system, etc., is responsible for gender inequality. For example, according to Evertsson et al., owing to the high employment rate and ever-higher women’s educational level, as education improves, gender disparity in labor participation, work hours, and housework are not as severe as before [11]. Particularly, in Vietnam and India, illiterate women have a higher preference for sons, while employed women tend to philosophically narrow the gap between girls and boys because they have altered the belief that only men can create social and economic value and begin to perceive men and women as equally important in providing family economic security [12,13]. Meanwhile, on the other hand, Ritchie and Roser state that higher educational levels and increased participation of women in healthcare and the labor force give rise to a decrease in fertility rates. Subsequently, due to what they call "the fertility squeeze", a lower fertility rate leads to higher son preference among parents [14]. That is to say, a higher educational level may also negatively impact gender equality, which is contrary to our original hypothesis. Therefore, the exact relationship between public education and gender inequality remains to be studied.
Furthermore, the majority of literature in the second category examines gender inequality through specific societal aspects such as income, job opportunities, and political rights. Apart from institutional factors, these issues can be attributed to ingrained stereotypes and prejudices against females, which are more directly reflected in parental gender preferences and the number of missing women. Existing research focusing on these indicators primarily remains at a micro level. Kane concludes that education has a significantly positive impact on an individual’s awareness of gender equality [15]. This impact is more pronounced in women than in men, indicating that higher levels of education lead to greater awareness of gender equality for women.
Despite the social norm being a hard-to-change factor, it is still playing an important role in affecting gender inequality, which cannot be ignored. Therefore, this paper also takes social norms into consideration, choosing religion as a representative of social norms, which is an indicator that is easier to measure.
There is a limited number of studies on the relationship between religion and gender inequality. According to Glas et al., while religious service attendance, textualism, and devotion tend to decrease support for gender equality, the salience of religious beliefs in life choices has no singularly negative impact [16]. But in another literature, Page et al. argue that some forms of institutionalized religion undoubtedly contribute to the perpetuation of gender inequality [17]. Although the opinions are under debate in the limited literature, it is explicit that religion is an influencing factor of gender inequality, and the specific relationship between them still needs further exploration.
3. Methodology
3.1. Model specification
As proved above, public education is thought to be a key factor of gender equality, and TGE (total general government expenditure on education), AYS (average years of schooling), and ERP (gross enrollment ratio in primary education) are essential indicators of the national educational level.
There are data of TGE, AYS, ERP and CMSR for eight countries over 22 years, 1990-2021. Regarding TGE, AYS, ERP as the explanatory variables and CMSR as the dependent variable, we employed three distinct single-factor models to separately measure the specific impact of each explanatory variable on the sole dependent variable.
We use regression model to investigate the role of TGE in CMSR as equation 1:
Where
By means of the first model, we aim to explore the exact impact of the change of TGE on CMSR and the extent to which we can trust the regression results. Under the null hypothesis, we suppose the coefficient equals zero, suggesting that the nexus is not obvious enough to be reflected and predicted. By judging the p-value, if it is smaller than 0.1 (or 0.05 & 0.01), then we can conclude that the differentiation between real data and the null hypothesis is statistically significant at the level of 10% (or 5% & 1%), signifying high prominence of the coefficient of
In the same light, we construct another two single-factor models to respectively illustrate the impact of AYS and ERP on CMSR. The logic behind those two models is similar with the former one.
We use regression model to investigate the role of AYS in CMSR as equation 2:
Where
We also use regression model to investigate the role of ERP in CMSR as equation 3:
Where
Among all elements,
To exactly depict the function of solitary elements on public education, we subtract models that examine interactive impacts between two explanatory variables, which may largely complicate the regression procedure and result processing.
3.2. Data source
The range of both dependent and independent variables spans from 1990 to 2021 and is sourced from multiple reputable organizations. The data for the variables "total general government expenditure on education as a share of GDP" "average years of schooling," "gross enrollment ratio in primary education," and "under-five mortality rate of males and females" is collected by World Bank Education Statistics (EdStats), United Nations Development Programme (UNDP), United Nations Educational, Scientific and Cultural Organization (UNESCO), and UN Inter-agency Group respectively. The data for the index "gross national income (GNI) per capita" is obtained from the World Bank, while the data for the index "percentage of atheists in population" is gathered by Pew Research Center.
3.3. Key variables
3.3.1. Measure of gender inequality
When choosing an index for the dependent variable, gender inequality, we intend to follow a more natural and traceable perspective that distinguishes from disparity in job opportunities, income, and other manifestations of gender inequality, aiming to study gender inequality from the most fundamental angle and at the very beginning of a lifetime. By dividing the under-five mortality rate of males by that of females, we get the gender reproductive proxy — the child mortality sex ratio (CMSR) as the dependent variable. This index evaluates gender inequality, particularly from the view of gender reproductive health, which is one of three main dimensions of the Gender Inequality Index (GII), affected by patriarchal and sexist patterns. Notably, if the two genders are treated equally without discrimination, the male mortality rate would be slightly higher than that of females, which is proved from the physiological view: males have one X chromosome and one Y chromosome and tend to have high testosterone levels, contributing to their suppressed immunity and legacy diseases [18][19]. This explains why the ideal male-to-female under-five mortality ratio is usually above one. Moreover, the ratio varies among different countries and has been proven to be strongly correlated with the level of national gender inequality [20]. Thus, we ultimately choose this index to measure gender inequality in this paper.
3.3.2. Measure of public education
This paper tries to integrate multiple measures to evaluate different manifestations of public education as explanatory variables. Three variables are considered: total general government expenditure on education given as a share of GDP (TGE), average years of schooling (AYS), and gross enrollment ratio in primary education (ERP). They have been used as proxies for educational levels in a wide range of studies. In this study, TGE, as its name implies, comprises all levels of government and all stages of education. It also needs to be noted that the value of ERP could be larger than one, for some children may enter primary school later than expected or go through retardation for some reason. Unfortunately, there is a data deficiency in some countries, especially when dealing with TGE and ERP. The specific missing years will be displayed on the table note.
3.4. Sample
Taking the differences among countries into consideration, we select and categorize sample countries based on the economy index, gross national income (GNI) per capita, and the religion index, percentage of atheists in the population. Exact statistics are shown in Table 1.
|
(1)GNI per capita, Atlas method (U.S.$) |
(2) Atheists in the population (%) |
|
|
Japan USA China Mexico Mongolia India Mozambique Ethiopia |
41,085.45 51,510.45 5,252.25 9,297.73 2,380.00 1,239.09 495.00 423.64 |
57.00 16.40 52.20 8.40 40.60 0.24 17.90 0.06 |
Notes: GNI per capita is the average of the recent 22 years, from 2000 to 2021. Atheists in the population is the data for 2010. Data on GNI per capita is from the World Bank (2024), and data on atheism is from the Pew Research Center (2012).
Considering the economic development level, we adopt the standard for classification proposed by the World Bank. Countries with GNI per capita higher than $12,476 are categorized as high-income countries. Countries with GNI per capita ranging from $4,036 to $12,475 are categorized as middle-high-income countries. Countries with GNI per capita ranging from $1,026 to $4,035 are categorized as middle-low-income countries. Countries with GNI per capita lower than $1,025 are categorized as low-income countries. The values of GNI per capita in Table 1 are the average of 22 years, from 2000 to 2021, aiming to impair the deviation between the average of fast-growing economies in developing countries and the average of stable economies in developed countries. Based on the values and the standard, we choose Japan and the US, China and Mexico, India, and Mongolia, and Ethiopia, and Mozambique as four groups of sample countries, representing countries of different economic development levels.
Within each group, two countries respectively represent countries of high and low religious levels. This is measured by the proportion of atheists in the population, reported by the Pew Research Center in 2012 using the data of 2010. Previous research indicates that the most distinct difference is not between the three largest faiths—Christianity, Islam, and Hinduism—but between the religious and the non-religious. The more non-religious people a country owns, the more gender equal that country tends to be [21]. Therefore, in this paper, we choose the proportion of atheists in the population to evaluate how important religion is to a country rather than considering the number of adherents of a particular religion. Meanwhile, we also take government interventions into consideration. For instance, Indonesia is a country where citizens are forced by law to believe in certain religions compulsorily. Hence, the proportion of atheists in Indonesia should be zero theoretically. In order to exclude the influence of relevant policies, none of the sample countries have legislation to oblige or forbid citizens to practice religion. Therefore, for selected countries, we default that citizens are unconstrained to decide whether or not to believe in any religion.
3.5. Statistical analysis
Firstly, Figure 1, “Total General Government Expenditure on Education,” seems to be somehow chaotic. This is because of the lack of data in certain years and countries, especially in India and Mozambique. According to the figure, Japan is the country with the most stable level of TGE, which fluctuates at 3-4%. This means its government spending on education rises steadily with its GDP. In contrast, TGE of the US fell obviously from 2009 to 2016, which is presumed to be the delayed effect of the 2008 financial crisis. Other countries are in intensive fluctuation.
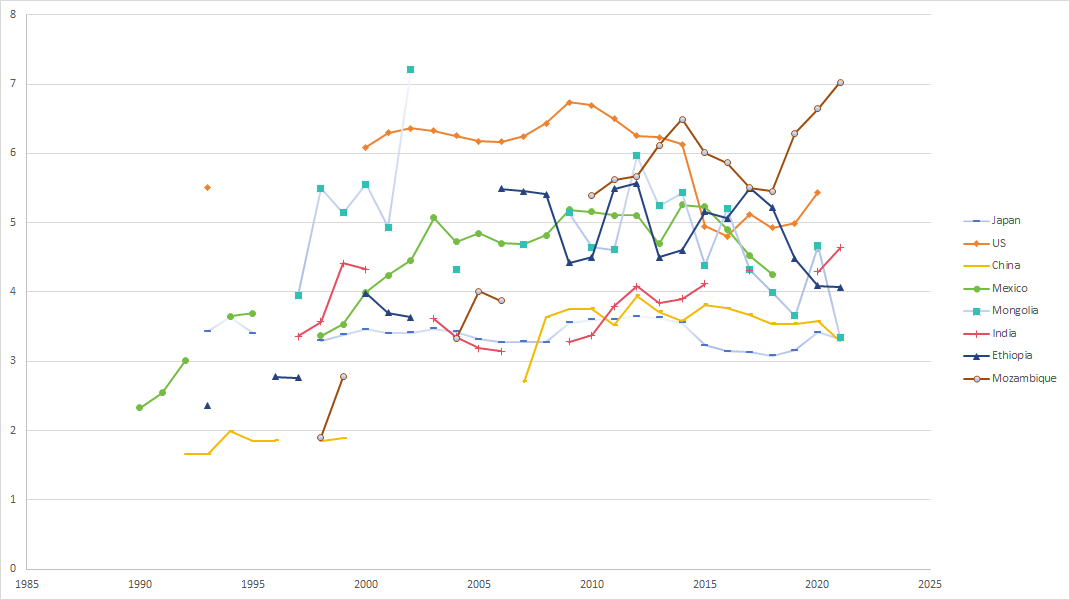
Notes: There is missing data in Japan (1990-1992), United States (1990-1992, 1994-1999, 2021), China (1990-1991, 1997, 2000-2006), Mexico (1993, 1996-1997, 2019), Mongolia (1990-1996, 2003, 2005-2006, 2008), India (1990-1996, 2001-2002, 2007-2008, 2016, 2018-2019), Mozambique (1990-1997, 2000-2003, 2007-2009), Ethiopia (1990-1992, 1994-1005, 1998-1999, 2003-2005).
Figure 1: Total general government expenditure on education
Secondly, in Figure 2, “Average Years of Schooling”, it is clear that Japan and the US change very slightly during the 22 years because their levels of AYS are already high, stabilizing at around 13 and 12 years. Other countries steadily increase at almost the same rate, 3-4 years in 22 years, except that Ethiopia only increase by no more than 1 year. Notably, Mexico has experienced a sudden decrease since 2018, and the advance of Mozambique is outstanding since its initial level of AYS in 1990 was very low and almost tripled in 22 years.
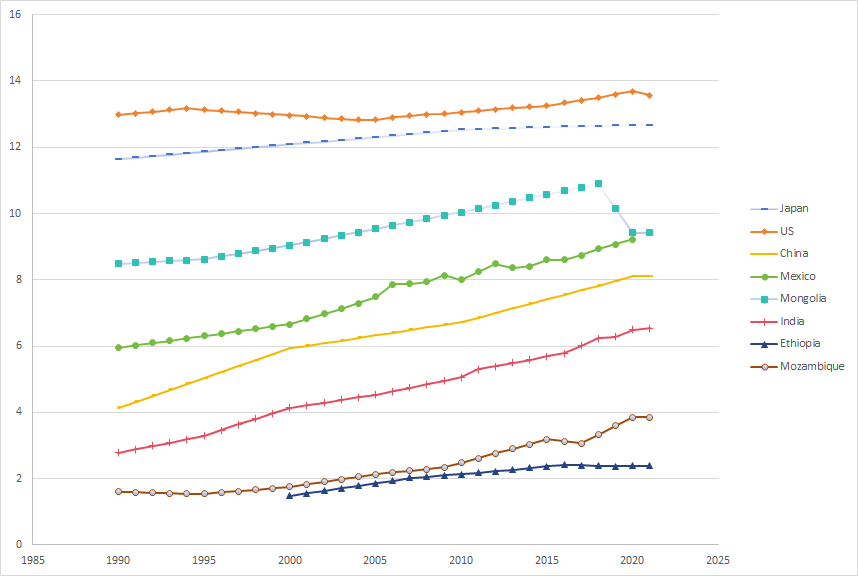
Notes: There is missing data in Ethiopia (1990-1999).
Figure 2: Average years of schooling
Thirdly, in Figure 3 “Gross Enrollment Ratio in Primary Education”, aggressive investment on education from Mozambique and Ethiopia brings remarkable returns. They achieved significant progress in primary education enrollment and successfully raised their level of ERP above 1 by 2021. Countries of the high-income and middle-high-income groups generally stay above 1 in 22 years, signaling that they have constructed a well-developed education system and corresponding policies to eliminate illiteracy in the 1990s.
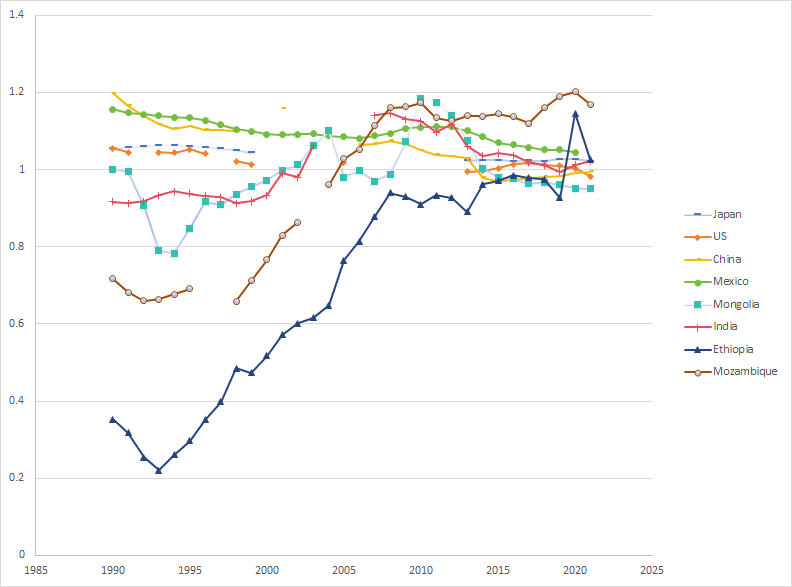
Notes: There is missing data in Japan (2000-2012), United States (1992, 1997, 2000-2004, 2006-2012), China (1999-2000, 2002-2005), Mexico (TGE: 1993, 1996-1997, 2019), India (2004-2006), Mozambique (1996-1997, 2003).
Figure 3: Gross enrollment ratio in primary education
Lastly, Figure 4 shows countries’ development trends of child mortality sex ratio from 1990 to 2021. Clearly, India is the only country with the ratio kept under 1 all the time, which means that girls have more possibility to die than boys under five years old, despite of their physiological advantage in survival. This reveals extreme gender inequality in India, with a huge amount of girls dying unnaturally. Meanwhile, in high-income countries, Japan and the US particularly in this circumstance, their levels of CMSR tend to decrease, while in other income groups, CMSR generally increase or keep stable.
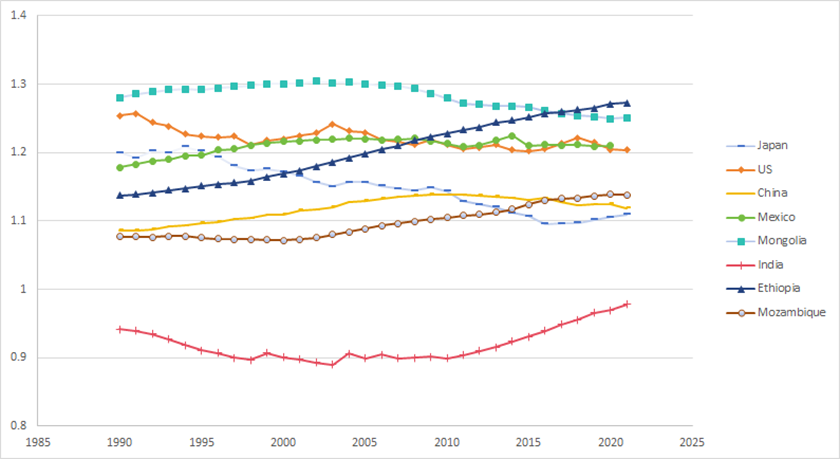
Table 2 below presents specific statistics of 4 variables in 8 countries.
|
Mean |
Std dev. |
Max |
Min |
Obs. |
|
|
Panel A: Japan (High-income, Low-religion) (1)Total general government expenditure on education (2)Average years of schooling (3)Gross enrollment ratio in primary education (4) Child mortality sex ratio |
3.39 12.27 1.04 1.15 |
0.16 0.34 0.02 0.04 |
3.65 12.67 1.06 1.21 |
3.08 11.64 1.02 1.10 |
27 32 19 32 |
|
Panel B: USA (High-income, High-religion) (1)Total general government expenditure on education (2)Average years of schooling (3)Gross enrollment ratio in primary education (4)Child mortality sex ratio |
5.93 13.12 1.02 1.22 |
0.62 0.23 0.02 0.01 |
6.74 13.68 1.05 1.26 |
4.81 12.82 0.98 1.20 |
22 32 18 32 |
|
Panel C: China (Middle-high-income, Low-religion) (1)Total general government expenditure on education (2)Average years of schooling (3)Gross enrollment ratio in primary education (4) Child mortality sex ratio |
3.02 6.31 1.06 1.12 |
0.88 1.14 0.07 0.02 |
3.94 8.11 1.19 1.14 |
1.65 4.14 0.97 1.09 |
22 32 26 32 |
|
Panel D: Mexico (Middle-high-income, High-religion) (1)Total general government expenditure on education (2)Average years of schooling (3)Gross enrollment ratio in primary education (4) Child mortality sex ratio |
4.36 7.47 1.10 1.21 |
0.83 1.05 0.03 0.01 |
5.26 9.22 1.16 1.22 |
2.33 5.95 1.05 1.18 |
27 31 31 31 |
|
Panel E: Mongolia (Middle-low-income, Low-religion) (1)Total general government expenditure on education (2)Average years of schooling (3)Gross enrollment ratio in primary education (4) Child mortality sex ratio |
4.85 9.53 0.99 1.28 |
0.86 0.75 0.09 0.02 |
7.21 10.90 1.19 1.30 |
3.34 8.49 0.78 1.25 |
21 32 32 32 |
|
Panel F: India (Middle-low-income, High-religion) (1)Total general government expenditure on education (2)Average years of schooling (3)Gross enrollment ratio in primary education (4) Child mortality sex ratio |
3.81 4.63 1.01 0.92 |
0.47 1.13 0.08 0.02 |
4.64 6.53 1.15 0.98 |
3.14 2.78 0.91 0.89 |
18 32 29 32 |
|
Panel G: Mozambique (Low-income, Low-religion) (1)Total general government expenditure on education (2)Average years of schooling (3)Gross enrollment ratio in primary education (4) Child mortality sex ratio |
5.17 2.33 0.97 1.10 |
1.46 0.73 0.21 0.02 |
7.03 3.86 1.20 1.14 |
1.90 1.54 0.66 1.07 |
17 32 29 32 |
|
Panel H: Ethiopia (Low-income, High-religion) (1)Total general government expenditure on education (2)Average years of schooling (3)Gross enrollment ratio in primary education (4) Child mortality sex ratio |
4.46 2.09 0.70 1.20 |
0.97 0.30 0.28 0.05 |
5.57 2.43 1.15 1.27 |
2.35 1.48 0.22 1.14 |
22 22 32 32 |
Notes: All values in the table are averages of available data for each country from 1990 to 2021. Total general government expenditure on education includes all levels of government and all levels of education, given as a share of GDP.
4. Empirical analysis
To enhance the typicality and reliability of final results, two specific countries are selected for each income level group, left ones representing countries with relatively low religious levels and right ones representing countries with high religious levels.
4.1. Results
In Table 3, we estimate the relationship between TGE and CMSR. Columns (1) & (2) shows a large significance level of the impact of TGE on CMSR in both Japan and the USA, which is no less than 10%, implying that, in high-income countries, TGE appears uncorrelated with CMSR and the increase or decrease of educational expenditures nearly has nothing to do with their levels of gender inequality. Column (3) & (4) indicates that the effect of TGE on CMSR is significantly positively related to CMSR at 1% significant level in middle-high-income countries, and it is also the case for low-income countries in column (7) & (8) where the estimated coefficient is also prominent at 1% significant level. Moreover, column (5) & (6) reports the positive relationship between TGE and CMSR too. However, their significant levels are relatively higher. In column (5), for example, the estimated coefficient is 0.011, meaning that a 1% increase in TGE is associated with 1.1% increase in CMSR and the significant level is 10%. Column (4) yields analogous results where the regression of India demonstrates the positive correlations between TGE and CMSR at 5% significant level, and the estimated coefficient 0.037 reveals that if there is a 1% increase in TGE, then the level of CMSR will be improved by 3.7%. Accordingly, regression results of countries in other income level groups embody the phenomenon that the trends of TGE and CMSR share the same direction, which means the increase of educational expenditures goes hand in hand with the improvement of gender equality.
When it comes to average years of schooling, all countries in all income level groups display a strong relevance between AYS and CMSR. In Table 4, we estimate the nexus between AYS and CMSR. Column (1) shows that AYS is significantly positively related to CMSR in Japan at 1% significant level. The estimated coefficient is -0.102, suggesting that a 1-year increase in AYS is connected with 10.2% decrease in CMSR. The US shares the same trend. Judging from column (2), the estimated coefficient is also negative, at -0.030, which means that if there is generally a year more education, then CMSR will drop by 3%. It is also of note that in the US, the correlation is less prominent, at 5% significant level. Columns (3) & (4) and columns (7) & (8) also have similar patterns, all of which show a positive relationship between AYS and CMSR at a 1% significant level. However, column (5) reports a dissimilar result, where the effect of AYS on CMSR is below zero at a 1% significant level, signaling that a 1-year improvement in schooling leads to a 1.5% decline in CMSR. Besides, despite that column (6) shows the same positive nexus, the significant level is relatively high, at 10%, compared to others. In brief, the nexus between AYS and CMSR is below zero for high-income countries, while others are generally above zero, except for Mongolia where the tie is negative. Thus, due to the distinct link, AYS can be measured as one of the main explanatory variables in the realistic analysis. When mentioning the specific impact of AYS on CMSR, we spot that the absolute values of the coefficient in high-income and low-income countries are apparently larger than the middle ones, signifying that the effect of AYS on gender equality is more evident in high-income and low-income countries. Furthermore, the data of AYS is the most holistic one compared to other explanatory variables (TGE and ERP), covering the overall period of 1990-2021, except Mexico who has one year of missing data.
The last explanatory variable, ERP, also counts a lot. Table 5 shows the relationship between ERP and CMSR. Column (5) & (6) demonstrates a relatively high significant level, which is larger than 10%. It can be concluded that only in middle-low-income countries, the change of enrollment ratio is irrelevant to the change of child mortality sex ratio. Columns (1) & (2) and columns (7) & (8) indicate that ERP is significantly positively related to CMSR at a 1% significant level. On the contrary, columns (3) & (4) estimate the negative relationship both at a 1% significant level. In the case of China, the estimated coefficient is -0.206, which means that a 100% increase in ERP is associates 20.6% decrease in CMSR, and for Mexico, the coefficient is -0.277, implying that if ERP doubles, CMSR will go down by 27.7%.
|
High Income |
Middle-high Income |
Middle-low Income |
Low Income |
|||||
|
Explanatory variable |
Japan (1) |
US (2) |
China (3) |
Mexico (4) |
Mongolia (5) |
India (6) |
Mozambique (7) |
Ethiopia (8) |
|
TGE |
0.077 (0.038) |
0.004 (0.004) |
0.019*** (0.002) |
0.012*** (0.002) |
0.011* (0.005) |
0.037** (0.010) |
0.014*** (0.002) |
0.028*** (0.007) |
|
R2 |
0.109 |
-0.003 |
0.833 |
0.636 |
0.176 |
0.433 |
0.800 |
0.418 |
|
Number of observations |
27 |
22 |
22 |
27 |
21 |
18 |
17 |
22 |
|
High Income |
Middle-high Income |
Middle-low Income |
Low Income |
|||||
|
Explanatory variable |
Japan (1) |
US (2) |
China (3) |
Mexico (4) |
Mongolia (5) |
India (6) |
Mozambique (7) |
Ethiopia (8) |
|
AYS |
-0.102*** (0.006) |
-0.030** (0.010) |
0.012*** (0.002) |
0.006*** (0.002) |
-0.015*** (0.003) |
0.010* (0.004) |
0.032*** (0.001) |
0.107*** (0.005) |
|
R2 |
0.914 |
0.199 |
0.643 |
0.295 |
0.364 |
0.170 |
0.954 |
0.965 |
|
Number of observations |
32 |
32 |
32 |
31 |
32 |
32 |
32 |
22 |
|
High Income |
Middle-high Income |
Middle-low Income |
Low Income |
|||||
|
Explanatory variable |
Japan (1) |
US (2) |
China (3) |
Mexico (4) |
Mongolia (5) |
India (6) |
Mozambique (7) |
Ethiopia (8) |
|
ERP |
2.598*** (0.121) |
0.610*** (0.114) |
-0.206*** (0.040) |
-0.277*** (0.054) |
-0.023 (0.036) |
-0.053 (0.061) |
0.096*** (0.011) |
0.155*** (0.008) |
|
R2 |
0.962 |
0.621 |
0.498 |
0.456 |
-0.019 |
-0.008 |
0.720 |
0.926 |
|
Number of observations |
19 |
18 |
26 |
31 |
32 |
32 |
29 |
32 |
Notes: Significantly different than zero at 90% (*), 95% (**), 99% (***) confidence. These regressions are based on available data for the years 1990-2021(1990-2020 for Mexico, whose data in 2021 is incomplete). TGE is the Total general government expenditure on education, AYS is the Average years of schooling, and ERP is the Gross enrollment ratio in primary education.
From another perspective, when basing the analysis and comparison on the level of religion instead of income, a set of new conclusions can be drawn. After removing the results of weak correlations (Table 3, column (1) & (2); Table 5, column (5) & (6)), it appears that in high-income and middle-high-income countries, the existence of religion weakens the positive impact or strengthen the negative impact of public education on gender equality, except the case where the variable AYS serves as a factor of CMSR in high-income countries (Table 4, column (1) & (2)): when the coefficient is above zero, its absolute value in high-religion-rate countries are smaller than that in low-religion-rate countries (Table 3, column (3) & (4); Table 4, column (3) & (4)), while the coefficient is below zero, in contrary, the absolute value of it in high-religion ones are larger than that in low-religion ones (Table 5, column (3) & (4)). Conversely, in middle-low-income and low-income countries, the existence of religion only unidirectionally promotes the positive impact of public education on gender equality, judging from all the displayed results in the right half of all three tables.
4.2. Discussion
Despite the noticeable and unquestioned regression results, several seemingly weird inferences stand out, which cannot be interpreted straightforward by intuition. Following are some practical mechanisms that may provide reasonable explanations for these results.
Firstly, why is there no evident relationship between TGE and CMSR in high-income countries? This is possible because private schools account for a large proportion of high-income countries. In the US, for example, around 25% of schools are private schools, and the number of students who attend private schools accounts for 10% of the number of all PK-12 students (the data is from the National Center for Education Statistics). More obviously, in Japan where 80% of students at the university and junior college level are in private schools (the data is from Private Education Institution Administration Division, Private Education Institution Department of Japan). In the context of that the newly increased educational expenditure is essentially spent on public schools, thereby there will not be much impact even if the government expands their spending on education.
Secondly, it is also worth noting that, in contrast to countries in other income level groups, those with a relatively high income level tend to display a negative relationship between AYS and CMSR, which seems to be opposite to the general understanding. To explain that, the advance in medical care cannot be overlooked. Judging from the descriptive results from Section 3, the average of CMSR in Japan and the US from 1990 to 2021 are both above one, which is in accord with the common “natural laws” — the observations that mortality rate of males outnumbers that of the females almost at every point of life, especially during the earliest stage of year 0-5 [22]. The approaching of CMSR reveals the societal trends: males who die under five years old is declining, and the females who die under five years old is increasing. In preference to the latter condition, the former one is more in line with the situations in high-income countries, where the level of medical health care is relatively high compared to other income level groups. Therefore, the increasing average years of schooling in high-income countries contributes to higher levels of knowledge attainment, resulting in wiser consciousness of health care among residents. Besides, longer education in the sector of medical science facilitates the development and advancement of medical treatment. Therefore, diseases that have more chance to kill a boy than a girl, such as neonatal encephalopathy and congenital birth defects, can be treated promptly and correctly so that the number of boys dying at the age of under-five dwindles gradually. CMSR, as a result, declines.
Thirdly, regression results indicate that the impact of AYS on CMSR is more distinct in high-income and low-income countries than in the middle ones. Here is one possible explanation for this phenomenon. In the cases of high-income countries, despite having a relatively high overall economic level, men are more likely to have access to education and other societal resources in certain sectors, while women are at a disadvantage. This type of inequality in the structure of economic and authority impedes the achievement of gender equality in society. Besides, stubborn conservative norms that are quite incompatible with the advanced economic and political systems are the root causes of still-existing gender inequality, and it is the discord between undeveloped notions and developed economies that leads to the unusual result. Moreover, incomplete policies dealing with the problem are also to blame. In high-income countries, given that people have somewhat realized their material aspirations, they tend to be more concerned about the spiritual pursuits and begin to care about the capability of government. Thereby, the deficiency of implementation and execution can be magnified badly compared to middle-income countries. In a nutshell, if four income level groups have the same level of gender inequality, the case for high-income countries is more obvious and noticeable because there are irreconcilable contradictions between progressive development and negative thoughts and policies. Subsequently, research on gender equality has emerged in recent years, especially in Western countries, and people have begun to devote themselves to the cause of equal rights. It can be concluded that, it is the lack of schooling that leads to the adverse conservative notions, which worsens the condition of equality. And it is the extension of years of education that enhances people’s social awareness to better supervise the implementations of relevant laws, which pushes forward the progress of gender equality. When it comes to low-income countries, the problem of resource insufficiency takes the upper hand. Multiple measurements can be conducted to smooth the way towards a more equal community, but due to age-old backward national conditions, no matter how hard females try to earn enough money to pursue parity between genders, there is no way to reach their orientations. The only way to accelerate the process of gender equality is to enhance the ideological level by more education.
Fourthly, ERP nearly has nothing to do with the level of gender equality in middle-low-income countries, different from those with a higher or lower level of income. Contrary to high-income countries, middle-low-income countries have a much larger proportion of public schools where compulsory education is widely provided. Unfortunately, the limitation of educational resources and family conditions hampers people from pursuing higher education after finishing compulsory education for free. Besides, after certain years of development, public education has reached a relatively high level compared to low-income countries. Hence, granted that ERP improves, the average years of schooling will not change much, nor will the general education level. Consequently, achieving ideological progress that may contribute to the improvement of gender equality via higher education is hard to accomplish in middle-low-income countries. In low-income countries, however, have very low levels of public education, so as long as the government expands educational expenditures, the average years of schooling can be improved significantly, especially for the case of compulsory education. The amelioration of public education is essential to enlighten people’s awareness of gender equality, which is of great importance.
Finally, how the existence of religion worsens or promotes the level of gender equality in diverse situations in distinct countries and what the mechanism behind the semblance is are all meaningful topics that remain to be solved. In high-income countries, the prevalence of religion weakens the effectiveness of relevant laws owing to the immense influence of religious ideology, which often advocates for the restriction of females” rights that conflict with modern legal concepts. For example, in Middle Eastern and North Africa, publics tend to oppose gender equality, implying that most dimensions of religiosity support patriarchal control [16]. Accordingly, the process of gender equality is retarded. In middle-low-income and low-income countries, however, religion serves as an alternative to education to promote equality between the two sexes. Even though religions like Islam often fuel opposition to gender equality, they are the only intermediates to buffer the adverse bearing on equal rights [16]. It is also found that a majority of religious believers are firmly convinced that their religions stand up for the promotion of gender equality, while they are conscious of the twisted implications someone has distorted. Thus, in middle-low-income and low-income countries where public education is poorly resourced, normal religious norms can be a substitution to uphold the ban on gender role specialization [17].
Inevitably, our study still has certain limitations. Why the situation of gender equality exacerbates as ERP increases in middle-high-income countries has not been answered yet, and the mechanisms behind them are still unclear. Further in-depth research is expected.
5. Conclusion
This paper investigates the root causes of gender inequality, which brings extensive discussion and debate in considerable fields. Our research implies that public education is a key influencing factor of gender inequality.
We chose eight typical countries categorized by income level and religion rate. By analyzing three measures of public education (TGE, AYS, and ERP) and three specific single-factor model specifications, we develop a system that can comprehensively cover all aspects of education. The regression results suggest that, in general, all three dimensions of public education fuel the support for gender equality. However, it is noteworthy that, in some cases, some facets do not work in certain countries, while others even play an adverse role. Moreover, the existence of religion is thought to be a supplement to public education factors to better illustrate the patterns presented in the results.
A key matter is how the government in distinct countries could do to diminish and eradicate the disparities between genders. For high-income countries, where educational expenditure is of no use and average years of schooling deteriorates gender equality, policies that deal with other aspects of society rather than the mentioned three are in urgent need. Instead of implementing laws about public education, which is already advanced in high-income countries, there also should be laws that promote equal rights in the labor force and political power, etc. When it comes to middle-high-income and middle-low-income countries, the government ought to focus more on the impact of educational expenditure and average years of schooling than enrollment rate, for the latter one sometimes has a negative bearing on or has nothing to do with the pursuit of equal rights. Low-income countries whose societal resources are much more deficient than those of other income-level countries, however, need policies regarding all fields of public education.
Our results also provide a broader scope of research. Why does the situation of gender equality exacerbate as ERP increases in middle-high-income countries? Why does the relationship between AYS and CMSR in Mongolia seem to be an exception? And how exactly do the corresponding policies work to eliminate gender inequality from the most fundamental angle and at the very beginning of lifetime? These unsolved problems now encourage researchers to further dig into the nexus between public education and gender equality, which is significant to the progress of society and mankind.
References
[1]. Ansari, A. K. , & Shahid, M. (2022). A study of gender inequality. J. Res. humanities Soc. science, 10(2), 49-52.
[2]. Dominic, A. , Amodu, L. , Azuh, A. E. , Toluwalope, O. , & Oluwatoyin, M. A. (2017). Factors of gender inequality and development among selected low human development countries in sub-Saharan Africa. IOSR Journal of Humanities and Social Science, 22(02), 01-07.
[3]. Jha, P. , & Nagar, N. (2015). A study of gender inequality in India. The International Journal of Indian Psychology, 2(3), 46-53.
[4]. Dako-Gyeke, M. , & Owusu, P. (2013). A qualitative study exploring factors contributing to gender inequality in rural Ghana. Mediterranean Journal of Social Sciences, 4(1), 481-489.
[5]. Hesketh, T. , Lu, L. , & Xing, Z. W. (2011). The consequences of son preference and sex-selective abortion in China and other Asian countries. CMAJ, 183(12), 1374-1377.
[6]. Das Gupta, M. , Zhenghua, J. , Bohua, L. , Zhenming, X. , Chung, W. , & Hwa-Ok, B. (2003). Why is son preference so persistent in East and South Asia? A cross-country study of China, India and the Republic of Korea. The Journal of Development Studies, 40(2), 153-187.
[7]. Marginson, S. (2016). Higher Education and Society. In The Dream Is Over: The Crisis of Clark Kerr”s California Idea of Higher Education (pp. 178–192). University of California Press. http://www. jstor. org/stable/10. 1525/j. ctt1kc6k1p. 26
[8]. Mitra, D. (2011). The social and economic benefits of public education. Pennsylvania State University, 3.
[9]. Nordin, M. (2018). Does Eligibility for Tertiary Education Affect Crime Rates? Quasi-Experimental Evidence. Journal of Quantitative Criminology, 34(3), 805–829. https://www. jstor. org/stable/48701188
[10]. Jacobs, J. A. (1996). Gender inequality and higher education. Annual review of sociology, 22(1), 153-185.
[11]. Evertsson, M. , England, P. , Mooi-Reci, I. , Hermsen, J. , De Bruijn, J. , & Cotter, D. (2009). Is gender inequality greater at lower or higher educational levels? Common patterns in the Netherlands, Sweden, and the United States. Social Politics, 16(2), 210-241.
[12]. Nguyen, A. D. et al. , (2023). Toward sustainable development goals in gender inequality: an analysis of gender preferences among urban pregnant women in a Southeast Asian country. BMC Pregnancy and Childbirth, 23
[13]. Nithin K, Tanuj K, Unnikrishnan B, Rekha T, Prasanna M, Vaman K, et al. Gender preferences among antenatal women: a cross-sectional study from coastal South India. Afr Health Sci. 2015;15(2):560–7.
[14]. Hannah Ritchie and Max Roser (2019). Gender Ratio. Published online at OurWorldInData, org, from: "https://ourworldindata. org/gender-ratio”
[15]. Kane, E. W. (1995). Education and Beliefs about Gender Inequality. Social Problems, 42(1), 74–90. https://doi. org/10. 2307/3097006
[16]. Glas, S. , Spierings, N. , & Scheepers, P. (2018). Re-understanding religion and support for gender equality in Arab countries. Gender & Society, 32(5), 686-712.
[17]. Page, S. J. , & Yip, A. K. T. (2017). Gender equality and religion: A multi-faith exploration of young adults” narratives. European Journal of Women’s Studies, 24(3), 249-265.
[18]. Fischer, J. , Jung, N. , Robinson, N. , & Lehmann, C. (2015). Sex differences in immune responses to infectious diseases. Infection, 43(4), 399-403.
[19]. Libert, C. , Dejager, L. , & Pinheiro, I. (2010). The X chromosome in immune functions: when a chromosome makes the difference. Nature Reviews Immunology, 10(8), 594.
[20]. Iqbal, N. , Gkiouleka, A. , Milner, A. , Montag, D. , & Gallo, V. (2018). Girls” hidden penalty: Analysis of gender inequality in child mortality with data from 195 countries. BMJ Global Health, 3(5). https://doi-org-s. elink. xjtlu. edu. cn:443/10. 1136/bmjgh-2018-001028
[21]. Schnabel, L. (2016). Religion and Gender Equality Worldwide: A Country-Level Analysis. Social Indicators Research, 129(2), 893–907. https://doi-org-s. elink. xjtlu. edu. cn:443/10. 1007/s11205-015-1147-7
[22]. Clarke, J. , & Price, R. (1786). XVII. Observations on some causes of the excess of the mortality of males above that of females. By Joseph Clarke, MD physician to the lying-in hospital at Dublin. Communicated by the Rev. Richard Price, DDFRS in a letter to Charles Blagden, MD Sec. R. S. Philosophical Transactions of the Royal Society of London, (76), 349-362.
Cite this article
Tian,Y.;Xia,Y.;Yu,J.;Han,Y. (2025). Does Public Education Promote Gender Equality? Evidence from 8 Countries of Different Income and Religion Levels. Lecture Notes in Education Psychology and Public Media,101,30-45.
Data availability
The datasets used and/or analyzed during the current study will be available from the authors upon reasonable request.
Disclaimer/Publisher's Note
The statements, opinions and data contained in all publications are solely those of the individual author(s) and contributor(s) and not of EWA Publishing and/or the editor(s). EWA Publishing and/or the editor(s) disclaim responsibility for any injury to people or property resulting from any ideas, methods, instructions or products referred to in the content.
About volume
Volume title: Proceedings of the 2nd International Conference on Global Politics and Socio-Humanities
© 2024 by the author(s). Licensee EWA Publishing, Oxford, UK. This article is an open access article distributed under the terms and
conditions of the Creative Commons Attribution (CC BY) license. Authors who
publish this series agree to the following terms:
1. Authors retain copyright and grant the series right of first publication with the work simultaneously licensed under a Creative Commons
Attribution License that allows others to share the work with an acknowledgment of the work's authorship and initial publication in this
series.
2. Authors are able to enter into separate, additional contractual arrangements for the non-exclusive distribution of the series's published
version of the work (e.g., post it to an institutional repository or publish it in a book), with an acknowledgment of its initial
publication in this series.
3. Authors are permitted and encouraged to post their work online (e.g., in institutional repositories or on their website) prior to and
during the submission process, as it can lead to productive exchanges, as well as earlier and greater citation of published work (See
Open access policy for details).
References
[1]. Ansari, A. K. , & Shahid, M. (2022). A study of gender inequality. J. Res. humanities Soc. science, 10(2), 49-52.
[2]. Dominic, A. , Amodu, L. , Azuh, A. E. , Toluwalope, O. , & Oluwatoyin, M. A. (2017). Factors of gender inequality and development among selected low human development countries in sub-Saharan Africa. IOSR Journal of Humanities and Social Science, 22(02), 01-07.
[3]. Jha, P. , & Nagar, N. (2015). A study of gender inequality in India. The International Journal of Indian Psychology, 2(3), 46-53.
[4]. Dako-Gyeke, M. , & Owusu, P. (2013). A qualitative study exploring factors contributing to gender inequality in rural Ghana. Mediterranean Journal of Social Sciences, 4(1), 481-489.
[5]. Hesketh, T. , Lu, L. , & Xing, Z. W. (2011). The consequences of son preference and sex-selective abortion in China and other Asian countries. CMAJ, 183(12), 1374-1377.
[6]. Das Gupta, M. , Zhenghua, J. , Bohua, L. , Zhenming, X. , Chung, W. , & Hwa-Ok, B. (2003). Why is son preference so persistent in East and South Asia? A cross-country study of China, India and the Republic of Korea. The Journal of Development Studies, 40(2), 153-187.
[7]. Marginson, S. (2016). Higher Education and Society. In The Dream Is Over: The Crisis of Clark Kerr”s California Idea of Higher Education (pp. 178–192). University of California Press. http://www. jstor. org/stable/10. 1525/j. ctt1kc6k1p. 26
[8]. Mitra, D. (2011). The social and economic benefits of public education. Pennsylvania State University, 3.
[9]. Nordin, M. (2018). Does Eligibility for Tertiary Education Affect Crime Rates? Quasi-Experimental Evidence. Journal of Quantitative Criminology, 34(3), 805–829. https://www. jstor. org/stable/48701188
[10]. Jacobs, J. A. (1996). Gender inequality and higher education. Annual review of sociology, 22(1), 153-185.
[11]. Evertsson, M. , England, P. , Mooi-Reci, I. , Hermsen, J. , De Bruijn, J. , & Cotter, D. (2009). Is gender inequality greater at lower or higher educational levels? Common patterns in the Netherlands, Sweden, and the United States. Social Politics, 16(2), 210-241.
[12]. Nguyen, A. D. et al. , (2023). Toward sustainable development goals in gender inequality: an analysis of gender preferences among urban pregnant women in a Southeast Asian country. BMC Pregnancy and Childbirth, 23
[13]. Nithin K, Tanuj K, Unnikrishnan B, Rekha T, Prasanna M, Vaman K, et al. Gender preferences among antenatal women: a cross-sectional study from coastal South India. Afr Health Sci. 2015;15(2):560–7.
[14]. Hannah Ritchie and Max Roser (2019). Gender Ratio. Published online at OurWorldInData, org, from: "https://ourworldindata. org/gender-ratio”
[15]. Kane, E. W. (1995). Education and Beliefs about Gender Inequality. Social Problems, 42(1), 74–90. https://doi. org/10. 2307/3097006
[16]. Glas, S. , Spierings, N. , & Scheepers, P. (2018). Re-understanding religion and support for gender equality in Arab countries. Gender & Society, 32(5), 686-712.
[17]. Page, S. J. , & Yip, A. K. T. (2017). Gender equality and religion: A multi-faith exploration of young adults” narratives. European Journal of Women’s Studies, 24(3), 249-265.
[18]. Fischer, J. , Jung, N. , Robinson, N. , & Lehmann, C. (2015). Sex differences in immune responses to infectious diseases. Infection, 43(4), 399-403.
[19]. Libert, C. , Dejager, L. , & Pinheiro, I. (2010). The X chromosome in immune functions: when a chromosome makes the difference. Nature Reviews Immunology, 10(8), 594.
[20]. Iqbal, N. , Gkiouleka, A. , Milner, A. , Montag, D. , & Gallo, V. (2018). Girls” hidden penalty: Analysis of gender inequality in child mortality with data from 195 countries. BMJ Global Health, 3(5). https://doi-org-s. elink. xjtlu. edu. cn:443/10. 1136/bmjgh-2018-001028
[21]. Schnabel, L. (2016). Religion and Gender Equality Worldwide: A Country-Level Analysis. Social Indicators Research, 129(2), 893–907. https://doi-org-s. elink. xjtlu. edu. cn:443/10. 1007/s11205-015-1147-7
[22]. Clarke, J. , & Price, R. (1786). XVII. Observations on some causes of the excess of the mortality of males above that of females. By Joseph Clarke, MD physician to the lying-in hospital at Dublin. Communicated by the Rev. Richard Price, DDFRS in a letter to Charles Blagden, MD Sec. R. S. Philosophical Transactions of the Royal Society of London, (76), 349-362.