


1. Introduction
In the contemporary technological landscape of rapid artificial intelligence development, many operations and experiences tend towards visual interface operations. However, existing research to a certain extent deviates from the physical interface operation between humans and machines, focusing more on the code and programs behind achieving intelligent objectives. The interactive interface is the most direct bridge between human-machine interaction, and well-designed interactive interfaces can effectively enhance user experience of technological products. In the context of the digital era, various groups encounter multimedia touch screen devices to accomplish certain aspects of their lives, work, and learning processes. Among intelligent products, the most encountered by ordinary people are multimedia touch screen devices.
According to the 2019 survey data from the UK, 90% of children aged 5-15 have used smart internet-connected devices; 79% of parents of 8-11-year-olds and 59% of parents of 5-7-year-olds believe that children can learn new skills or develop creativity from the internet (Office of Communications [Ofcom], 2019). This data underscores the urgency and necessity of focusing on the impact of touch screen media on children's learning from a research perspective.
For children, especially pre-school children, traditional forms of children's products still hold a significant share in the market. Although technological advancements are rapid, all market products mainly revolve around children's APP products—mostly focused on early education (children's touch screens). There lacks a seamless integration between these two, and existing intelligent products, mostly in the form of touch screens, have replaced many children's products, becoming the new favorite for children. However, due to the specific physiological development of pre-school children, the rapid development of intelligence not only requires attention to children's psychology and their ways and abilities to accept knowledge but also should focus on how to avoid affecting children's physiological health and growth. Norman's proposed emotional design principles apply not only to adults but also to children at different developmental stages. Therefore, in the design of multimedia touch screen devices, relevant visual interface designs need to adhere to this principle. This research conducts analyses and considerations of the designed devices and related factors during the research process, aiming to provoke reflections on intelligent devices for children, especially pre-school children, in the rapidly developing era of intelligence, instead of confusing the related aspects of children in their growing period with intelligent multimedia devices used by adults.
This paper primarily starts with UI interactive interface front-end design, researching, analyzing, and discussing the related influencing factors of pre-school children's multimedia touch screen usage needs in the process of intelligent development.
2. Literature Review
Children of different age groups are influenced by numerous factors while using multimedia touch screen devices. These factors include interactive elements in interface design such as color, graphics, images, sound, text, cognitive psychology, neuroaesthetics, children's own physiological and physical factors, as well as external and parental factors.
With age changes, different age groups have different visual distances, visual cognitive characteristics, and demands. Presently, there is limited related research on this topic, especially focusing on pre-school children, which provides ample space for further research. Pre-school children are at crucial developmental stages in vision, body, and other aspects, and with the development of artificial intelligence and the arrival of the intelligent era, children in this age group have begun to extensively engage with related devices and technology. The most direct contact is with children's touch screen devices (now mostly paper-like screens). Although there are certain protective measures for their vision in physical technology, many issues still arise during usage, warranting scholars to conduct related research.
2.1. Vision and Visual Development of Preschool Children
Regarding the vision of preschool children, research confirms that visual acuity increases with age, signifying a dynamic developmental process. Notably, subjective visual acuity shows rapid development between 3 to 3.5 years, while between 3.5 to 4.5 years, it progresses relatively slowly, akin to findings by Jiang Liqin and others. The overall measurable rates of visual acuity in preschool children using the Lea Symbols chart and HOTV optotypes were 96.24% and 92.48%, respectively, indicating high measureability with no statistically significant differences (P > 0.05). This to some extent underscores the heightened demand and receptivity of children, especially preschoolers, toward cognitive understanding and recognition of graphic images. Analysis of the measurable rates of preschool children's vision using the Lea Symbols chart and HOTV optotypes reveals a higher percentage with the Lea Symbols chart, emphasizing the greater impact of visual images on children's visual cognition compared to text [1],[2].
2.2. External Environmental Impact on Child Development
Environmental factors encompass family-related elements (such as socioeconomic status), the media usage environment within the family concerning children, and the parental guidance strategies and parenting styles during children's media usage [2]. Factors predominantly stemming from family socioeconomic status, educational level, and parenting styles influence children's usage of touchscreen multimedia devices, aside from their physiological and psychological attributes. The analysis and compilation of relevant data indicate that the factors affecting children's touchscreen multimedia usage can primarily be categorized into three theoretical facets: the Health Ecology Model, Social Cognitive Theory, and Family Function Theory. A brief overview of these three aspects is provided below:
2.2.1. Health Ecology Model
Acknowledged as one of the current models explaining health influence factors [3]. Emphasizes that individual and collective health are singular elements of individual factors, yet due to interdependent interactions between health services, material, and social environmental factors, the resulting outcomes manifest across multiple levels, impacting individual and group health. This model includes:
Core layers comprising individual biological factors like age, gender, and genetically predisposed susceptibility to diseases.
1) Individual behavioral traits encompassing health-related behavior and personal lifestyle.
2) Interpersonal networks within society, family, and community.
3) Living and working conditions encompassing socio-psychological and occupational factors.
4) The outermost macro level encompassing societal, economic, cultural, health, environmental conditions, and relevant policies.
The context of digitization forms the outermost health influencing factor. The family rearing environment amalgamates the influences of the third and fourth layers, acting as a microsystem affecting children's screen exposure characteristics [3].
2.2.2. Social Cognitive Theory
Advocates a triadic interaction system among cognition, behavior, and the environment. During a child's growth, they acquire behavior through observational learning, completing the learning process [3].
2.2.3. Family Function Theory
Segmented into two orientations (process-oriented and outcome-oriented) [3]. The inherent characteristics of the family may influence emotional, communication, value systems, family rules, and other dimensions within the family rearing environment, thereby affecting a child's perception of screen exposure and their own physical and mental health. It's evident that both the tangible and intangible aspects within the family environment significantly impact a child's screen interaction and their overall well-being, with the inherent family traits potentially influencing the explicit factors. Considering the diverse results from the survey questionnaire, different analytical methods should be employed to ensure more accurate outcomes, thereby providing theoretical foundations for the hardware, software requirements, and development of touchscreen multimedia devices.
2.3. Exemplification of UI Visual Factors Classification
From the existing literature on UI visual factor classification analysis, it's evident that although there is literature on related content, the quantity varies, showing a high similarity rate. However, there's a scarcity in categorization concerning demographics and content, revealing the following trends:
Existing literature specifies visual cognitive factors primarily involving sound, text, and images, but research on visual material and touch-related studies is limited. Currently, in existing intelligent devices, sound, text, and images serve as the foundation for artificial intelligence technology in visualization applications. However, users are often influenced by occasional visual materials and touchscreen sensations while operating and using these devices. Hence, it's worth considering whether these should be categorized under UI visual factors, a question worthy of deeper contemplation by relevant experts [4][5].
3. Research Content Results and Analysis
This study conducted preliminary research and surveys on relevant influencing factors, primarily employing market questionnaire survey methods due to the preliminary nature of the subject matter involving executive segments. It delved into aspects related to children's age, parents' personal income, occupation, among others. This aimed to classify and summarize the impacts of health ecology models, family function theories, etc., on the population that will be part of the upcoming research experiments. As these factors to some extent affect children, especially preschoolers, regarding the duration, age, form, and content of their interaction with touchscreen multimedia, this study focused on preschool children and parents primarily in first-tier cities such as Beijing, Shanghai, Chengdu, and coastal cities. These regions expose parents and children to cutting-edge technological devices, pioneering many new technologies and information disseminated nationwide. Therefore, parents and children here are more inclined to embrace new media and have certain economic capacities.
An increasing array of multimedia touchscreens is becoming ubiquitous in the lives, work, and studies of people across various age groups, including children and preschoolers. However, the current market presents a clutter of related products, which is detrimental to the healthy growth of adolescents and even preschool children. Consequently, during the survey, classification research was conducted on the touchscreen multimedia devices used by preschool children and children to specifically differentiate whether these devices, in terms of hardware, software, align with the mainstream market but have not been distinctly segregated in service.
Regarding the relevant outcomes and content, the analysis primarily employed demographic characteristic statistics, differential analyses (chi-square test analysis results), and binary logistic regression to facilitate a comprehensive analysis.
3.1. Analysis of Multimedia Touchscreen Ownership Situation
Relevant analysis of questionnaires and their outcomes was conducted through demographic characteristic statistics. Findings regarding ownership of multimedia touchscreen devices among preschool children are outlined below:
Table 1: Demographic Characteristics Statistics (N=102)
Category | Types | Frequency | Percentage (%) | Cumulative Percentage (%) |
Ownership of Child's Multimedia Touchscreen Device | Yes (non-paper screen, ordinary tablet) | 57 | 55.882 | 55.882 |
Yes (children's intelligent learning machine, paper screen) | 40 | 39.216 | 95.098 | |
None | 5 | 4.902 | 100.000 |
The frequency analysis results regarding ownership of children's multimedia touchscreen devices are as follows: Frequency of 'Yes (non-paper screen, ordinary tablet)' is 57, accounting for 55.882%; 'Yes (children's intelligent learning machine, paper screen)' is 40, accounting for 39.216%; 'None' is 5, accounting for 4.902%. Among these, 'Yes (non-paper screen, ordinary tablet)' is the highest at 55.882%, and 'None' is the lowest at 4.902%.
It is evident that the ownership varies under different circumstances (as shown below):
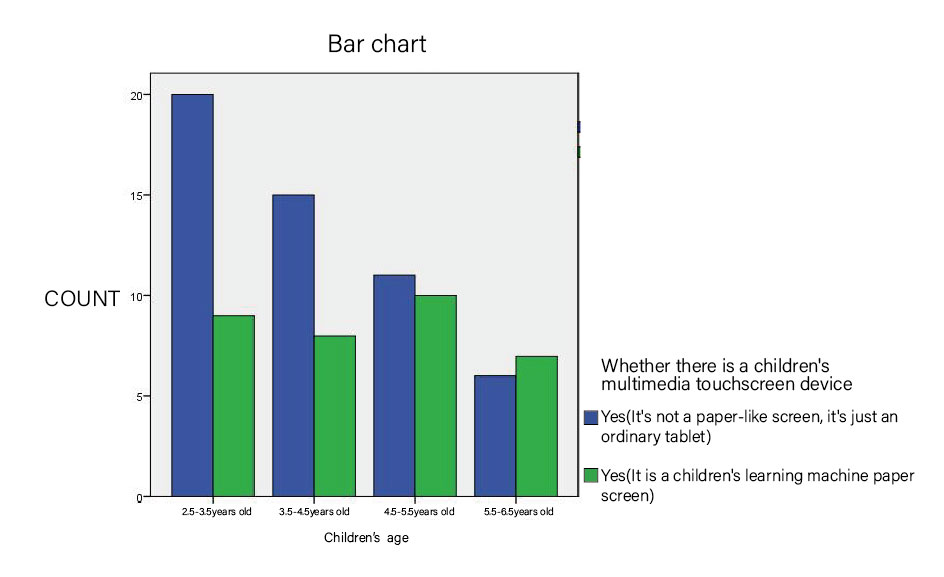
Figure 1: Relationship between touchscreen device ownership and children's age
Frequency analysis based on children's age displays the following percentages: 2.5-3.5 years old at 33.721%; 3.5-4.5 years old at 26.744%; 4.5-5.5 years old at 24.419%; 5.5-6.5 years old at 15.116%. The highest is in the 2.5-3.5 age group (33.721%), while the lowest is in the 5.5-6.5 age group (15.116%).
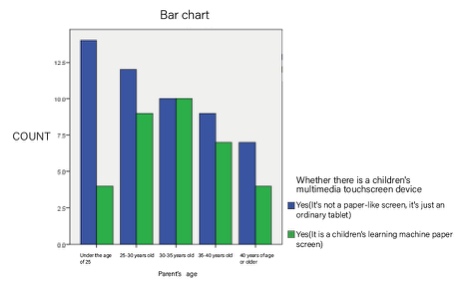
Figure 2: Relationship between touchscreen device ownership and parental age
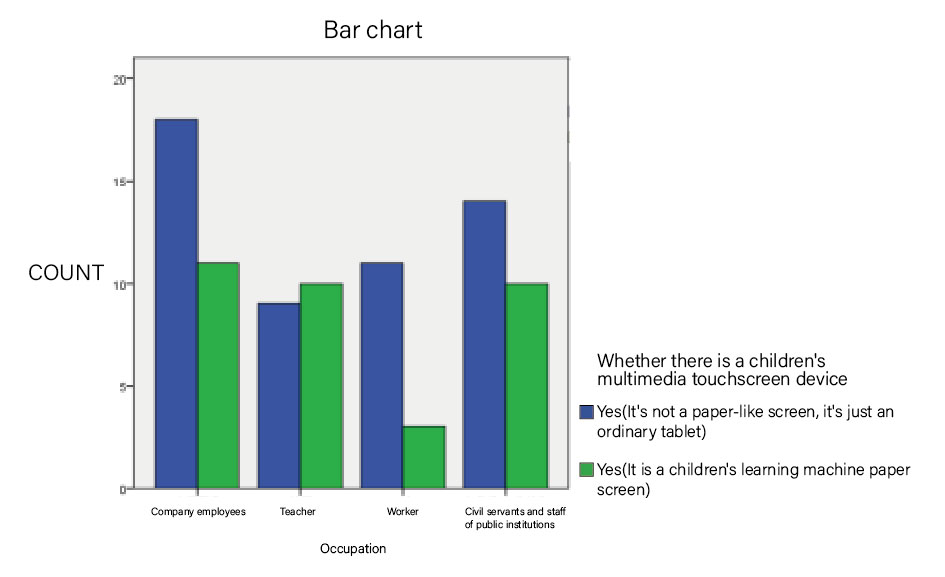
Figure 3: Relationship between touchscreen device ownership and parental occupation
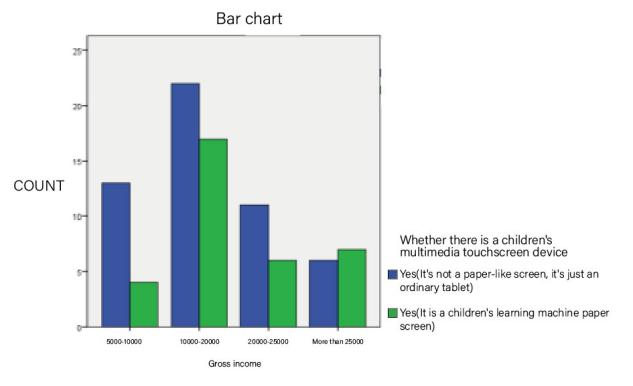
Figure 4: Relationship between touchscreen device ownership and parental income
Combining the three figures, it is observable (similarly for other items concerning the research theme) that the proportion of ownership of special multimedia touchscreen devices (children's learning machines, paper screens) is relatively low and primarily influenced by family factors. Children owning intelligent learning machines and paper screens have parents predominantly aged 30-35 years old with a total income of 10,000-20,000 RMB. Such parents demonstrate better knowledge and income situations, which facilitate better support for their children's physical and psychological development. Additionally, the income derived from the survey aligns relatively well with parental occupations, resulting in a more accurate depiction.
By screening initial queries, the study formulated questionnaires specifically addressing the ownership of children's intelligent learning machines and paper screen multimedia devices. Subsequently, it conducted targeted and specific analyses of relevant factors.
3.2. Usage Situation Analysis
Currently, the mainstream market for intelligent touchscreen devices designed for children is limited. Both domestic and international studies on related products are mainly concentrated in China. Key Chinese products include Keda Xunfei, JD Little Class Screen, Xiaodu Learning Machine, Hiwonder, and Xueersi.
Regarding the content concerning children's multimedia touchscreen devices and the survey results, the study employed various statistical methods to conduct data analysis. The research primarily utilized demographic characteristic statistics, multiple response frequency analysis, and chi-square tests to analyze the operations, recognition, and cognition of multimedia touchscreen-related modules. The specific analyses and relevant results are as follows:
Table 2: Demographic Characteristic Statistics (N=86)
Category | Types | Frequency | Percentage (%) | Cumulative Percentage (%) |
Screen Occupancy Ratio of the Device | Very small, specific size unknown | 14 | 16.279 | 16.279 |
Occupies 1/4 of the screen | 21 | 24.419 | 40.698 | |
Occupies 1/3 of the screen | 27 | 31.395 | 72.093 | |
Quite large, specific size unknown | 24 | 27.907 | 100.000 | |
Effectiveness of Current Reminder Function | Able | 57 | 66.279 | 66.279 |
Unable | 29 | 33.721 | 100.000 | |
Necessity of Current Reminder Function | Necessary | 53 | 61.628 | 61.628 |
Not necessary | 33 | 38.372 | 100.000 | |
Primary Mode of Reminder Module | Text predominant over graphic images | 22 | 25.581 | 25.581 |
Graphic images predominant over text | 37 | 43.023 | 68.605 | |
Nearly equal proportions | 27 | 31.395 | 100.000 | |
Presence of Sound/Music with Reminder Appearances | Present | 51 | 59.302 | 59.302 |
Absent | 35 | 40.698 | 100.000 | |
Child's Reaction during Reminder Occurrence | No reaction | 34 | 39.535 | 39.535 |
Will promptly adjust posture | 35 | 40.698 | 80.233 | |
Feels quite irritated | 17 | 19.767 | 100.000 | |
Device's Interface Style | Cute cartoon style, more suitable for children | 50 | 58.140 | 58.140 |
Similar to a regular tablet | 36 | 41.860 | 100.000 | |
Child's Ability for Independent Interaction with the Device | Able | 59 | 68.605 | 68.605 |
Unable | 27 | 31.395 | 100.000 | |
Satisfaction with Device's Distance and Lighting Reminder Function | Satisfied | 48 | 55.814 | 55.814 |
Not satisfied | 13 | 15.116 | 70.930 | |
Indifferent, it doesn't matter | 25 | 29.070 | 100.000 | |
Child's Ability to Recognize and Understand Instructions | Able | 51 | 59.302 | 59.302 |
Unable | 13 | 15.116 | 74.419 | |
Occasionally able | 22 | 25.581 | 100.000 | |
Impact of Text, Graphic Images, and Sound on Child's Device Usage | Text | 23 | 26.744 | 26.744 |
Graphic images | 28 | 32.558 | 59.302 | |
Sound | 33 | 38.372 | 97.674 | |
Other | 2 | 2.326 | 100.000 |
Participants' opinions and suggestions regarding multimedia touchscreen devices were distilled from relevant queries. Based on the combined references, the study conducted a multiple response frequency analysis of three primary visual elements—graphic images—that best align with children's needs: adding a bit of graphic image reminder, minimizing text content, and incorporating dynamic effects and sound into household appliances to better meet children's requirements.
Table 3: Multiple Response Frequency Analysis Table
Opinions and Suggestions on Multimedia Touchscreen Devices | N (count) | Response Rate (%) | Prevalence Rate (%) | X² | P |
Adding a bit of graphic image reminder | 73 | 38.800 | 84.900 | 3.521 | 0.172 |
Minimizing text content | 52 | 27.700 | 60.500 | ||
Adding dynamic effects, sound, etc., to better meet children's requirements | 63 | 33.500 | 73.300 | ||
Total | 188 | 100.000 | 218.605 | ||
Note: ***, **, and * represent the significance levels of 1%, 5%, and 10%, respectively | |||||
From the multiple response frequency analysis table, the chi-square goodness-of-fit test for the items: adding a bit of graphic image reminder, minimizing text content, and adding dynamic effects, sound, etc., to better meet children's requirements, yields a significant P-value of 0.172, indicating no significant difference across the selections. Thus, when addressing modules for children, especially preschoolers, emphasis should be placed on enhancing graphic image content, reducing textual content, and incorporating children's preferences for dynamic effects and sound in design. Although there's minimal disparity among the counts, among the factors affecting interface modules for children in this age group, graphic images take precedence.
3.3. Module Variability Analysis
The variability analysis within the modules involved a comprehensive examination of factors in relation to children's responses. The primary analytical method employed for this study's relevant module analysis was the chi-square test. This method was chosen to investigate significant differences between variables in two groups. The analysis and outcomes are detailed below.
Table 4: Chi-square Test Analysis Results of the Relationship between Parental Age and Children's Responses
Title | Category | Children's Response | Total | Test Method | X² | P | |
Not Adjusting Posture | Adjusting Posture On Time | ||||||
Parental Age | Below 25 | 7 | 11 | 18 | Pearson Chi-Square | 11.146 | 0.025** |
25-30 | 11 | 10 | 21 | ||||
30-35 | 12 | 8 | 20 | ||||
35-40 | 10 | 6 | 16 | ||||
Above 40 | 11 | 0 | 11 | ||||
Total | 51 | 35 | 86 | ||||
Note: ***, **, and * represent the significance levels of 1%, 5%, and 10%, respectively | |||||||
The results of the chi-square test analysis demonstrate a significant P-value of 0.025** concerning parental age and children's responses, indicating significance at a 5% level and rejecting the null hypothesis. Therefore, there exist significant differences in children's responses to reminders across different parental age groups. As parental age increases, the probability of children promptly adjusting their posture decreases.
Table 5: Chi-square Test Analysis Results of the Relationship between Parental Income and Children's Responses
Title | Category | Children's Response | Total | Test Method | X² | P | |
Not Adjusting Posture | Adjusting Posture On Time | ||||||
Total Income | 5000-10000 | 10 | 7 | 17 | Pearson Chi-Square | 11.718 | 0.008*** |
10000-20000 | 18 | 21 | 39 | ||||
20000-25000 | 10 | 7 | 17 | ||||
Over 25000 | 13 | 0 | 13 | ||||
Total | 51 | 35 | 86 | ||||
Note: ***, **, and * represent the significance levels of 1%, 5%, and 10%, respectively | |||||||
Furthermore, the chi-square test analysis based on total income and children's responses reveals a significant P-value of 0.008***, indicating significance at a 1% level and rejecting the null hypothesis. Hence, there are significant differences in children's responses among families with varying total incomes. Specifically, within the income bracket of 10,000 to 20,000 units, children have a higher probability of promptly adjusting their posture compared to children from other income brackets.
Table 6: Chi-square test analysis results concerning the relationship between screen size proportions and children's responses.
Title | Category | Children's Response | Total | Test Method | X² | P | |
Not Adjusting Posture | Adjusting Posture On Time | ||||||
Screen Proportion | Very Small, Specific Unknown | 8 | 6 | 14 | Pearson Chi-Square | 3.526 | 0.317 |
1/4 of Screen | 16 | 5 | 21 | ||||
1/3 of Screen | 15 | 12 | 27 | ||||
Quite Large, Specific Unknown | 12 | 12 | 24 | ||||
Total | 35 | 86 | |||||
Note: ***, **, and * represent significance levels of 1%, 5%, and 10%, respectively.
The chi-square test analysis indicates a significance level of 0.317, suggesting no observed significance in children's responses concerning screen size proportions, thereby accepting the null hypothesis of no significant differences.
Table 7: illustrates the chi-square test analysis results concerning the relationship between reminder functions and children's responses.
Title | Category | Children's Response | Total | Test Method | X² | P | |
Not Adjusting Posture | Adjusting Posture On Time | ||||||
Reminder Function Can Protect Eyes While Using? | YES | 32 | 25 | 57 | Pearson Chi-Square | 0.7 | 0.403 |
NO | 19 | 10 | 29 | ||||
Total | 51 | 35 | 86 | ||||
Note: ***, **, and * represent significance levels of 1%, 5%, and 10%, respectively.
The chi-square test analysis indicates a significance level of 0.403, suggesting no observed significance in children's responses concerning the perception of the existing reminder functions' effectiveness in safeguarding their vision while using electronic devices.
Table 8: displays the chi-square test analysis results regarding the relationship between visual content and children's responses.
Title | Category | Children's Response | Total | Test Method | X² | P | |
Not Adjusting Posture | Adjusting Posture On Time | ||||||
Reminder Module | Text Dominant Over Graphics | 13 | 9 | 22 | Pearson Chi-Square | 0.283 | 0.868 |
Graphics Dominant Over Text | 23 | 14 | 37 | ||||
Proportions Are Similar | 15 | 12 | 27 | ||||
Total | 51 | 35 | 86 | ||||
Note: ***, **, and * represent significance levels of 1%, 5%, and 10%, respectively.
The chi-square test analysis indicates a significance level of 0.868, indicating no observed significance in children's responses regarding whether the reminder module is predominantly text-based or image-based.
Table 9: presents the chi-square test analysis results concerning the relationship between auditory content and children's responses.
Title | Category | Children's Response | Total | Test Method | X² | P | |
Not Adjusting Posture | Adjusting Posture On Time | ||||||
Reminder Presence of Sound/Music | Present | 28 | 23 | 51 | Pearson Chi-Square | 1.005 | 0.316 |
Not Present | 23 | 12 | 35 | ||||
Total | 51 | 35 | 86 | ||||
Note: ***, **, and * represent significance levels of 1%, 5%, and 10%, respectively.
The chi-square test analysis indicates a significance level of 0.316, suggesting no significant differences in children's responses concerning the presence of sound/music during reminders.
Table 10: displays the chi-square test analysis results concerning the relationship between style and children's responses.
Title | Category | Children's Response | Total | Test Method | X² | P | |
Not Adjusting Posture | Adjusting Posture On Time | ||||||
Device Interface Style | Cute Cartoon Style, More Suitable for Children | 29 | 21 | 50 | Pearson Chi-Square | 0.084 | 0.772 |
Similar to Regular Tablets | 22 | 14 | 36 | ||||
Total | 51 | 35 | 86 | ||||
Note: ***, **, and * represent significance levels of 1%, 5%, and 10%, respectively.
The chi-square test analysis indicates a significance level of 0.772, suggesting no significant differences in children's responses concerning different device interface styles.
3.4. Binary Logistic Regression
Logistic regression is primarily used for regression analysis when the dependent variable is categorical, such as binary classification. The independent variables can be categorical or continuous. It identifies the influential factors among multiple independent variables affecting the dependent variable and provides a predictive formula. When the dependent variable has two classifications, it's referred to as binary logistic regression, typically used for explaining variables with binary quality variables of 0 and 1.
The hypothesis testing of the logistic regression model involves common tests like the likelihood ratio test and Wald test. Through demographic statistics of the data results, differential analysis (as indicated by chi-square test analysis), and ultimately employing binary logistic regression, comprehensive results and analysis were derived.
Table 11: Basic Summary of Child Response Binary Dependent Variables
Dependent Variable | Options | Frequency | Percentage (%) |
Child Response | Not Adjusting Posture | 51 | 59.302 |
Adjusting Posture On Time | 35 | 40.698 | |
Total | 86 | 100 |
Table 12: Model Evaluation
Likelihood Ratio Chi-Square | P | AIC | BIC |
103.591 | 0.049** | 117.591 | 134.772 |
Note: ***, **, and * represent significance levels of 1%, 5%, and 10%, respectively.
The likelihood ratio chi-square test results for the model show a significance level of 0.049**, indicating observed significance. Rejecting the null hypothesis suggests that the model is effective.
Dummy variable settings: The control group for whether the reminder module is predominantly text-based or image-based is set as "Proportion Almost the Same". The control group for whether the child can autonomously interact with the multimedia touchscreen device is set as "Cannot."
Table 13: Binary Logistic Regression Results for Three Factors
Factors | Regression Coefficient | Standard Error | Wald | P | OR | ||
LLCI | ULCI | ||||||
Constant | 1.753 | 1.242 | 1.991 | 0.158 | 5.77 | 0.506 | 65.855 |
Child's Age | -0.341 | 0.237 | 2.061 | 0.151 | 0.711 | 0.447 | 1.132 |
Parent's Age | -0.494 | 0.196 | 6.349 | 0.012** | 0.61 | 0.416 | 0.896 |
Device Screen Proportion | 0.088 | 0.239 | 0.134 | 0.714 | 1.092 | 0.683 | 1.746 |
Reminder Module: Image-based more than Text-based | -0.404 | 0.577 | 0.491 | 0.483 | 0.668 | 0.216 | 2.067 |
Reminder Module: Text-based more than Image-based | -0.14 | 0.629 | 0.05 | 0.824 | 0.869 | 0.253 | 2.983 |
Child's Autonomy in Interacting with Multimedia Device: Yes | -0.154 | 0.514 | 0.09 | 0.765 | 0.857 | 0.313 | 2.348 |
Dependent Variable: Child's Response | |||||||
Note: ***, **, and * represent significance levels of 1%, 5%, and 10%, respectively. | |||||||
Through the above binary logistic regression results:
In terms of purchasing, usage, and visual requirements related to multimedia touchscreens, it is evident that the significance level (P-value) for child's age is 0.151, showing no significance at this level, thus failing to reject the null hypothesis. Therefore, child's age does not significantly impact the child's response.
Parent's age demonstrates a significance level (P-value) of 0.012**, indicating significance at this level, rejecting the null hypothesis. The regression coefficient is -0.494, suggesting that as the parent's age increases, the probability of the child adjusting posture promptly decreases.
The screen proportion of the device shows a significance level (P-value) of 0.714, indicating no significance at this level. Hence, the screen proportion does not significantly influence the child's response.
Regarding the reminder module based on textual or graphic content, it's observed that the significance level (P-value) for the module featuring more images than text is 0.483, demonstrating no significance at this level, thus not rejecting the null hypothesis. Therefore, the impact on the child's response between the module with more image content compared to an equal proportion is not markedly different.
For the reminder module based on textual or graphic content with more text than images, the significance level (P-value) is 0.824, indicating no significance at this level, hence not rejecting the null hypothesis. Thus, the effect on the child's response between the module with more text content compared to an equal proportion is not notably different.
Regarding the child's autonomy in interacting with the multimedia touchscreen device, the significance level (P-value) is 0.765, showing no significance at this level, thus failing to reject the null hypothesis. Therefore, whether the child can independently interact with the multimedia touchscreen device does not significantly differ in terms of the child's response.
4. Conclusion
Through the analysis of market data using three methods, it is evident that the options selected in this study generally align with the initial research hypothesis. Although the displayed content shows minimal differences in many aspects, specific numerical values reveal that children who possess smart learning machines or multimedia touchscreen devices are mostly concentrated in the younger age group of preschool children. Parents, primarily within the age range of 30-35 with a monthly income of 10,000-20,000 yuan, are prevalent. During usage, both parents and children express the desire for specific features in the interface: the reminder of the device's distance, reflecting varying differences with age, necessitating specific visual distance settings for children in the interface. In the overall design process of children's interfaces, the use of graphics and images should outweigh the use of text, favoring cartoon styles preferred by children, accompanied by sound to enhance interaction between the child and the device.
References
[1]. Zhang Y. Comparative study of Lea graphics and HOTV letter visual acuity tests in 3 to 4.5-year-old children. International Journal of Ophthalmology. 2014 Dec.
[2]. Zhao C, Zhang Y, Shi M. Developmental rules and comparisons of two subjective cognitive vision in children aged 2 to 5. Annual Meeting of Ophthalmology Zhejiang Province. 2011.
[3]. Lin Y, Ding X, Liu J, Ji Y. Factors affecting children's screen exposure-family nurturing environment. Chinese Family Education. 2022;6.
[4]. Cheng X, Tong Y, Wang F, Cao X, Li H, Hu X. The influence of digital media on children's executive abilities. Applied Psychology. 2023;29(3).
[5]. Newcombe NS, Frick A. Early education for spatial intelligence: Why, what, and how. Journal Compilation 2010 International Mind, Brain, and Education Society and Blackwell Publishing, Inc. 2010.
[6]. Xu XY. Visual presentation design under artificial intelligence guidance. Master's thesis, Southeast University. April 2019.
[7]. Dong YY. Research on visualization interface design methods under artificial intelligence. Master's thesis, Southeast University. June 2019.
[8]. Yang W. Artificial Intelligence education for young children: Why, what, and how in curriculum design and implementation. Computers and Education: Artificial Intelligence. March 2022.
[9]. Srinivasan V. AI & learning: A preferred future. Computers and Education: Artificial Intelligence. March 2022.
[10]. Su J, Yang W. Artificial intelligence in early childhood education: A scoping review. Computers and Education: Artificial Intelligence. March 2022.
Cite this article
Yang,X.;Yong,J.C.E.;Zhang,Z.;Li,B.;Shi,W. (2024). Analysis of Multimedia Touch Screen Visual Needs of Pre-School Children in the Digital Era. Lecture Notes in Education Psychology and Public Media,34,141-154.
Data availability
The datasets used and/or analyzed during the current study will be available from the authors upon reasonable request.
Disclaimer/Publisher's Note
The statements, opinions and data contained in all publications are solely those of the individual author(s) and contributor(s) and not of EWA Publishing and/or the editor(s). EWA Publishing and/or the editor(s) disclaim responsibility for any injury to people or property resulting from any ideas, methods, instructions or products referred to in the content.
About volume
Volume title: Proceedings of the 2nd International Conference on Interdisciplinary Humanities and Communication Studies
© 2024 by the author(s). Licensee EWA Publishing, Oxford, UK. This article is an open access article distributed under the terms and
conditions of the Creative Commons Attribution (CC BY) license. Authors who
publish this series agree to the following terms:
1. Authors retain copyright and grant the series right of first publication with the work simultaneously licensed under a Creative Commons
Attribution License that allows others to share the work with an acknowledgment of the work's authorship and initial publication in this
series.
2. Authors are able to enter into separate, additional contractual arrangements for the non-exclusive distribution of the series's published
version of the work (e.g., post it to an institutional repository or publish it in a book), with an acknowledgment of its initial
publication in this series.
3. Authors are permitted and encouraged to post their work online (e.g., in institutional repositories or on their website) prior to and
during the submission process, as it can lead to productive exchanges, as well as earlier and greater citation of published work (See
Open access policy for details).
References
[1]. Zhang Y. Comparative study of Lea graphics and HOTV letter visual acuity tests in 3 to 4.5-year-old children. International Journal of Ophthalmology. 2014 Dec.
[2]. Zhao C, Zhang Y, Shi M. Developmental rules and comparisons of two subjective cognitive vision in children aged 2 to 5. Annual Meeting of Ophthalmology Zhejiang Province. 2011.
[3]. Lin Y, Ding X, Liu J, Ji Y. Factors affecting children's screen exposure-family nurturing environment. Chinese Family Education. 2022;6.
[4]. Cheng X, Tong Y, Wang F, Cao X, Li H, Hu X. The influence of digital media on children's executive abilities. Applied Psychology. 2023;29(3).
[5]. Newcombe NS, Frick A. Early education for spatial intelligence: Why, what, and how. Journal Compilation 2010 International Mind, Brain, and Education Society and Blackwell Publishing, Inc. 2010.
[6]. Xu XY. Visual presentation design under artificial intelligence guidance. Master's thesis, Southeast University. April 2019.
[7]. Dong YY. Research on visualization interface design methods under artificial intelligence. Master's thesis, Southeast University. June 2019.
[8]. Yang W. Artificial Intelligence education for young children: Why, what, and how in curriculum design and implementation. Computers and Education: Artificial Intelligence. March 2022.
[9]. Srinivasan V. AI & learning: A preferred future. Computers and Education: Artificial Intelligence. March 2022.
[10]. Su J, Yang W. Artificial intelligence in early childhood education: A scoping review. Computers and Education: Artificial Intelligence. March 2022.