


1 Introduction
Today, agriculture in Cameroon and the rest of the world is a sensitive area from a social, economic and environmental point of view. With growing demographic pressure and the need for increased agricultural production, it has become essential to optimize the production of agricultural resources (World Bank, 2008). In its broadest sense, agriculture is defined as all the work involved in transforming the natural environment to produce plants for human use. In Cameroon, agriculture is the key to the country's developing economy. It contributes 23% to the country's gross domestic product (GDP), with over 60% of the general Cameroonian population engaged in this activity, enabling the country to achieve its sustainable development goals and alleviate or reduce poverty. Nevertheless, agriculture can prove highly vulnerable in the modern economic context. In view of the growing pressure on land in the Centre Region due to infrastructure development and the search for new opportunities, it is important to identify the best land for agriculture, so that this suitable land is used primarily for agricultural projects.
The purpose of spatial planning is to guide land-use decisions to enable humans to derive maximum benefits from environmental resources, while ensuring their conservation for the future. It takes into account the productive capacity of each type of soil and the characteristics surrounding these soils (FAO, 1997). Geographic information systems (GIS) have their applications in this study in order to make a multi-criteria analysis and subsequently, it will be possible to determine the accessibility to these different areas suitable for agriculture by combining this with the accessibility data.
The general objective of this work is to map agricultural land in order to assess its different potentialities. The general objective of this work is to map agricultural land in order to assess its different potentialities. To achieve this objective, the areas and their agricultural potentials were identified and the accessibility to these areas was determined. To achieve this objective, the areas and their agricultural potentials were identified and the accessibility to these areas was determined.
2 Methodology
The methodology used in our study, follows five steps, that of the five "A's": (Abstraction, Acquisition, Archiving, Analysis, Display).
2.1 Abstraction
This is the first step and consists of laying the foundations for our work by determining how to collect, represent and store within the system's database, the spatial information and data essential to the project. These data meet the needs and analysis requirements of the study. A conceptual data model and a logical data model are developed at the end of this step.
2.2 Acquisition
Acquisition represents data collection; it is divided into two parts: preliminary data acquisition and field data acquisition.
The preliminary data concern all the information that can be obtained on the study area without having to travel to the field or from specific services installed within the same study area. For this first category of data to be collected, the Internet has been a very important source of information from which many documents can be downloaded as well as many free GIS data (open data: shape files, satellite images, digital models, etc.). Field data were collected within the study area in two ways: the first was to survey the services installed on site to retrieve alphanumeric documentary data (documents, reports, research work, articles of law, topographical or thematic maps, statistical tables, photos, etc.). The second was the actual collection of geographical coordinates of key space objects using collection devices (tablet, GPS) in the study area.
2.3 Archiving
The archiving of the collected data was carried out in an organized manner respecting the constraints defined during the realization of the conceptual data model, but above all in such a way as to be able to easily find and access the stored information when it comes to querying the database for subsequent analysis.
2.4 Analysis
The analysis of the data made it possible to set up certain specific queries and to present the results according to the axes that were specified and redefined during the abstraction
Spatial analysis differs according to whether it is based on semantic data or geometric data. Semantic spatial analysis is based on the study, through queries or calculations, of alphanumeric data in order to qualitatively or quantitatively describe certain characteristics. This description is often done in a cartographic manner and must respect the rules of graphic semiology. Unordered qualitative data is represented by different colors, shapes, differences in textures, or orientation. Ordered qualitative or relative quantitative data is represented by a gradient of a single color or the display of values. Absolute quantitative data are represented by a change in size. Geometric spatial analysis is the study of shapes, positions, and relationships between objects, such as calculating distances, intersections, or exclusions. It is then possible to work on the topology. These analyses are possible thanks to the various functionalities offered by GIS software (Maguire, 1991).
2.5 Display
In this last step, the results of the analyses carried out in the previous step will be presented graphically. This requires a good command of graphic semiology and cartographic language so that the graphic documents of the project are as understandable as possible and so that the message conveyed by these documents is easily interpretable even by non-specialists in the analysis of geographic information.
2.6 Methods used
2.6.1 Data collection and archiving. The first phase will be the collection of data via the internet. The second phase was the collection of data from the MINADER services. Then the third phase of the collection took place in the study area. Data were projected to the WGS84 UTM 32north coordinate system
Agricultural data
Here, it is a question of organizing the agricultural system in a general way in such a way as to have a global, clear and unambiguous view of everything directly related to agriculture and the factors impacting it. These factors include among others, the types of soil, agricultural suitability.
Non-agricultural data
These are the elements that are economic and biophysical, natural or not, but that have an impact on agriculture. These include the Relief, Slopes and Land Use, Accessibility Pathways and Socio-Economic Factors and Administrative Dedistricting.
2.6.2 Preparation of basic cartographic elements.
1 Choice of general parameters
In view of the various intrinsic and extrinsic factors that influence agriculture, and in the case of this study, we chose five analysis parameters which are:
- Soil types and cultivation skills
- Land use
- Hydrography
- Relief and slopes
- Accessibility
For each parameter mentioned above, the data were divided into three distinct classes and to each of the classes a favorability index was assigned in order to make it possible to overlay the parameters.
Table 1. Favorability index per parameter
Class for each parameter |
Favorability Index |
Favorable |
3 |
Averagely favorable |
2 |
Unfavorable |
1 |
Thus, several thematic maps have been carefully prepared and centered on these four analytical parameters. Each of these parameters was given a weight according to its importance and the impact it has on such an analysis.
Table 2. Analytical criteria and their weights
Parametre analysed |
Weight |
% weight |
Cultural suitability |
3.7 |
37 |
Slopes |
2.2 |
22 |
Soil Occupation |
2.2 |
22 |
Hydrography |
1.9 |
19 |
2 Parameter analysis
Soil types
The soil of the Centre Region, with an area of 68,953 km², is mainly ferralitic and generally fertile. We also find variations in soil types in this area. Their physical characteristics and level of fertility are essential factors for assessing agricultural potential. They determine the choice of species and their yields.
The determination of soil types and their variations in the study area made it possible to extract land suitable for agriculture. To obtain this important data for our analysis, we geo-referenced and digitized the soil map of the Central Region (OSFACO, 2019). The cultural suitability of the land was defined according to the soil types present. For each soil type presented, we assessed its cultivation suitability. Crop suitability corresponds to the current capacity of each unit to support the development of cropping systems in the region. It should be noted that no classification of abilities will remain entirely fixed, but will evolve according to uses and development methods.
It should be noted that soil classification is complex, and there are other categories of soils based on different factors such as texture, structure, and chemical composition.
The process consisted of grouping the soil units into three classes of suitability:
Table 3. Soil Classification in the Centre Region
Types of soils in the center region |
Class |
Ferrallitic soils |
Favorable |
Raw or poorly developed mineral soils |
Averagely favorable |
Pseudogley soils |
Averagely favorable |
Indurated soils |
Unfavorable |
Sesquioxide soils |
Averagely favorable |
Sesquioxide and hydromorphic soils |
Averagely favorable |
Low ferralitic soils |
Averagely favorable |
Poorly developed or sesquioxide soils |
Averagely favorable |
Oligotrophic peat soils |
Unfavorable |
Erosional soils |
Unfavorable |
Relief
Topography and slopes determine the cropping systems practised and certain slope thresholds are limits for the optimal development of agriculture. The slope map makes it possible to extract wetlands from lowlands, plains, and then areas with steep slopes, unfavourable to agriculture. To do this, we were able to acquire it from the "Digital Elevation Model (DEM)" of the Cameroon region.
Thus, after the delineation of the study area, we were able to draw up maps of the relief and slopes. Three slope classes have been defined in relation to their potential for agricultural development. Slope constraints were assessed by their percentage value (%), which will also indicate land use opportunities.
Land use
Land cover refers to the allocation and use of land for specific purposes, such as agriculture, human settlement, industry, protected natural areas, and transport infrastructure. It can vary considerably from region to region depending on economic activities, population density, land-use planning policies and the natural environment.
Land cover is often mapped to provide detailed information on how land is used and distributed. Land cover data is used in many fields, such as urban planning, agriculture, nature conservation, natural resource management, and natural hazard assessment. Land cover classifications can vary from country to country, but they usually include categories
The observation and analysis of land cover is essential for sustainable land use planning and management, in order to minimize land use conflicts, preserve natural ecosystems, promote economic development and provide space for future uses.
Table 4. Categorization of land cover
OpenStreetMap class |
Land use class created |
Forest, nature reserve |
Forest |
Ochard, allotment, farmland, farmyard |
Agricultural areas |
Scrub, meadow, grass |
Low vegetation |
Water, riverbank, wetland |
Rivers, lakes and swamps |
Military, cemetery, quarry, residential, retail, park, commercial, industrial. |
Exploited areas |
Hydrography
Hydrography plays a crucial role in agriculture, as it directly influences water requirements, irrigation, and drainage on farms. The supply of rivers, lakes and reservoirs are essential sources of water for agriculture. Hydrography helps determine the availability and quality of these water sources, which is crucial to meeting the water needs of crops. A good understanding of local hydrography.
Road networks
Road accessibility is a critical factor in agriculture, as it allows for the transportation of agricultural products, equipment and inputs. Good road accessibility facilitates farming operations and reduces transportation costs. The Centre Region has several national, regional and departmental roads as well as rural roads and tracks. Primary and secondary roads must be in good condition, wide and capable of wide and capable of supporting the weight of agricultural vehicles.
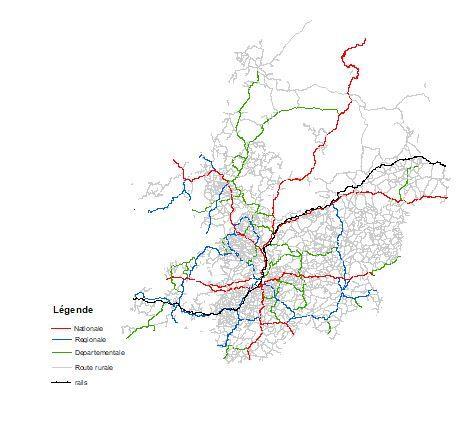
Figure 1. Central Communication Channels
Overlay of individual data
At the end of what resulted from the individual analyses for each criterion, a rasterization process was set up in order to allow the superposition of our different basic cartographic elements. For each of the analysis items, a raster was created using the ArcGIS ‘raster projection’ option, and each of these layers was assigned a cell size (x, y) of 30.30 and a WGS_1984_UTM_Zone_32N projection, with the aim of making it possible to overlap between layers.
3 Results and Discussions
3.1 Soil types and cultivation suitability
The majority of soils are low in ferralitic due to their low concentrations of iron and aluminum, which gives the soils their reddish or yellowish appearance. It should be noted that soil classification is complex and none remains fixed over time. The cultivation suitability of the land was established on the basis of the physical, chemical and biological properties of the land as follows:
Table 5. Surface area of cultural suitability and proportions of total surface
Crop Suitability Classes |
Favourability Index |
Surface area/ km² |
% surface |
Favorable |
3 |
9820,46 |
14% |
Averagely favorable |
2 |
56844,06 |
83% |
Unfavorable |
1 |
2233,12 |
3% |
According to this first representation, which is that of soil types and agricultural suitability, the moderately favourable areas are the most abundant (83%), as shown in Table 3-1 above. These moderately favourable areas are covered by soils with low ferralitic soils, sesquioxides and pseudogley, among others.
3.2 Hydrography
Throughout the region, the hydrographic network is dense, and in general there are several rivers of different extents, with the Sanaga being the most important with several tributaries. The Nyong, the Kellé, the Mékié are also other rivers present among others. For each body of water as it is, buffer zones have been identified that provide for a specific type of development.
Table 6. Superficies des zones tampons du réseau hydrographique
Water accessibility |
Buffer Zone |
Favourability index |
Surface area in km2 |
% surface |
Favorable |
0 – 10 km & 0-2 km |
3 |
42710,57 |
62% |
Averagely favorable |
10 – 15km & 2-3km |
2 |
11914,76 |
17% |
Unfavorable |
>15km & >3 km |
1 |
14293,61 |
21% |
The areas that are therefore favorable are 42710.57 km2 and cover 62% of the region. This is followed by 17% who are moderately accessible in terms of water and lastly, 21% who are unfavourable in terms of water accessibility. It should be noted that these different buffer zone boundaries are not fixed and are
3.3 Relief and slope
The Centre Region has a mountainous relief and variable altitudes. At some points the altitudes can go up to 1580 m. This very varied relief offers a wide choice of crops.
Table 7. Slope level and surface area
Slope class |
Land use potential |
Favourable index |
Surface area in km2 |
% surface area |
0 – 16 % |
Favorable (with the possibility of mechanization) |
3 |
65099,99 |
93% |
16 – 30 % |
Moderately favourable |
2 |
3209,21 |
5% |
>30% |
Unfavourable |
1 |
482,02 |
2% |
These elevation values gave way to the slope map with the different slope thresholds represented by different colors. From 0 to 16% we have slope thresholds favourable to agriculture with the possibility of mechanised agriculture. This is the use of machinery such as tractors, sprayers, seed drills, among others, in order to carry out agricultural tasks and thus increase production. From 16 to 30 per cent, slope thresholds are moderately favourable and cover an area of 3209.21 km2 and beyond 30% the slopes are unfavorable with 482.02 km2.
4 Soil occupation
This is a very important element in all studies, because it gives us an idea of how the territory is developed. The vast majority of the region is covered by forests and another part by low vegetation. This leaves a large area that is still unexploited.
Table 8. Evaluation of soil occupation
Class |
Soil occupation |
Favorability index |
Surface area in km² |
% surface |
Favorable |
Forest, agricultural zone |
3 |
61236,31 |
87% |
Averagely favorable |
Lowland vegetation |
2 |
8521,05 |
11% |
Unfavorable |
Exploited zones |
1 |
1027,39 |
2% |
Forests and agricultural areas are the most abundant and alone cover 61,236.31 km2 which are favourable to agriculture. This obviously confirms that the region still has vast exploitable land and it is therefore important to identify and highlight among these the best for agriculture. Also, 8,521.05 km2 are moderately favorable and 1,027.39 km2 unfavorable.
4.1 Accessibility
Accessibility is ultimately determined when the remaining four map elements are evaluated. For the entire road network consisting of national, regional, departmental and railway roads as shown in Table 9.
Table 9. Classification of roads and their conditions
Road Classification |
Road Condition |
National |
Coated |
Régional |
Coated |
Divisional |
Coated |
Rural |
unpaved |
For these four different classes of roads, buffer zones have been defined to assess the accessibility of these roads. The condition of these roads varies depending on the level and quality of maintenance. We thus find the national roads averagely paved or poor condition due to poor maintenance of the latter. So it goes with all other roads. The accessibility assessment will be based mainly on paved roads and will not take into account tracks and paths.
For roads, buffer zones have been defined to determine accessibility levels.
Table 10. Accessibility assessment
Buffer zone |
Assessments in terms of accessibility to suitable areas |
0 – 15 km |
Accessible |
> 15 km |
Inaccessible |
These buffer zones have been defined for the purpose of this study and can be adapted as needed.
Table 11. Area: Accessible and inaccessible areas.
Road networks |
Buffer tampon |
Superface area/ km² |
% surface |
Accessible zones |
0 – 15 km |
49740,04 |
73% |
Inaccessibles zones |
>15km |
19178,91 |
27% |
For the buffer zones defined above, it appears that 73% or 49,740.04 km2 are accessible by road against 19,178.91 km2 inaccessible.
4.2 Suitable areas for agriculture
The synthesis of the results was made possible by the rasterization process that was carried out in the second chapter, which made it possible to display the areas suitable for agriculture.
Table 12. Suitable surface areas for agriculture and total % surface
Suitable surface areas for agriculture |
Surface area in km2 |
% surface |
High |
8690,69 |
13% |
Average |
51784,41 |
74% |
Weak |
5206,04 |
8% |
Marginal |
3237,79 |
5% |
TOTAL |
68918,87 |
100% |
• Classes with high agricultural potential
This is land with good potential for agricultural development with suitable soils, with a low slope between 0 and 16%, deep soil with the possibility of mechanization. These areas also have good accessibility in terms of water and cover an area of 8690.69 km2, or 13% of the total area. Consisting mainly of forests, agroforestry, sustainable agriculture and organic farming can be practiced in these areas, they are favorable for crops such as cacao, palm tree and plantain trees.
• Class with medium agricultural potential
These are areas with a set of moderately serious limitations, but they are suitable for agriculture, depending on the types of development that will be carried out and the crops that will be grown with average slopes of 16 to 30%. Soils in this class are weakly ferralitic, sesquioxide and hydromorphic, among other things. This class occupies 74% of the area, i.e. 51784.41 km2. Increasing fallow time can allow for regeneration of vegetation cover of soils. It can also reduce soil degradation and increase soil productivity. Also, for an optimal exploitation of these important areas, food crops in corridors and reasoned rotation would limit soil degradation and guarantee good productivity and sustainable management of this unit.
• Class with low agricultural potential
These areas have serious limitations to the maintenance of cropping systems. They are unfavourable in terms of water accessibility, with slopes of more than 30% and therefore significant erosion risks. Exploited areas fall into this category as well as areas with indurated soils and erosion-prone soils. These constraints reduce the productivity of these areas, so that their agricultural potential is more than low. The development of cities and infrastructure must integrate certain agricultural practices such as urban agriculture to provide a better living environment and local food resources. Thus, to make the most of these spaces which cover 8% of the area, i.e. 5206.04 km2, specific developments must be made. In order to limit their degradation, which could be irreversible in a more or less short time horizon, the following valuation options should be considered: On the high peaks, the promotion of agroforestry based on perennial fruit trees would limit the risks of erosion and degradation. Priority should be given to the natural regeneration of vegetation to provide ecosystem services to the population (sustainable livestock farming, biodiversity, medicinal plants, protection of spring heads, and habitat for wildlife).
• Class with marginal agricultural potential
These are areas that are unsuitable for agriculture, such as missing data spaces, water surfaces, among others. These areas represent 3237.79 km2 of the region, i.e. 5%.
4.3 Acces determination to suitable zones
After the map of suitable areas for agriculture was established, the areas on the map that are in the accessible zone and those that are not have been extracted. This extraction is done for the three classes of high, medium and low potential soils. The extraction was done with the "extract by mask" tool on ArcGIS.
4.3.1. Zones accessibles et propices.
Tableau 13. Surface area for suitable and accessible zones
Suitable Agricultural zones |
Surface area in km2 |
% surface |
High and accessible |
5662,42 |
8% |
Average and accessible |
37144,95 |
55% |
Weak and accessible |
4238,96 |
6% |
TOTAL |
47046,29 |
69% |
The areas suitable for agriculture that are accessible represent 47046.29 km2 of the total area of the region. In this part of the region that is accessible, the high potential areas are 8%, the medium potential areas are 55% and the low potential areas are 6%. Therefore, in terms of accessibility, more than 69% of the area is from 0 to 15 km from a road, which will allow a good circulation of different agricultural products.
4.3.2. Inaccessible and suitable areas for agriculture.
Table 14. Area of suitable and inaccessible areas
Zones with agricultural potentiel |
Surface area in km2 |
% surface |
High & Inaccessible |
3028,27 |
5% |
Medium & Inaccessible |
14639,46 |
19% |
Weak and inaccessible |
967.12 |
2% |
TOTAL |
18634,85 |
26% |
For the previously shown inaccessible areas, the areas are such that 3028.27 km2 are high potential inaccessible, 14639.46 km2 are medium potential but inaccessible and 967.12 km2 are low potential and inaccessible. This provides a total of 26%, or 18634.58 of the inaccessible land.
Accessibility to these areas can be enhanced by densifying the road network in those places where accessibility is lacking. This will allow these areas to be exploitable and accessible.
5 Synthesis map
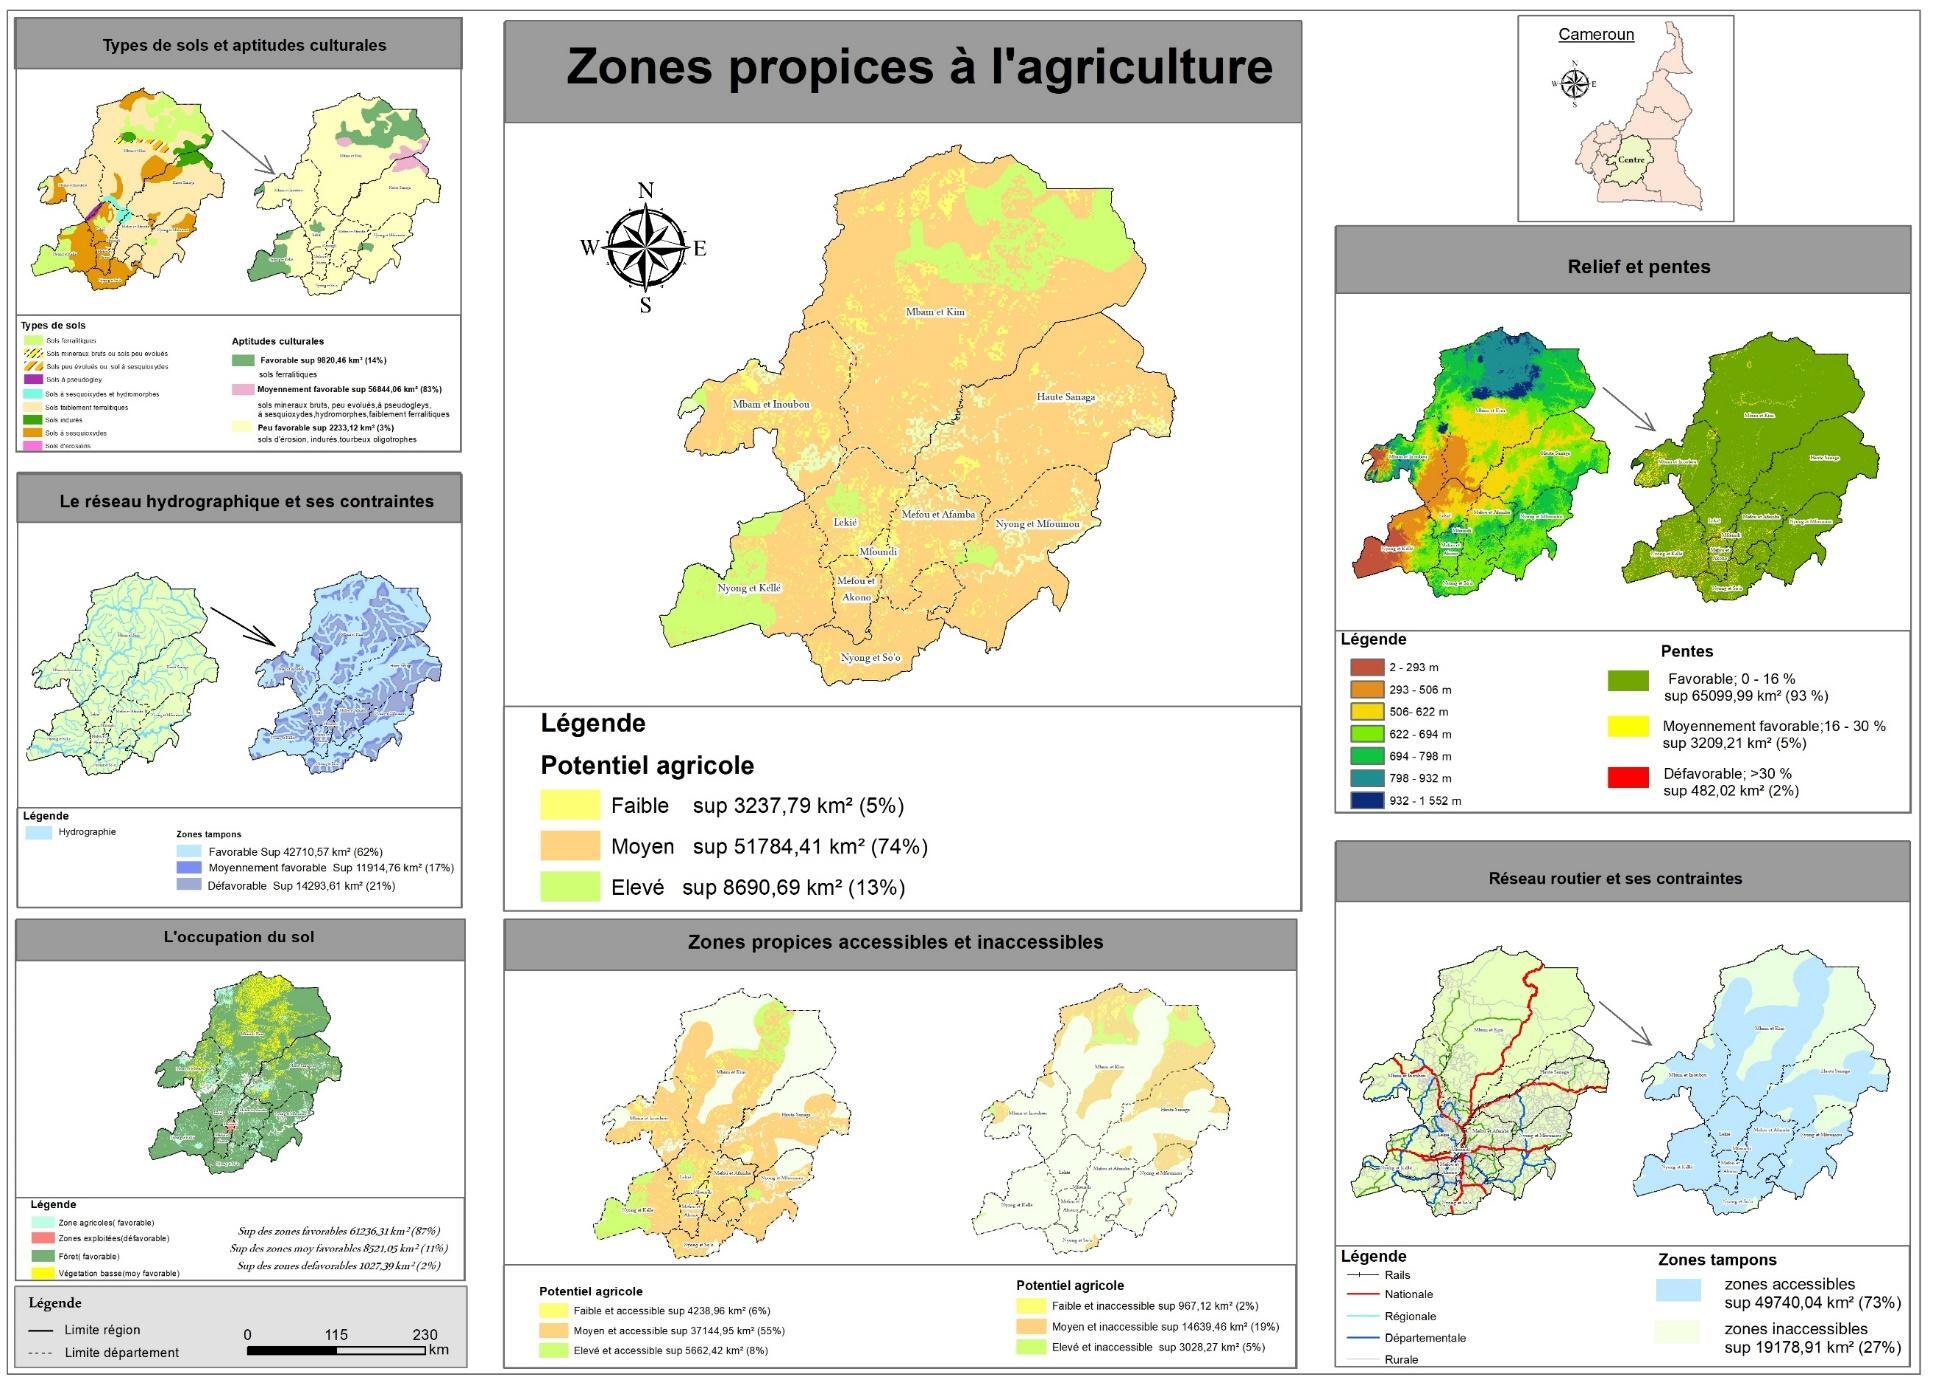 Figure 2. Synthesis map
6 Conclusion
On the surface area of the central region, which is 68,926 km², it was possible to provide precise and geo-located knowledge of the land suitable for agriculture as well as the various possible developments. We were therefore able to identify the different areas of the areas with different agricultural potentials based on the established Five A methodology. The rapid urbanization of the capital Yaoundé and surrounding areas on land, fueled by a constant influx of people seeking economic opportunities (jobs, trade, services), is having a significant negative impact on agricultural potential and increasing pressure on agricultural resources. The processing and superposition of the various maps of soil types and cultivation suitability, relief and slopes, hydrography and land cover have made it possible to Prepare maps of suitable areas for agriculture and determine their accessibility. The areas with high and accessible agricultural potential are 5662.42 km2, the areas with medium and accessible agricultural potential are 37144.95 km2 and the areas with low agricultural potential and accessible are 4238.96 km2. This gives a total of 47046.29 km2 or 69% of the area suitable for agriculture and accessible. With 26% of the region suitable and inaccessible. The creation and implementation of a map of areas suitable for agriculture are essential in planning and development decision-making in the Central Region. The synthesis map can help to think about land use planning and optimization. It will be able to specifically identify the best land suitable for agriculture in the Centre region, and will be a real support for planning, design and optimization of land use in international negotiations (agriculture, environment, Mining and Equine Industry) at the level of the ministries of state. It can be used by individuals who wish to launch a large-scale agricultural project.
Restrictions on access to certain information and data of the services of MINADER and other institutions have hampered this work. The information assigned was incomplete and other data were not available such as data on soil types, different growing seasons, climatic data that were not available, and other data were not available which could be taken into account.
It is therefore recommended to increase the number of mapping studies on soil types and their classifications and to update them over time. The road network should be densified in inaccessible areas in order to allow the movement of different agricultural products in order to stimulate the economy and thus meet the demand for lack of transport in these inaccessible areas.
References
[1]. World Bank. (2008). Agriculture for Development World Development Report. Washington: House of Press, 27.
[2]. FAO. (1977). Framework for Land Valuation: FAO Soil Bulletin .32p.
[3]. Maguire. (1991). Multi-criteria analysis, combinational mathematics and zero-one programming. Netherlands: Economic Institute.1979. (collection, 1979/16).
[4]. Aboubacar Camara, Slim Saidi, Laurent Gazull (2019). [14] Aboubacar Camara, Slim Saidi, Laurent Gazull (2019). Mapping and Assessing the Availability of Agricultural Land in Maritime Guinea: Satellite Images for Sustainable Land Management in Africa. Mapping and Assessing the Availability of Agricultural Land in Maritime Guinea: Satellite Images for Sustainable Land Management in Africa. OSFACO Mar 2019 Conference, Cotonou, Benin. OSFACO Mar 2019 Conference, Cotonou, Benin. 536
[5]. MINADER, 2000-2012, Yearbook of Agricultural Sector Statistics. Campaigns 1999-2000, 2000-2001, 2001-2002, 2004-2005, 2005-2006, 2006-2007, 2007-2008, 2009-2010. Campaigns 1999-2000, 2000-2001, 2001-2002, 2004-2005, 2005-2006, 2006-2007, 2007-2008, 2009-2010. http://www.minader.cm/uploads/.
Cite this article
Anicet,B.G.;Christelle,M.;MUNONGO,M.E. (2024). Mapping areas suitable for agriculture and their accessibility: The case of the centre region of Cameroon. Advances in Engineering Innovation,6,1-12.
Data availability
The datasets used and/or analyzed during the current study will be available from the authors upon reasonable request.
Disclaimer/Publisher's Note
The statements, opinions and data contained in all publications are solely those of the individual author(s) and contributor(s) and not of EWA Publishing and/or the editor(s). EWA Publishing and/or the editor(s) disclaim responsibility for any injury to people or property resulting from any ideas, methods, instructions or products referred to in the content.
About volume
Journal:Advances in Engineering Innovation
© 2024 by the author(s). Licensee EWA Publishing, Oxford, UK. This article is an open access article distributed under the terms and
conditions of the Creative Commons Attribution (CC BY) license. Authors who
publish this series agree to the following terms:
1. Authors retain copyright and grant the series right of first publication with the work simultaneously licensed under a Creative Commons
Attribution License that allows others to share the work with an acknowledgment of the work's authorship and initial publication in this
series.
2. Authors are able to enter into separate, additional contractual arrangements for the non-exclusive distribution of the series's published
version of the work (e.g., post it to an institutional repository or publish it in a book), with an acknowledgment of its initial
publication in this series.
3. Authors are permitted and encouraged to post their work online (e.g., in institutional repositories or on their website) prior to and
during the submission process, as it can lead to productive exchanges, as well as earlier and greater citation of published work (See
Open access policy for details).
References
[1]. World Bank. (2008). Agriculture for Development World Development Report. Washington: House of Press, 27.
[2]. FAO. (1977). Framework for Land Valuation: FAO Soil Bulletin .32p.
[3]. Maguire. (1991). Multi-criteria analysis, combinational mathematics and zero-one programming. Netherlands: Economic Institute.1979. (collection, 1979/16).
[4]. Aboubacar Camara, Slim Saidi, Laurent Gazull (2019). [14] Aboubacar Camara, Slim Saidi, Laurent Gazull (2019). Mapping and Assessing the Availability of Agricultural Land in Maritime Guinea: Satellite Images for Sustainable Land Management in Africa. Mapping and Assessing the Availability of Agricultural Land in Maritime Guinea: Satellite Images for Sustainable Land Management in Africa. OSFACO Mar 2019 Conference, Cotonou, Benin. OSFACO Mar 2019 Conference, Cotonou, Benin. 536
[5]. MINADER, 2000-2012, Yearbook of Agricultural Sector Statistics. Campaigns 1999-2000, 2000-2001, 2001-2002, 2004-2005, 2005-2006, 2006-2007, 2007-2008, 2009-2010. Campaigns 1999-2000, 2000-2001, 2001-2002, 2004-2005, 2005-2006, 2006-2007, 2007-2008, 2009-2010. http://www.minader.cm/uploads/.