


1 Intro
Remote sensing refers to the science and technology of using non-contact sensors or sensor systems installed on space, aerial, and other types of platforms to process and interpret data through automated and visual analysis, generate information using computerized and conventional mapping facilities, and apply the generated data and information to benefit society and meet its needs [1]. Semantic segmentation of remote sensing images is a technique that classifies each pixel in a remote sensing image into one of the predefined categories [2]. This process involves not only pixel-level classification of the image but also precise recognition of object boundaries within the image. Semantic segmentation of remote sensing images plays a crucial role in various fields, such as disaster assessment, forestry measurement, and environmental monitoring.
Bibliometric analysis, proposed by Pritchard (1969), is a mathematical and statistical method used to analyze relevant literature and understand global research trends in a specific field [3, 4]. Bibliometric analysis helps identify research gaps and directions in a particular area [5]. In recent years, researchers have applied this method to assess research trends in remote sensing and its applications in different scientific domains [6-10]. For example, Yang et al. [7] analyzed the research status and hotspots of deep learning in remote sensing change detection based on bibliometric analysis. Yan et al. [8] used bibliometric methods to analyze the literature related to remote sensing cloud computing platforms, revealing the development process, research hotspots, and application status of remote sensing cloud computing platforms. Huang et al. [9] utilized bibliometric methods to analyze the development trends of remote sensing discipline from 1962 to 2021, summarizing the research characteristics of China, the United States, and Europe in cutting-edge remote sensing technologies such as synthetic aperture radar, hyperspectral, and lidar. Mao et al. [10] reviewed the research progress of global wetland remote sensing from 1975 to 2020, exploring the development history and future trends in this field.
In recent years, the number of publications on semantic segmentation of remote sensing images has been increasing. Therefore, it is necessary to summarize the current status and development trends in this field. With the help of bibliometric methods, researchers can better understand the current number of publications and the journals in which these articles are published.
2 Methods and data collection
This study employs bibliometric methods to conduct an in-depth analysis of research trends in the field of semantic analysis of remote sensing. First, representative literature data in this field, including paper titles, authors, publication years, journals, countries, institutions, keywords, and other multi-dimensional information, were obtained by searching for keywords related to semantic analysis of remote sensing through the Web of Science Core Collection database. The main methods of this paper are:
a) Based on the co-word analysis theory [23], the co-occurrence network analysis method is applied to perform co-occurrence analysis on author keywords, generating a keyword co-occurrence network map. By calculating the link strength between keywords, the correlation degree between different research themes is revealed, identifying research frontiers and hot topics.
b) Employing the theory of science mapping, various visualization analysis tools, such as the biblioshiny package, are used to generate various charts, including the annual trend of publication volume, country/institution cooperation network map, etc., intuitively presenting the research situation and cooperation patterns in the field, and revealing the interaction between research entities.
c) Based on the theory of knowledge structure evolution, clustering analysis methods are used to perform clustering analysis on keywords [24], identifying the evolution path of research themes and emerging trends, grasping the development context of the field, and predicting future research directions.
d) Combining social network analysis theory [25], the cooperative relationships between countries and institutions are analyzed. By calculating the number of co-authored papers and total link strength, the degree of cooperation and influence between different countries and institutions are revealed, exploring the structural characteristics of the global scientific research cooperation network.
This study is based on the theoretical foundation of bibliometrics and comprehensively employs various quantitative analysis methods such as co-word analysis, clustering analysis, and social network analysis, combined with science mapping and visualization techniques. It conducts a systematic and in-depth analysis of the field of semantic analysis of remote sensing from multiple dimensions and perspectives. By revealing the current research status, hot topics, development trends, and cooperation patterns in this field, it provides comprehensive references and insights for relevant researchers, promoting theoretical innovation and practical application of semantic analysis techniques in remote sensing.
3 Metrological analysis and results
3.1 Trend analysis of paper output
In recent years, research in the field of semantic analysis of remote sensing has shown a significant growth trend, as specifically illustrated in Figure 1. Before 2000, relevant research was still in its infancy, with limited achievements, and the number of annual publications in the field remained at a low level, less than 100. However, after entering the 21st century, the number of annual publications began to increase substantially, with the number of papers published each year exceeding 100, highlighting the growing interest and investment of the academic community in the field of semantic analysis of remote sensing. Particularly since 2010, the growth in the number of annual publications has been even more significant, with the number of papers published each year in recent years exceeding 2,000, showing an accelerating development trend.
From the perspective of the cumulative number of publications, the growth curve exhibits a clear exponential growth pattern. This exponential growth trend indicates that academic research in the field of semantic analysis of remote sensing is in a thriving stage, with research results continuously accumulating and expanding. Based on the current growth rate, it is projected that by 2025, the cumulative number of publications in this field will approach 16,000, fully reflecting the active level of research and broad prospects in this field.
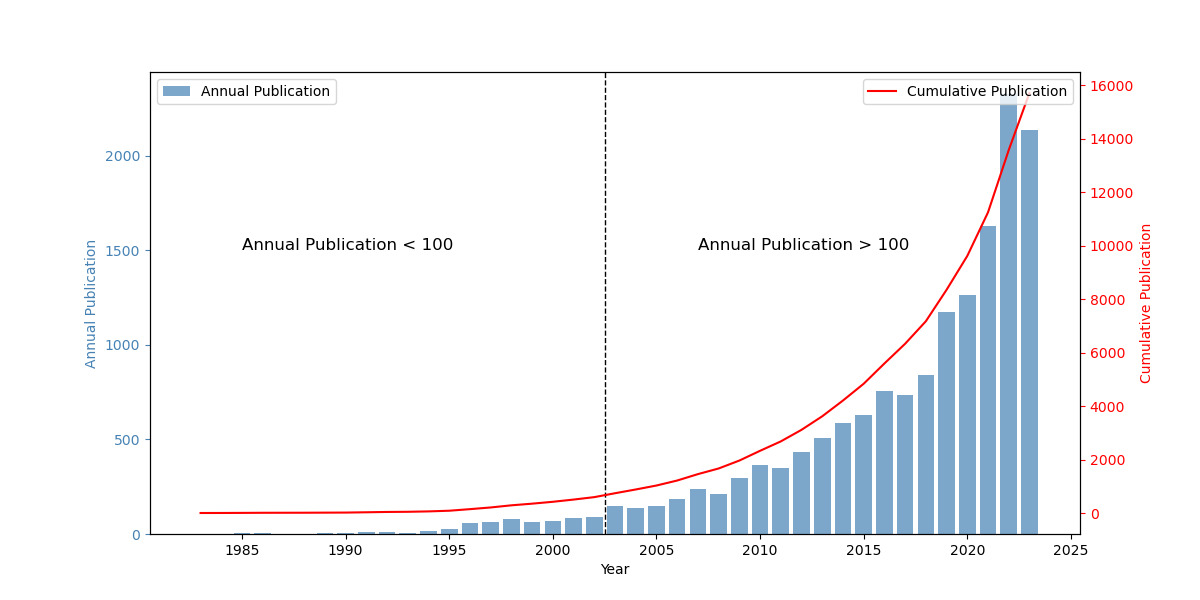
Figure 1. Cumulative Number of Annual Publications
Among all the subject categories covered in the articles on semantic segmentation in the field of remote sensing, the remote sensing topic ranks first with the highest number of papers, indicating that remote sensing technology is the core and focus of research in this field. Imaging science, photographic technology, and engineering electrical electronic also show high research activity, ranking second and third, respectively. In addition, many research results have been published in the fields of geosciences multidisciplinary, environmental sciences, and geophysics. In comparison, the number of papers in the fields of computer science information systems, optics, and computer science artificial intelligence is relatively small, but there is still a certain research foundation.
By visually analyzing the percentage of each subject category in the total number of publications through the pie chart in Figure 2, the distribution of proportions in different fields can be more intuitively presented. The field of remote sensing occupies a 27.3% share, becoming the largest research topic; imaging science photographic technology ranks second with a 21.0% share; engineering electrical electronic and geosciences multidisciplinary account for 12.3% and 12.1%, respectively; environmental sciences account for 9.0%; other fields have relatively smaller shares.
Combining the above analysis, it can be seen that research in the field of semantic analysis of remote sensing presents the characteristics of interdisciplinary and multi-field cross-integration. Remote sensing technology, as the core research object, is closely connected with multiple disciplines such as imaging science, engineering electronics, geosciences, and environmental sciences, forming rich and diverse research topics and directions. This multi-disciplinary cross-integration research pattern provides a broad space and opportunity for the innovative development of semantic analysis techniques in remote sensing.
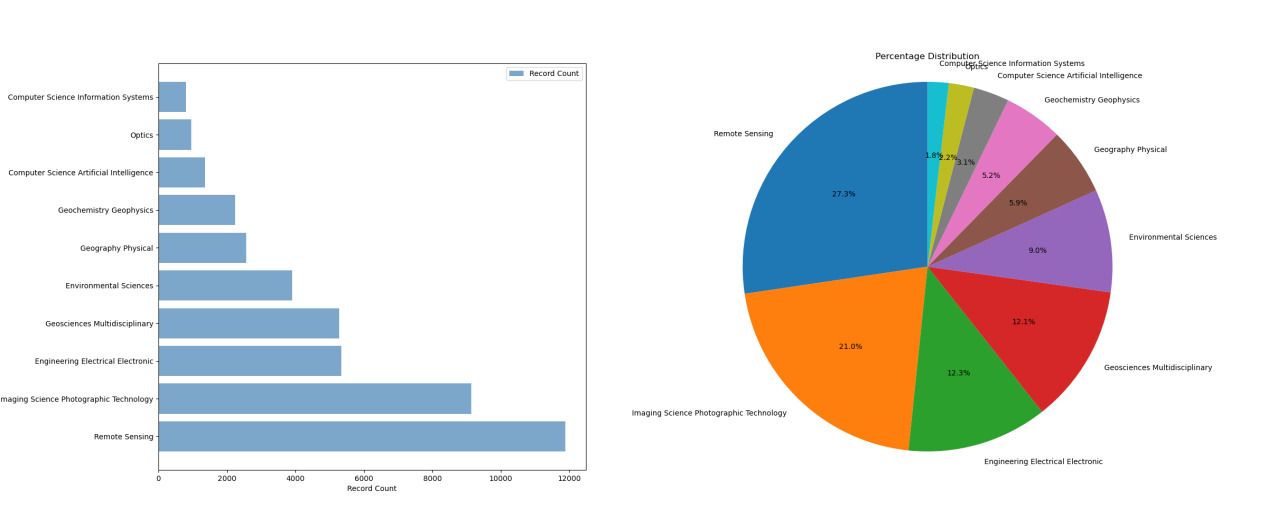
Figure 2. Top Ten Topic Categories and Their Proportion in Semantic Segmentation
By conducting statistical analysis on the main source journals of published papers in the field of semantic analysis of remote sensing, the most influential and authoritative academic journals in this field can be identified. According to the data in Table 1, "Remote Sensing" ranks first with 2,586 published papers, accounting for 15.532% of the total published papers, making it one of the most important academic journals in this field. "IEEE Transactions on Geoscience and Remote Sensing" ranks second with 1,443 papers, accounting for 8.667%, and is also an authoritative journal in this field. In addition, IEEE series journals such as "IEEE International Symposium on Geoscience and Remote Sensing IGARSS", "IEEE Journal of Selected Topics in Applied Earth Observations and Remote Sensing", and "IEEE Geoscience and Remote Sensing Letters" are also important publication platforms in this field, with the number and proportion of papers ranking at the top.
Apart from the above-mentioned journals, "International Journal of Remote Sensing", "Proceedings of SPIE", "International Archives of the Photogrammetry Remote Sensing and Spatial Information Sciences", "ISPRS Journal of Photogrammetry and Remote Sensing", and other journals are also important academic positions in the field of semantic analysis of remote sensing, publishing a large number of high-quality research results. These journals cover multiple related fields such as remote sensing, photogrammetry, and spatial information, reflecting the diversity and comprehensiveness of research in this field.
Table 1. Top 15 Main Source Journals in Research Field
Rank |
Name |
Number |
Percentage |
1 |
REMOTE SENSING |
2586 |
15.532 |
2 |
IEEE TRANSACTIONS ON GEOSCIENCE AND REMOTE SENSING |
1443 |
8.667 |
3 |
IEEE INTERNATIONAL SYMPOSIUM ON GEOSCIENCE AND REMOTE SENSING IGARSS |
1390 |
8.349 |
4 |
IEEE JOURNAL OF SELECTED TOPICS IN APPLIED EARTH OBSERVATIONS AND REMOTE SENSING |
848 |
5.093 |
5 |
IEEE GEOSCIENCE AND REMOTE SENSING LETTERS |
751 |
4.511 |
6 |
INTERNATIONAL JOURNAL OF REMOTE SENSING |
720 |
4.325 |
7 |
PROCEEDINGS OF SPIE |
644 |
3.868 |
8 |
INTERNATIONAL ARCHIVES OF THE PHOTOGRAMMETRY REMOTE SENSING AND SPATIAL INFORMATION SCIENCES |
577 |
3.466 |
9 |
ISPRS JOURNAL OF PHOTOGRAMMETRY AND REMOTE SENSING |
546 |
3.279 |
10 |
JOURNAL OF APPLIED REMOTE SENSING |
276 |
1.658 |
11 |
REMOTE SENSING OF ENVIRONMENT |
262 |
1.574 |
12 |
PHOTOGRAMMETRIC ENGINEERING AND REMOTE SENSING |
201 |
1.207 |
13 |
INTERNATIONAL JOURNAL OF APPLIED EARTH OBSERVATION AND GEOINFORMATION |
198 |
1.189 |
14 |
SENSORS |
192 |
1.153 |
15 |
IGARSS 2023 2023 IEEE INTERNATIONAL GEOSCIENCE AND REMOTE SENSING SYMPOSIUM |
188 |
1.129 |
3.2 Cooperative relationship between the state and institutions.
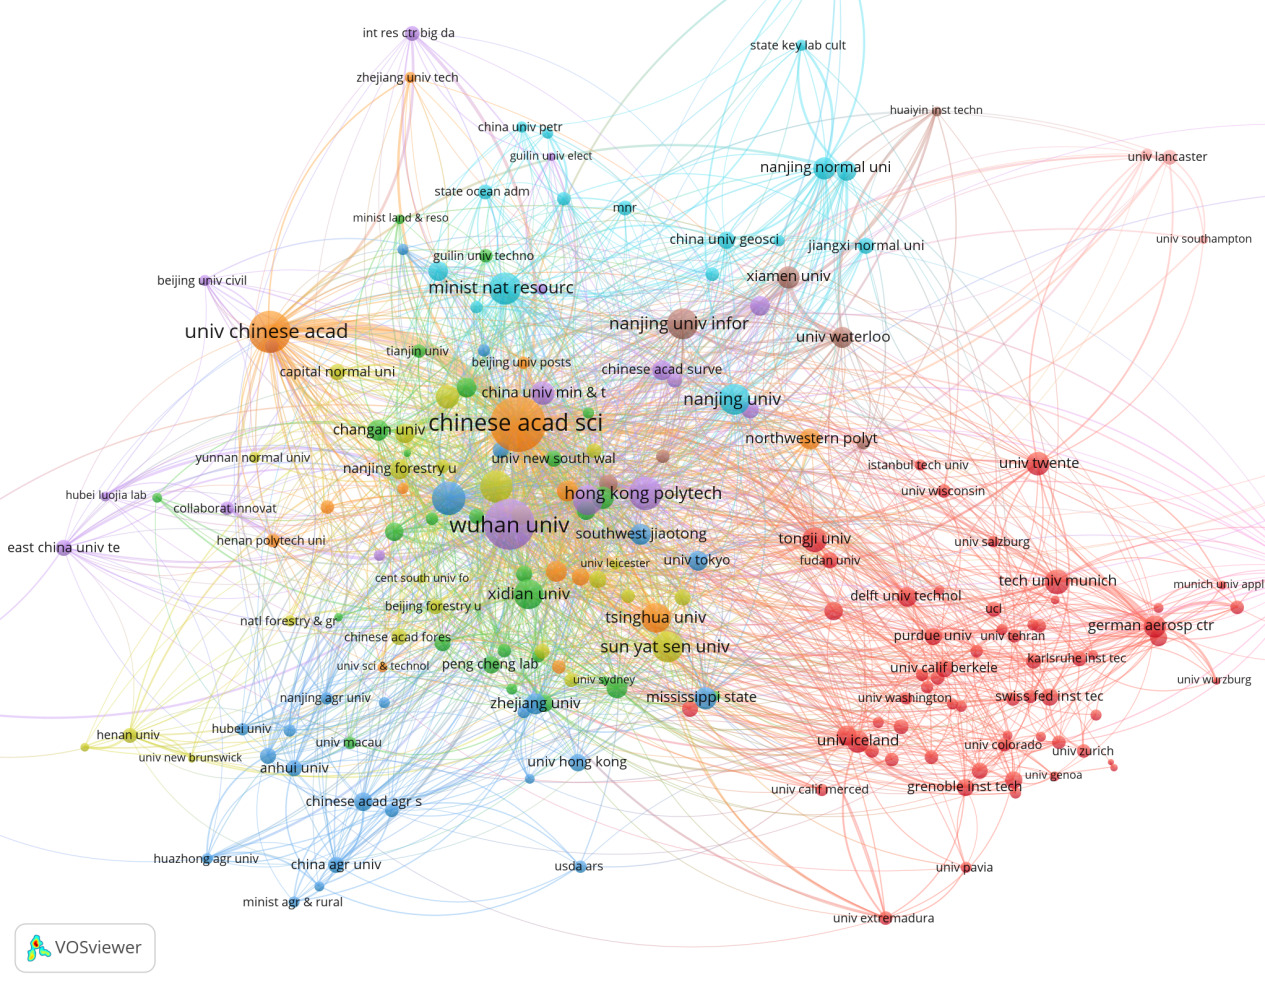
Figure 3. Institutional Cooperation Network Diagram
In the scientific research cooperation network diagram in the field of semantic segmentation, nodes and lines of different colors represent different research institutions and their cooperative relationships, with the size of the nodes indicating the research impact of the institution and the thickness of the lines reflecting the closeness of cooperation.
First, from the perspective of core institutions, the Chinese Academy of Sciences (Chinese Acad Sci) and Wuhan University (Wuhan Univ) are located at the center of the diagram, being the most active and influential research institutions in the field of semantic segmentation. These institutions maintain close cooperative relationships with numerous other institutions, demonstrating their important position in this field. In addition, Hong Kong Polytechnic University (Hong Kong Polytech) and Nanjing University (Nanjing Univ) are also located in core positions, further highlighting their significant influence in this field.
From the perspective of the cooperation network, Chinese universities and research institutions have formed a close cooperation network. For example, the cooperative relationships between institutions such as Nanjing University of Information Science and Technology (Nanjing Univ Infor), Zhejiang University (Zhejiang Univ), and Tsinghua University (Tsinghua Univ) are particularly close. This indicates that China not only has an extensive cooperation network in the field of semantic segmentation but also possesses strong research capabilities.
In terms of international cooperation networks, the red part of the diagram shows a large number of international cooperative institutions, such as the German Aerospace Center (German Aerosp Ctr), Swiss Federal Institute of Technology Zurich (Swiss Fed Inst Tec), Purdue University (Purdue Univ), and University of California, Berkeley (Univ Calif Berkeley). These international institutions also have relatively extensive cooperation with China's core institutions, indicating that the field of semantic segmentation is highly internationally collaborative.
Overall, research in the field of semantic segmentation has the characteristic of extensive international cooperation, with close links between institutions from different countries and regions. Chinese research institutions play a dominant role in research and cooperation in this field and maintain close cooperative relationships with research institutions worldwide. This extensive international cooperation promotes the development and application of semantic segmentation technology. Moreover, research hotspots in this field are not limited to the technology itself but also involve interdisciplinary applications and research, such as environmental science and geographic information systems.
3.3 Analysis of the common interest trend of the research.
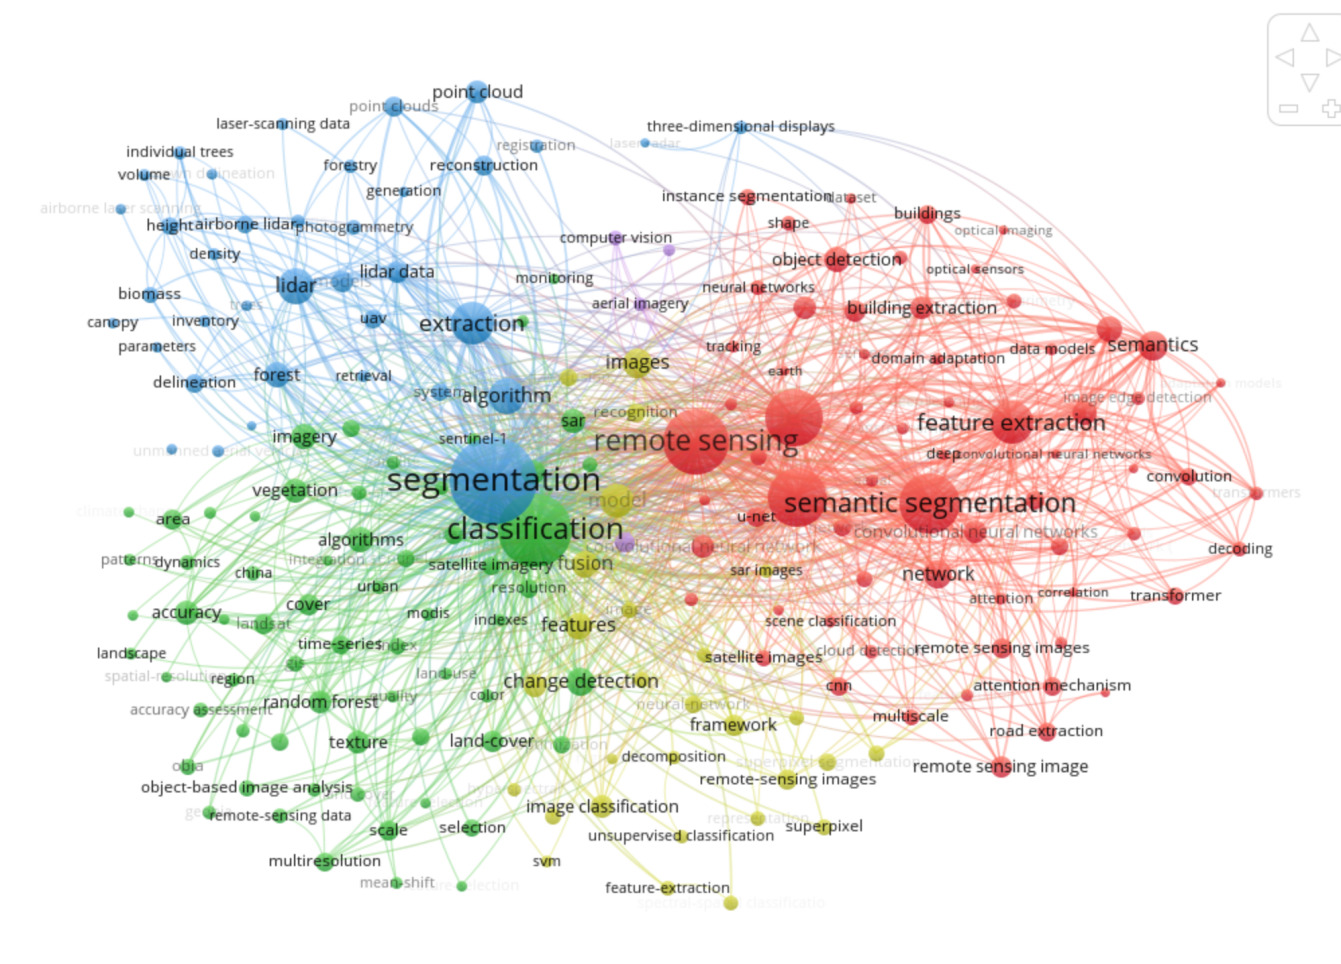
Figure 4. Keyword Co-occurrence Network
Keywords can systematically showcase the key directions and research interests in a field [11]. The changes in the attention of different terms within the field from 1992 to 2021 are displayed through a keyword co-occurrence network diagram. In the diagram, each term intersects with the timeline, and blue dots represent the frequency of occurrence of that term each year, with the size of the dots indicating the intensity of attention. Through this diagram, some research trends and changes in focus can be observed.
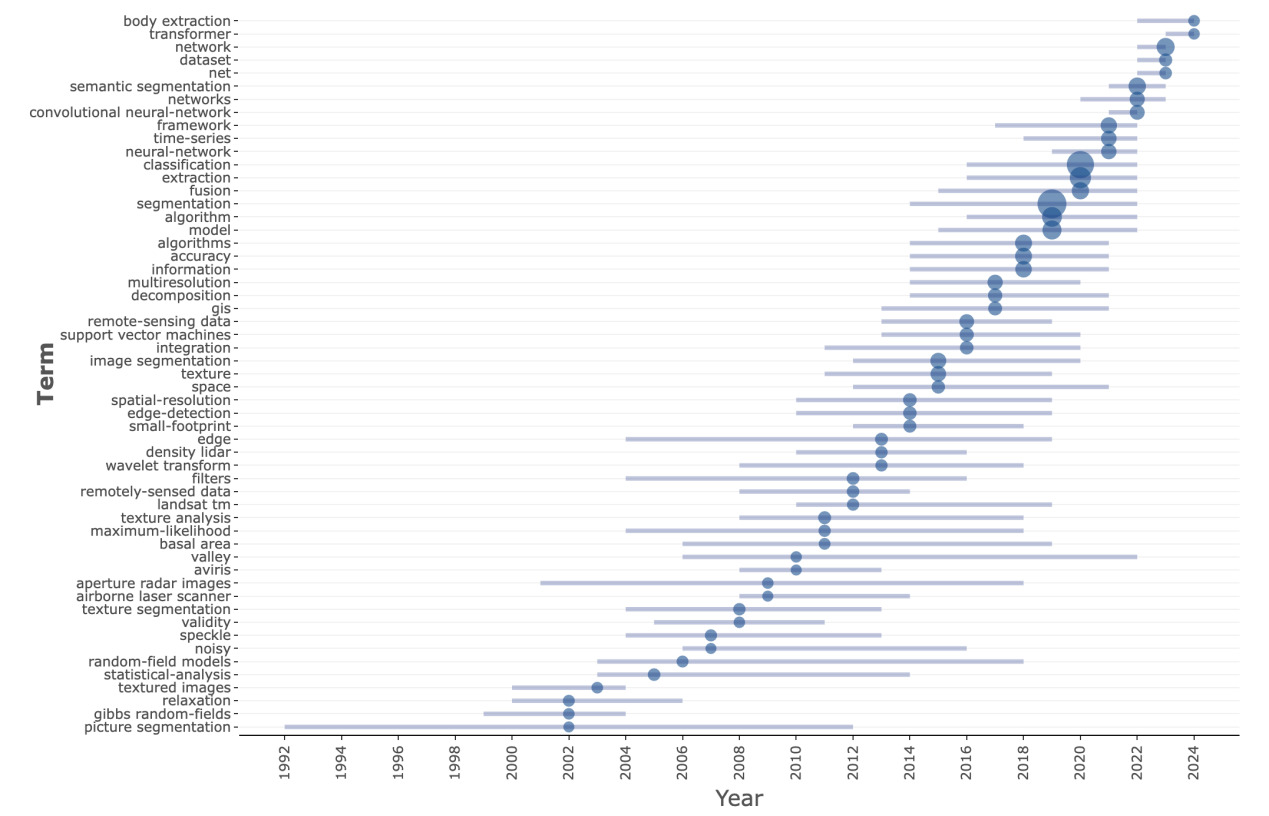
Figure 5. Keyword Co-occurrence Trend Analysis
In the early stage (around 1992-2005), research primarily focused on fundamental remote sensing and image processing techniques. For instance, maximum-likelihood classification methods [12] were employed for statistical analysis and classification, Geographic Information Systems (GIS) were utilized for geospatial data analysis and management [13], texture analysis [14] and texture segmentation were applied for image segmentation and recognition, and Support Vector Machines (SVMs) were used as machine learning methods for classification and regression analysis [15].
During the middle stage (around 2005-2015), research attention gradually shifted towards more advanced image processing algorithms. For example, image segmentation [16] and image fusion [17] became crucial techniques for processing and analyzing images, multiresolution methods [18] were used to handle images with varying resolutions, spatial-resolution and small-footprint [19] were employed for high-precision image analysis, and the usage frequency of SVMs continued to increase.
In the recent stage (around 2015-2021), research focus has primarily concentrated on deep learning and neural network-related technologies, which have become increasingly important in remote sensing image processing and analysis. For instance, Convolutional Neural Networks (CNNs) [20] and neural networks are utilized for complex image analysis and classification, semantic segmentation [2][21] as an advanced image segmentation technique can identify specific objects and regions within images. Moreover, frameworks and datasets serve as crucial resources to support and drive deep learning research, algorithms and models are used to enhance image processing capabilities, and transformers, as an emerging deep learning architecture, are starting to gain traction in image processing applications [22].
These trends illustrate that over time, the research emphasis in the remote sensing field has gradually transitioned from traditional image processing techniques to deep learning and artificial intelligence technologies. This indicates that the development and application of technology are continuously advancing, and researchers are placing increasing importance on utilizing state-of-the-art neural networks and deep learning models to improve the accuracy and efficiency of remote sensing image processing and analysis.
4 Conclusion and discussion
The study still has some limitations. First, the single database we used does not index all scientific journals and subject books, which may exclude some relevant articles. For example, some literature on this topic from government agencies and other non-profit organizations may be excluded. Expanding the search scope to multiple databases, such as Scopus and Google Scholar, would help reduce omissions in the analysis. Limiting the search scope to include only "remote sensing" is unlikely to include all remote sensing applications. This challenge may be addressed when bibliometric analysis searches can include the full text of published articles using improved techniques (such as big data and artificial intelligence) rather than using limited and selected keyword combinations.
In summary, research in the fields of semantic segmentation and remote sensing is constantly evolving and deepening, and international cooperation and interdisciplinary exchanges will become important forces driving technological innovation. Through the analysis of the scientific research cooperation network in the field of semantic segmentation and the keyword co-occurrence network in the field of remote sensing, we can see that Chinese research institutions dominate the field of semantic segmentation and maintain close cooperation with research institutions around the world. At the same time, the research focus in the field of remote sensing is also constantly changing, from basic remote sensing and image processing techniques in the early stage, to advanced image processing algorithms in the middle stage, and then to deep learning and neural network technologies in the recent stage. Researchers are constantly exploring and applying new technologies to improve the accuracy and efficiency of remote sensing image processing and analysis.
In the future, deep learning and artificial intelligence technologies will continue to dominate the research direction in the fields of semantic segmentation and remote sensing, and open-source frameworks and datasets will play an increasingly important role. At the same time, practical applications will become an important driving force for research, promoting the continuous progress and improvement of technology. As semantic segmentation and remote sensing technologies continue to develop, they will be applied in more fields, such as environmental science, geographic information systems, urban planning, etc., promoting cooperation between different disciplines and driving technological innovation and application. We have reason to believe that in future developments, semantic segmentation and remote sensing technologies will make greater contributions to the sustainable development of human society.
References
[1]. Jia, K., Yao, Y., Wei, X., Gao, S., Jiang, B. and Zhao, X. (2013). A review on fractional vegetation cover estimation using remote sensing. Advances in Earth Science, 28(7), p.774.
[2]. Li, Y. S., Wu, K., Ouyang, S., Yang, K., Li, H. P., and Zhang, Y. J. (2024). Geographic knowledge graph-guided remote sensing image semantic segmentation. National Remote Sensing Bulletin, 28(2), 455-469. doi:10.11834/jrs.20231110.
[3]. Khudzari, J.M., Kurian, J., Tartakovsky, B., and Raghavan, G.V. (2018). Bibliometric analysis of global research trends on microbial fuel cells using Scopus database. Biochemical Engineering Journal, 136, 51-60.
[4]. Zou, X., Yue, W.L., and Le Vu, H. (2018). Visualization and analysis of mapping knowledge domain of road safety studies. Accident Analysis & Prevention, 118, 131-145.
[5]. Geng, Y., Chen, W., Liu, Z., Chiu, A.S., Han, W., Liu, Z., Zhong, S., Qian, Y., You, W., and Cui, X. (2017). A bibliometric review: Energy consumption and greenhouse gas emissions in the residential sector. Journal of Cleaner Production, 159, 301-316.
[6]. Hu, K., Qi, K., Guan, Q., Wu, C., Yu, J., Qing, Y., Zheng, J., Wu, H., and Li, X. (2017). A scientometric visualization analysis for night-time light remote sensing research from 1991 to 2016. Remote Sensing, 9(8), p.802.
[7]. Yang, B., Mao, Y., Chen, J., Liu, J. Q., Chen, J., and Yan, K. (2023). Review of remote sensing change detection in deep learning: Bibliometric and analysis. National Remote Sensing Bulletin, 27(9), 1988-2005. doi:10.11834/jrs.20222156.
[8]. Yan, K., Chen, H. M., Fu, D. J., Zeng, Y. L., Dong, J. W., Li, S. W., Wu, Q. S., Li, H. L., and Du, S. Y. (2022). Bibliometric visualization analysis related to remote sensing cloud computing platforms. National Remote Sensing Bulletin, 26(2), 310-323. doi:10.11834/jrs.20211328.
[9]. Huang, M. R., Jian, H. D., Xu, C., Hao, J. S., Yan, J., Liu, L. Y., Fan, X. T., and Guo, H. D. (2023). Bibliometrics spatial-temporal evolution analysis of the development of remote sensing. National Remote Sensing Bulletin, 27(11), 2449-2466. doi:10.11834/jrs.20232659.
[10]. Mao, D. H., Wang, Z. M., Jia, M. M., Luo, L., Niu, Z. G., Jiang, W. G., and Sun, W. W. (2023). Review of global studies on the remote sensing of wetlands from 1975 to 2020. National Remote Sensing Bulletin, 27(6), 1270-1280. doi:10.11834/jrs.20231022.
[11]. Liu, F., Lin, A., Wang, H., Peng, Y., and Hong, S. (2016). Global research trends of geographical information system from 1961 to 2010: a bibliometric analysis. Scientometrics, 106, 751-768.
[12]. Jiang, Q.X., and Liu, H.P. (2004). Extracting TM image information using texture analysis. Journal of Remote Sensing, (5), 458-464. doi:10.11834/jrs.20040512.
[13]. Zhang, J. T., and Wan, Q. (1999). Study on GIS integration platform framework architecture. Journal of Remote Sensing, (1). doi:10.11834/jrs.19990112.
[14]. Xu, J., and Zheng, J. (1990). A texture analysis technique to wavelength and direction extracting from ocean wave image. Journal of Remote Sensing, (4), 286-296. doi:10.11834/jrs.1990043.
[15]. Zhao, S.H., Feng, X.Z., Du, J.K., et al. (2003). SPIN-2 panchromatic and SPOT-4 multi-spectral image fusion based on support vector machine. Journal of Remote Sensing, (5), 407-411. doi:10.11834/jrs.20030511.
[16]. Liu, Y.X., Li, M.C., and Mao, L. (2006). An algorithm of multi-spectral remote sensing image segmentation based on edge information. Journal of Remote Sensing, (3), 350-356. doi:10.11834/jrs.20060354.
[17]. Qiu, D.D., Ma, H.C., Yang, Y., et al. (2006). A study of dam detection based on multi-source satellite images fusion. Journal of Remote Sensing, (4), 449-455. doi:10.11834/jrs.20060467.
[18]. Yang, Z.G., Huang, X.T., Zhou, Z.M. (2008). A 2-D GLR target detection approach of UWB SAR based on multi-resolution feature. Journal of Remote Sensing, (2), 239-245. doi:10.11834/jrs.20080231.
[19]. Sindhwani, V., Sainath, T., and Kumar, S. (2015). Structured transforms for small-footprint deep learning. Advances in Neural Information Processing Systems, 28.
[20]. Li, C.K., Zeng, Q.G., Fang, J., Wu, N., and Wu, K.H. (2021). Road extraction in rural areas from high resolution remote sensing image using an improved full convolution network. National Remote Sensing Bulletin, 25(9), 1978-1988. doi:10.11834/jrs.20219209.
[21]. Xiao, C.J., Li, Y., Zhang, H.Q., and Chen, J. (2020). Semantic segmentation of remote sensing image based on deep fusion networks and conditional random field. Journal of Remote Sensing (Chinese), 24(3), 254-264. doi:10.11834/jrs.20208298.
[22]. Wu, Q., Ni, K., and Zheng, Z. (XXXX). Remote sensing image scene classification based on two-stage high-order transformer. National Remote Sensing Bulletin, XX(XX), 1-13. doi:10.11834/jrs.20233332.
Cite this article
Lin,Y. (2024). A bibliometric analysis of semantic segmentation in remote sensing images from 1981 to 2024. Advances in Engineering Innovation,9,34-41.
Data availability
The datasets used and/or analyzed during the current study will be available from the authors upon reasonable request.
Disclaimer/Publisher's Note
The statements, opinions and data contained in all publications are solely those of the individual author(s) and contributor(s) and not of EWA Publishing and/or the editor(s). EWA Publishing and/or the editor(s) disclaim responsibility for any injury to people or property resulting from any ideas, methods, instructions or products referred to in the content.
About volume
Journal:Advances in Engineering Innovation
© 2024 by the author(s). Licensee EWA Publishing, Oxford, UK. This article is an open access article distributed under the terms and
conditions of the Creative Commons Attribution (CC BY) license. Authors who
publish this series agree to the following terms:
1. Authors retain copyright and grant the series right of first publication with the work simultaneously licensed under a Creative Commons
Attribution License that allows others to share the work with an acknowledgment of the work's authorship and initial publication in this
series.
2. Authors are able to enter into separate, additional contractual arrangements for the non-exclusive distribution of the series's published
version of the work (e.g., post it to an institutional repository or publish it in a book), with an acknowledgment of its initial
publication in this series.
3. Authors are permitted and encouraged to post their work online (e.g., in institutional repositories or on their website) prior to and
during the submission process, as it can lead to productive exchanges, as well as earlier and greater citation of published work (See
Open access policy for details).
References
[1]. Jia, K., Yao, Y., Wei, X., Gao, S., Jiang, B. and Zhao, X. (2013). A review on fractional vegetation cover estimation using remote sensing. Advances in Earth Science, 28(7), p.774.
[2]. Li, Y. S., Wu, K., Ouyang, S., Yang, K., Li, H. P., and Zhang, Y. J. (2024). Geographic knowledge graph-guided remote sensing image semantic segmentation. National Remote Sensing Bulletin, 28(2), 455-469. doi:10.11834/jrs.20231110.
[3]. Khudzari, J.M., Kurian, J., Tartakovsky, B., and Raghavan, G.V. (2018). Bibliometric analysis of global research trends on microbial fuel cells using Scopus database. Biochemical Engineering Journal, 136, 51-60.
[4]. Zou, X., Yue, W.L., and Le Vu, H. (2018). Visualization and analysis of mapping knowledge domain of road safety studies. Accident Analysis & Prevention, 118, 131-145.
[5]. Geng, Y., Chen, W., Liu, Z., Chiu, A.S., Han, W., Liu, Z., Zhong, S., Qian, Y., You, W., and Cui, X. (2017). A bibliometric review: Energy consumption and greenhouse gas emissions in the residential sector. Journal of Cleaner Production, 159, 301-316.
[6]. Hu, K., Qi, K., Guan, Q., Wu, C., Yu, J., Qing, Y., Zheng, J., Wu, H., and Li, X. (2017). A scientometric visualization analysis for night-time light remote sensing research from 1991 to 2016. Remote Sensing, 9(8), p.802.
[7]. Yang, B., Mao, Y., Chen, J., Liu, J. Q., Chen, J., and Yan, K. (2023). Review of remote sensing change detection in deep learning: Bibliometric and analysis. National Remote Sensing Bulletin, 27(9), 1988-2005. doi:10.11834/jrs.20222156.
[8]. Yan, K., Chen, H. M., Fu, D. J., Zeng, Y. L., Dong, J. W., Li, S. W., Wu, Q. S., Li, H. L., and Du, S. Y. (2022). Bibliometric visualization analysis related to remote sensing cloud computing platforms. National Remote Sensing Bulletin, 26(2), 310-323. doi:10.11834/jrs.20211328.
[9]. Huang, M. R., Jian, H. D., Xu, C., Hao, J. S., Yan, J., Liu, L. Y., Fan, X. T., and Guo, H. D. (2023). Bibliometrics spatial-temporal evolution analysis of the development of remote sensing. National Remote Sensing Bulletin, 27(11), 2449-2466. doi:10.11834/jrs.20232659.
[10]. Mao, D. H., Wang, Z. M., Jia, M. M., Luo, L., Niu, Z. G., Jiang, W. G., and Sun, W. W. (2023). Review of global studies on the remote sensing of wetlands from 1975 to 2020. National Remote Sensing Bulletin, 27(6), 1270-1280. doi:10.11834/jrs.20231022.
[11]. Liu, F., Lin, A., Wang, H., Peng, Y., and Hong, S. (2016). Global research trends of geographical information system from 1961 to 2010: a bibliometric analysis. Scientometrics, 106, 751-768.
[12]. Jiang, Q.X., and Liu, H.P. (2004). Extracting TM image information using texture analysis. Journal of Remote Sensing, (5), 458-464. doi:10.11834/jrs.20040512.
[13]. Zhang, J. T., and Wan, Q. (1999). Study on GIS integration platform framework architecture. Journal of Remote Sensing, (1). doi:10.11834/jrs.19990112.
[14]. Xu, J., and Zheng, J. (1990). A texture analysis technique to wavelength and direction extracting from ocean wave image. Journal of Remote Sensing, (4), 286-296. doi:10.11834/jrs.1990043.
[15]. Zhao, S.H., Feng, X.Z., Du, J.K., et al. (2003). SPIN-2 panchromatic and SPOT-4 multi-spectral image fusion based on support vector machine. Journal of Remote Sensing, (5), 407-411. doi:10.11834/jrs.20030511.
[16]. Liu, Y.X., Li, M.C., and Mao, L. (2006). An algorithm of multi-spectral remote sensing image segmentation based on edge information. Journal of Remote Sensing, (3), 350-356. doi:10.11834/jrs.20060354.
[17]. Qiu, D.D., Ma, H.C., Yang, Y., et al. (2006). A study of dam detection based on multi-source satellite images fusion. Journal of Remote Sensing, (4), 449-455. doi:10.11834/jrs.20060467.
[18]. Yang, Z.G., Huang, X.T., Zhou, Z.M. (2008). A 2-D GLR target detection approach of UWB SAR based on multi-resolution feature. Journal of Remote Sensing, (2), 239-245. doi:10.11834/jrs.20080231.
[19]. Sindhwani, V., Sainath, T., and Kumar, S. (2015). Structured transforms for small-footprint deep learning. Advances in Neural Information Processing Systems, 28.
[20]. Li, C.K., Zeng, Q.G., Fang, J., Wu, N., and Wu, K.H. (2021). Road extraction in rural areas from high resolution remote sensing image using an improved full convolution network. National Remote Sensing Bulletin, 25(9), 1978-1988. doi:10.11834/jrs.20219209.
[21]. Xiao, C.J., Li, Y., Zhang, H.Q., and Chen, J. (2020). Semantic segmentation of remote sensing image based on deep fusion networks and conditional random field. Journal of Remote Sensing (Chinese), 24(3), 254-264. doi:10.11834/jrs.20208298.
[22]. Wu, Q., Ni, K., and Zheng, Z. (XXXX). Remote sensing image scene classification based on two-stage high-order transformer. National Remote Sensing Bulletin, XX(XX), 1-13. doi:10.11834/jrs.20233332.