


1.Background
1.1.Site location
Bothkennar clay has been discovered on the south bank of the River Forth, situated approximately midway between the Scottish capital, Edinburgh, and the city of Glasgow. The site is a low-lying plain of approximately 11 hectares, surrounded on three sides by flood defenses. The site is situated on ground that was excavated from the mudflats in approximately 1784, in close proximity to the present estuary. A modest escarpment is observable in this location, which served as the western boundary of the site during the 18th century. The estuary currently exhibits a tidal range of 5.0 metres, with a maximum astronomical tide of +3.46 metres (OD) and a mean high water spring tide of +2.86 metres (OD).
1.2.Geological history
The Bothkennar caly were transported and deposited in shallow intertidal zones between 8500 and 6500 BP, a period characterized by rising sea levels and the predominance of a temperate climate, as proposed by Kailun Shen [1]. The rate of accretion initially exceeded or was equivalent to the rate of sea level rise. The average annual deposition is approximately 7mm of silt. Tidal erosion resulted in a 1-metre drop in the coastline's surface (2000 years ago), a halving of the salinity of estuarine water, and a further reduction in groundwater salinity through seepage leaching. At depths of 7–20 metres, the majority of sedimentation occurred in a saline environment. Subsequent processes included intergranular cementation, soil rebuilding, leaching, erosion and a decline in water levels. The deposition frequently occurred in tranquil, moderately sheltered waters with moderate salinity, at depths between 7 and 20 metres. The laminated and bedded facies would have been the products of a more active depositional environment. Subsequent processes include bonding, reworking, minor leaching, erosion of up to 1 m, and groundwater lowering of up to 2.75 m [2].
1.3.Site investigation
In accordance with the established criteria for classification, both mottled and laminated surfaces are designated as clayey silts. As Haight notes, the primary distinction between the two is the variation in clay content, with the mottled facies exhibiting a range of 28-36 per cent and the laminated facies a range of 19-30 per cent. The composition of the Bothkennar clays remains relatively stable with depth. The mineralogical composition of all beds is strikingly similar, comprising primarily quartz, feldspar, mica, illite, kaolinite and chlorite. The organic matter content typically ranges from 3 to 5 per cent, while the Gs values are usually between 2.6 and 2.7. The water content is observed to undergo a change with depth. The proportion of water present in the sample increases from approximately 35% at a depth of one metre to a maximum of approximately 80% at a depth of seven metres. The pH of the pore water is approximately 7.3. The bulk density at a depth of 5 metres below the crust is a minimum of 1.57 milligrams per cubic metre, after which it rises with depth; the rate of increase is higher below 12.5 metres. The soil is usually more compact when the organic matter has been removed. Following the removal of organic matter, soils are typically classified as highly plastic to very highly plastic clays or silts. The sensitivity St varies according to the specific formation when measured with a drop cone, with St values ranging from 5 to 8 for mottled formations, from 7 to 13 for bedded and laminated formations, and exhibiting the highest values at the boundaries of lithological units [3].
2.Laboratory test results of the reconstituted soil
2.1.Reconstituting process
In order to test the various properties of clay, it is very important to use the same samples in the laboratory. Burland [4] gives a standard method for reconstituting clay in the laboratory: the soil sample is consolidated at a moisture content of\( W_{L} \)<W<1.5\( W_{L} \)and without special drying (optimum conditions are 1.25\( W_{L} \)and one dimensional), so that the pore water in the reconstituted clay is close to the natural conditions. In this paper, a modified method is adopted to prepare the remodelling samples required for triaxial tests.
2.2.Data analyses
There are four specimens of reconstituted Bothkennar clay: B46 is the ISO normal consolidation test of reconstituted soil, B21&B22 are the one-dimensional normal consolidation and drainage shear tests of reconstituted soil, B71 is the one-dimensional normal consolidation and undrain shear test of reconstituted soil.
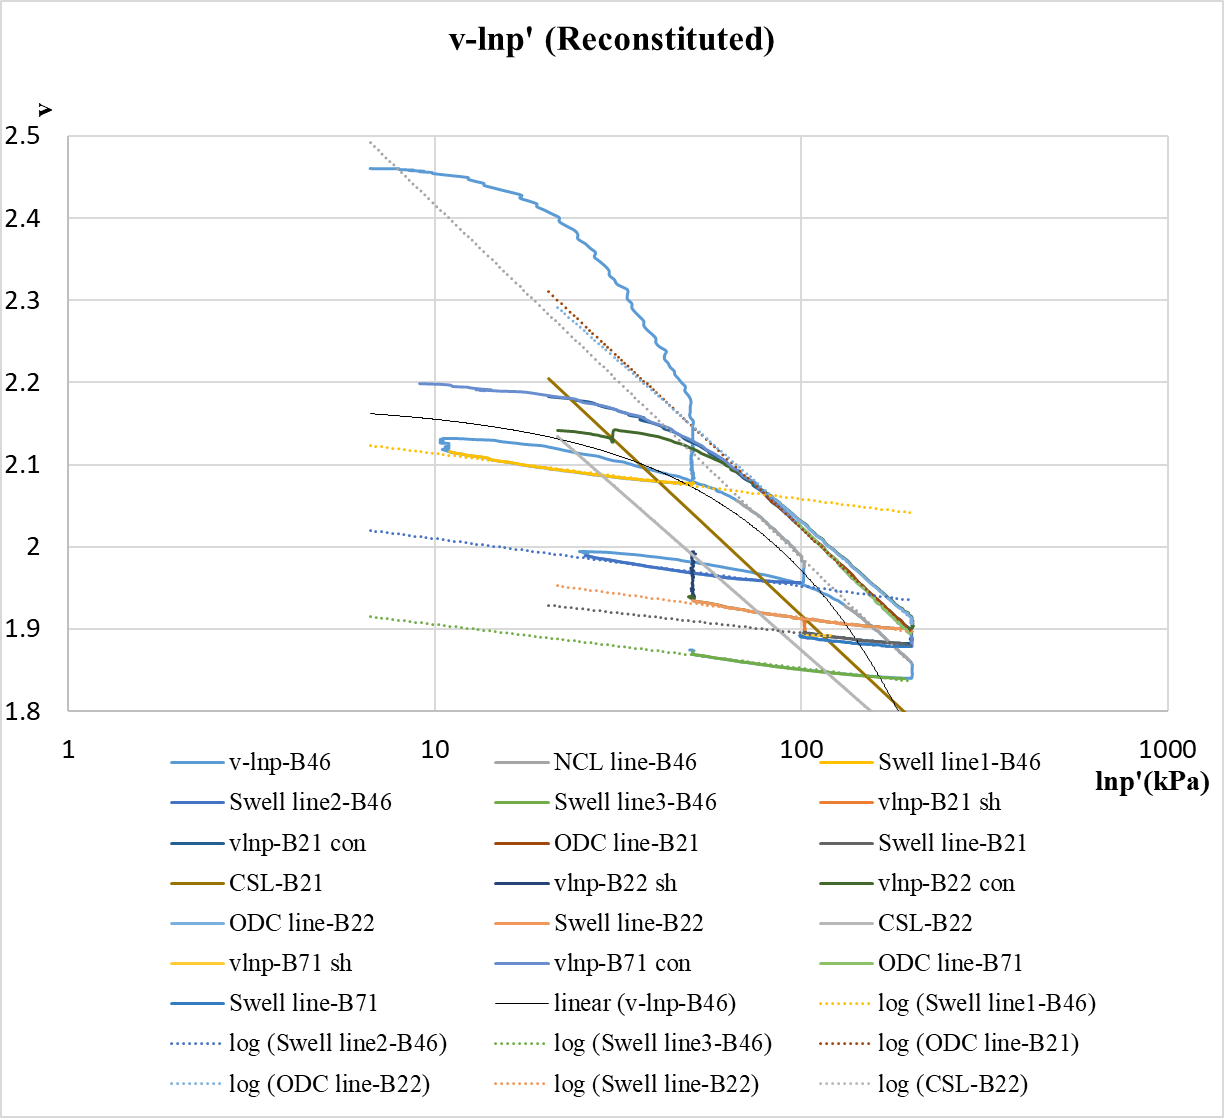
Figure 1. v-lnp′ results of continuous loading compression, swelling and shear tests for reconstituted soil (in total).
All experimental data are presented in Figure 1, where reconstituted soil sample numbers begin with b. Figure 1 is intended to show the generally behaviour of all the reconstituted soil. The graph shows that the normal consolidation curve (iso NCL) of the isotropic consolidation test B46 can be considered to be on the same line (if the creep does not occur) and that the curve for the swelling phase also has the same slope. The normal consolidation curves for the one-dimensional consolidation tests B21, B22 and B71 also lie approximately on the same straight line. This line (OD NCL) has the same slope as the isotropic consolidation test curve (iso NCL) and lies to its left. The curve for their swelling phase also has the same slope as the isotropic consolidation test. The slope and intercept of these lines are calculate. v0 is equal to the initial pore ratio plus one.\( V_{n} \),\( p \prime \)and\( q \prime \)show as [5]:
\( V_{n}=V_{0}×(1-ε_{v}) \)(1)
\( p \prime =\frac{(2σ \prime _{r}+σ \prime _{a})}{3} \)(2)
\( q \prime =σ_{a}-σ_{r} \)(3)
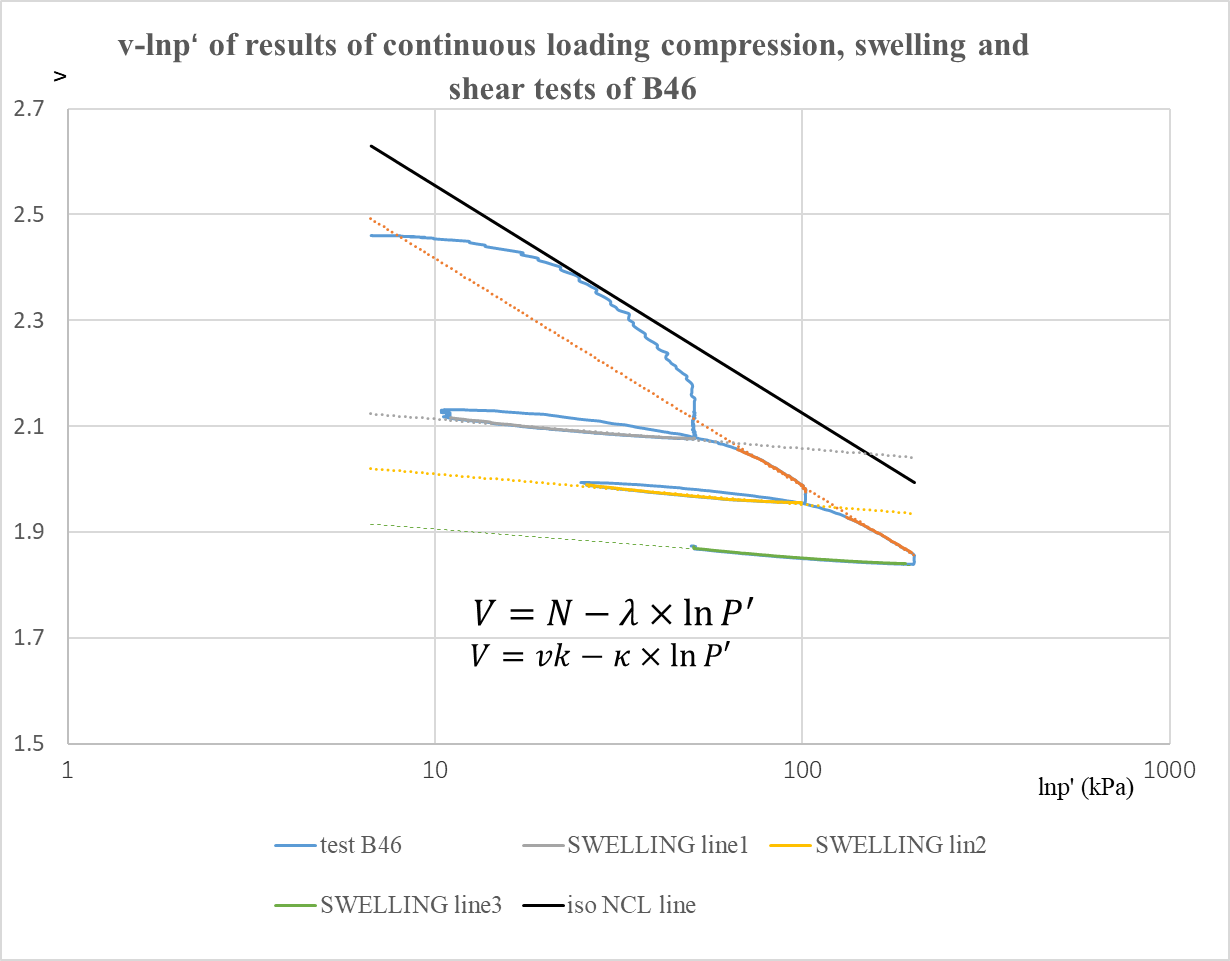
Figure 2. results of continuous loading compression, swelling tests for B46.
Here the v- lnp′ relationship of Bothkennar Clay is further analysed by examining its iso NCL line, which is exemplified in this paper by the B46 sample. Figure 2 is intended to show behaviour of B46. This is an experiment in isotopic compression test. Normal consolidation data were selected as linear data at the end of the compassion test. The initial non-linear region is considered to have some overconsolidation, while the final vertical region is due to creep (phase 1) and dissipation of the excess pore water pressure at 24 hours rest periods (Phase 2,3 and other tests). Therefore, according to the data of the three normal consolidation stages, the slope of those line is\( λ_{1} \)(The calculation is done by excel).\( λ_{1} \)is equal to 0.187. Because a significant creep occurs after the first compression test, the intercept (N) of iso NCL calculation will only use data from the first normal consolidation stage. The specific calculation method of N will be shown in Figure 3. The slope 𝜅 of each swelling line can be obtained in the same way.\( κ_{1} \)is equal to 0.024.\( κ_{2} \)is equal to 0.025.\( κ_{3} \)is equal to 0.023. Substituting these 𝜅 into formula 3 gives us the intercept vk.
\( V=vk-κ×ln{P \prime } \)(4)
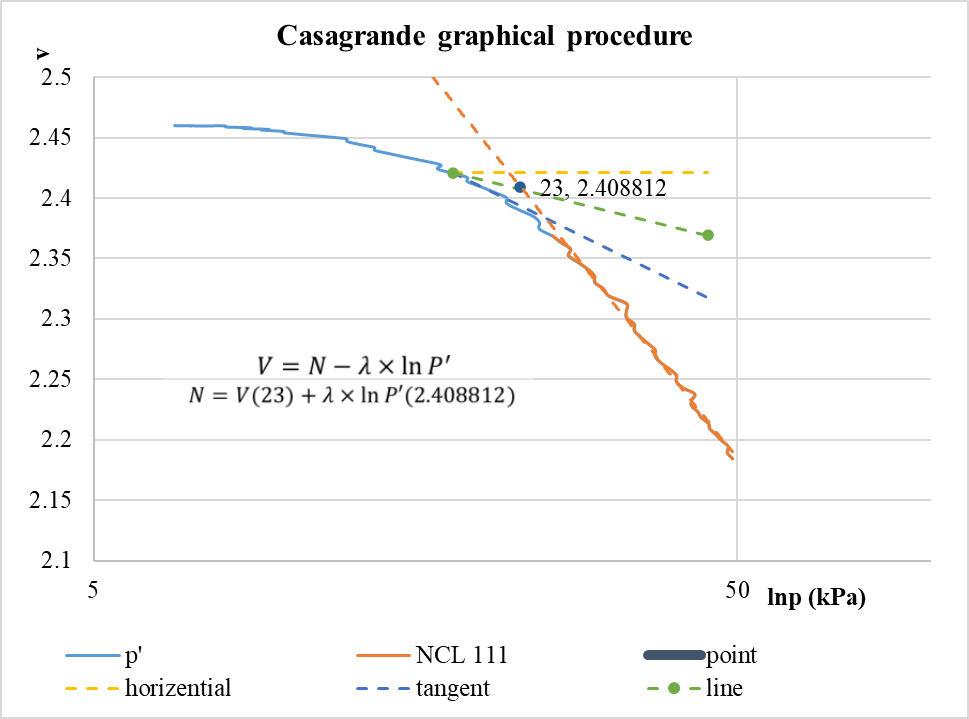
Figure 3. Cassagrande graph6ic procedure method.
In order to obtain the intercept N of the iso NCL line, a point passing through the iso NCL line needs to be determined. This point is used by the Cassagrande graphic procedure method as the preconsolidation pressure point (BS EN ISO 17892-5:2017 [6]) which is considered to cross the iso NCL line:1. Estimate the point of maximum curvature on the curve and draw a line tangent to it. 2. Through that same point of maximum curvature, draw a horizontal line. 3.Draw a line that bisects the angle between horizontal line and the tangent line. 4. Draw a line tangent to the virgin compression portion of the curve until it intersects line ad 5. The effective stress associated with the intersection point in is the preconsolidation pressure. Plug the coordinates of this point into formula 4 to get the intercept N. [7]
\( V=N-λ×ln{P^{ \prime }} \)(5)
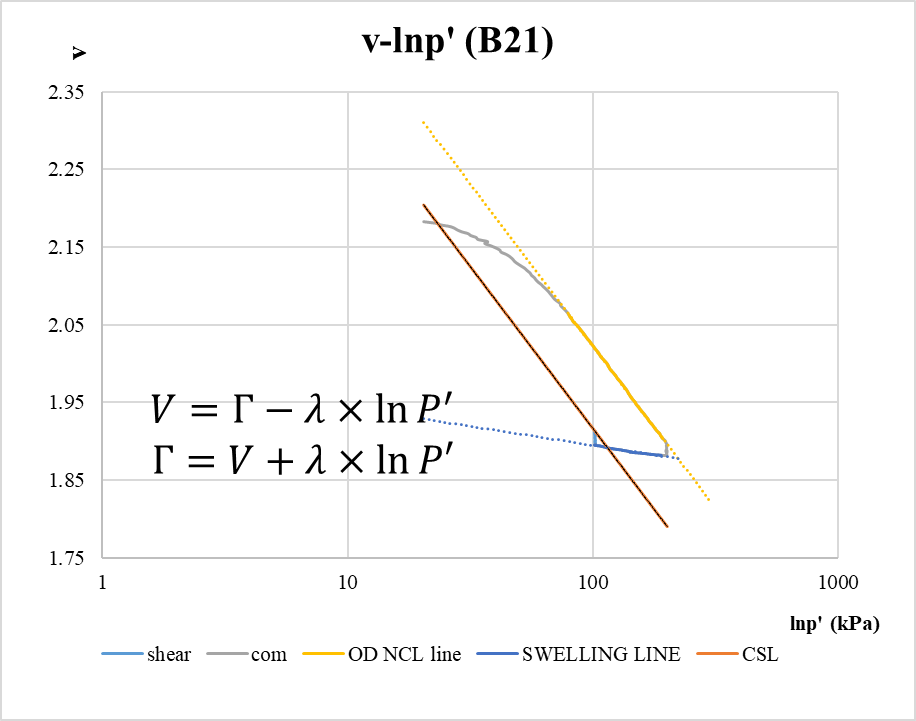
Figure 4. results of continuous loading compression, swelling and shear tests for B21.
Also to get the CSL of Bothkennar Clay, this paper is analysed with B21 sample. This Figure 4 is intended to show compression, swelling and shear behaviour of B21. This is an experiment in one-dimensional compression test. This test is the only one that is considered a complete shear failure. By substituting the shear failure point into formula 6, Γ can be obtained. And λ has been obtained before:
\( V=Γ-λ×ln{P^{ \prime }} \)(6)
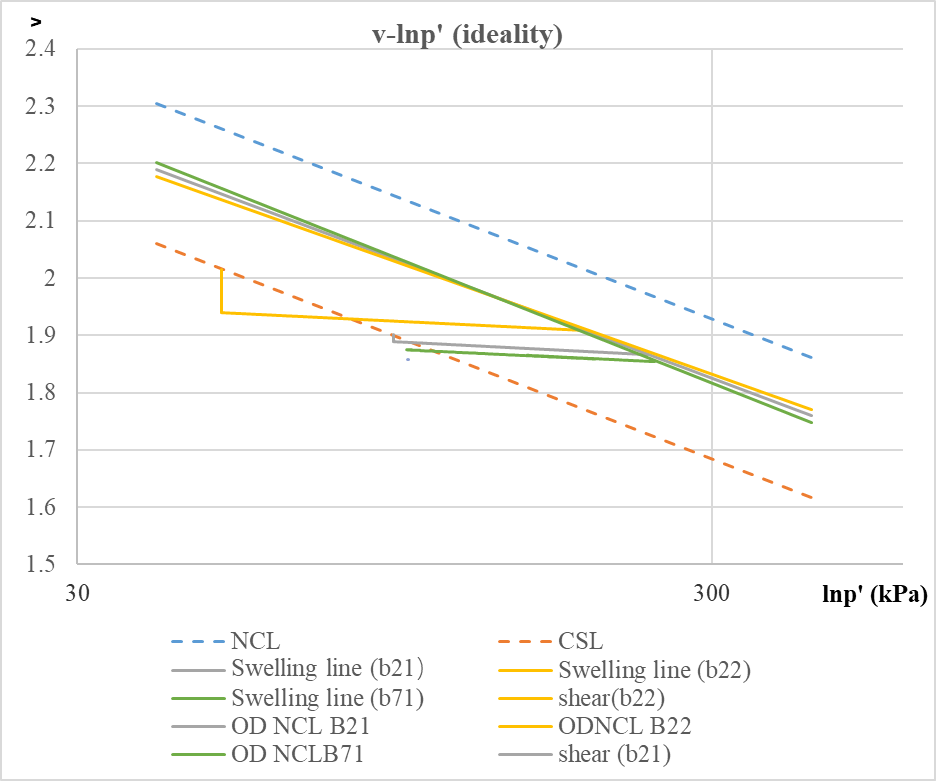
Figure 5. v-lnp′ ideality results of continuous loading compression, swelling and shear tests for reconstituted soil (in total).
The parameters of consolidation curve and expansion curve of all tests are obtained according to Equations 3 and 7. These parameters are substituted into Equations 3~7 and drawn to get Figure 5.
\( V=N \prime -λ×ln{P^{ \prime }} \)(7)

Figure 6. q-p' in total.
In addition, the q-p' relationships for all Bothkennar Clay samples are given in this paper. CSL is generated by the line between the cut point of b21 and the origin. M peak line is generated by connecting the peak value to the origin.
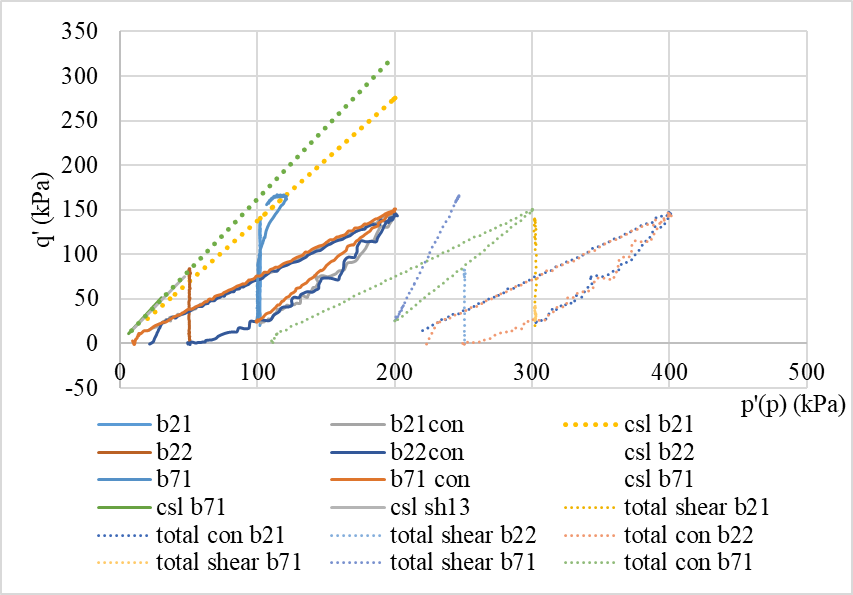
Figure 7. q’-p’ (p)of reconstituted soil.
This Figure 7 shows the total stress path and pore water pressure. It is worth noting that the difference between the total stress and the effective stress is the pore water pressure.

Figure 8. q’/p’-es.
As the B21 test is the only one that is considered a complete shear failure. M value is the convergence value of B21 test curve. And\( ε_{s} \)shows:
\( ε_{s}=2/3×(ε_{a}-ε_{r}) \)(7)
After analyzing the data, the important parameters (N = 2.995, λ = 0.187, k = 0.025, Γ=2.75, M=1.37) are obtained.
For v-lnp '(Figure 1), normal consolidation occurs in a linear relationship, and OD NCL is located inside iso NCL. For q-p' (Figure 6), three samples were uniaxial compressed to 200kpa and then expanded to 50 or 100kpa, so the same path, overconsolidation ratio of 4 or 2. In the shear test a peak value greater than CSL occurs and the sample is overconsolidated. This is also shown in Figure 10-17 shown in the next chapter.Also, it can find that shear stiffness of sample (shown in Figure 15) is S-shaped descent. The small strain is proportional to\( \sqrt[]{p \prime } \)a and the medium strain is proportional to p '[8].
2.3.Discussion of reconstituted sample
Finally, it can get some Critical State parameters for compression and shearing and Table 1 show below. Allman & Atkinson [9]gives more precise data (N = 2.88, λ = 0.181, k = 0.025, Γ= 2.78). Compared to the data we got, there is a little difference in N values and λ values. This is due to the fact that λ is influenced by the loading increasing rate, which in this test was 3kpa/h for the isotropic B46 and less than 4 kpa/h for the Allman & Atkinson test. Parameter λ will also be influenced by the compressive properties of the soil, which include the initial pore ratio and initial moisture content of the soil, which is impossible to match the conditions of the two experiments exactly. So the value of λ are different, according to the equation: v = N -λlnp’. The N of this test and published data will certainly differ. Atkinson proposed that sampling and transportation would change the mechanical properties of samples and lead to structural differences.
Table 1. parameters for compression and shearing.
|
B46 |
|||||
|
N |
λ |
К1 |
К2 |
К3 |
loading rate(kpa/h) |
|
2.995 |
0.187 |
0.024 |
0.025 |
0.023 |
3 |
|
B21 |
|||||
|
N’1 |
λ'1 |
К' |
Г |
M |
loading rate(kpa/h) |
|
2.8575 |
0.181 |
0.021 |
2.7772 |
1.37 |
3.5 |
|
B22 |
|||||
|
N’2 |
λ'2 |
К' |
Г(not fail,can't use) |
M(not fail,can't use) |
loading rate(kpa/h) |
|
2.8083 |
0.17 |
0.025 |
2.7282 |
1.47 |
3.5 |
|
B71 |
|||||
|
N’3 |
λ'3 |
К' |
Г(not fail,can't use) |
M(not fail,can't use) |
|
|
2.9056 |
0.191 |
0.02 |
2.8079 |
1.45 |
|
|
TOTAL(RECON) |
|||||
|
N |
λ |
К |
Г |
M |
loading rate(kpa/h) |
|
2.995 |
0.187 |
0.024 |
2.75 |
1.37 |
3 |
|
Public (Allman & Atkinson [9]) |
|||||
|
N |
λ |
К |
Г |
M |
loading rate(kpa/h) |
|
2.88 |
0.181 |
0.025 |
2.78 |
1.38 |
less than 4 |
There is no significant difference of k & between calculated parameters of these tests and published data. Finally, comparing the values of M, according to the stress-strain diagram (Fig. 7), we could find that only B21 failed. Using the average of M for B21 gives M = 1.37. Because this experiment only obtained M values from relatively few shearing tests, it may cause some error. Allman & Atkinson used 26 soil samples and the M (M=1.38) values are more accurate (Figure 8) [9].
Critical State framework also have some limitations. It can deal with normally and lightly overconsolidated soils well. But for heavily overconsolidated soils, it is common for the soil to shear because of the presence of a strain-concentrated shear band in which water is concentrated. This causes this part of the soil to reach its peak strength and reach the CSL first, which then causes the actual image or soil properties to differ from the ideal (Figure 21).
3.Laboratory test results of natural soil
3.1.Sherbrooke bloke sampler
In experiments investigating natural soils, samples should retain as much of the original structure, moisture content and void ratio as possible and be subjected to as little disturbance as possible during the sampling process to ensure that the final test results are correct. The Sherbrooke bloke sampler method can be used to obtain the samples in accordance with the European norm BS EN ISO-22475-1[10]. The code states that this method is to be carried out in a pre-prepared 400mm diameter borehole with reinforced walls and cut free of loose debris by a flat bottom auger. A sampler with 3 cutters capable of generating water flow is placed at the bottom of the hole. Once sampling has started, the cutter is advanced into the soil at a slow rate with a combination of circular rotational cutting around the sample and water flushing which can reinforced walls and cut free of loose debris. At a certain depth, the horizontal diaphragm on the cutter pops out and cuts the bottom of the sample, achieving sample separation from the soil and providing support. After processing, transport and preservation, a sample of 250 cm in diameter and 350 cm in height was obtained and tested (Figure 9).

Figure 9. Example of sampling from borehole bottom using a large sampler (Sherbrooke block sampler)[10].
3.2.Data analyses
The original test data of natural soil was analyzed in a method similar to that of reconstituted soil, and the following results were obtained: Figure 6, 7 and 10-17, where natural soil sample numbers begin with sh.
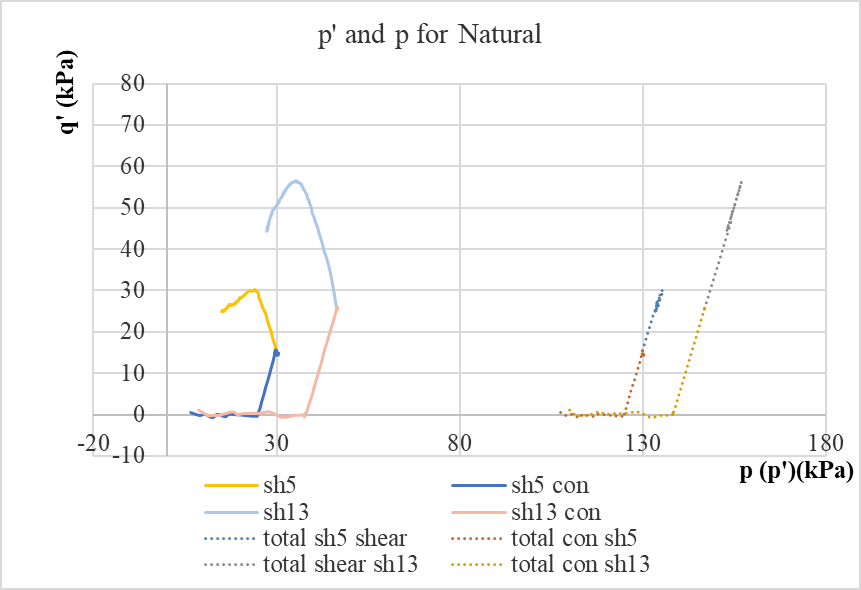
Figure 10. q’-p’ (p)of natrual soil.
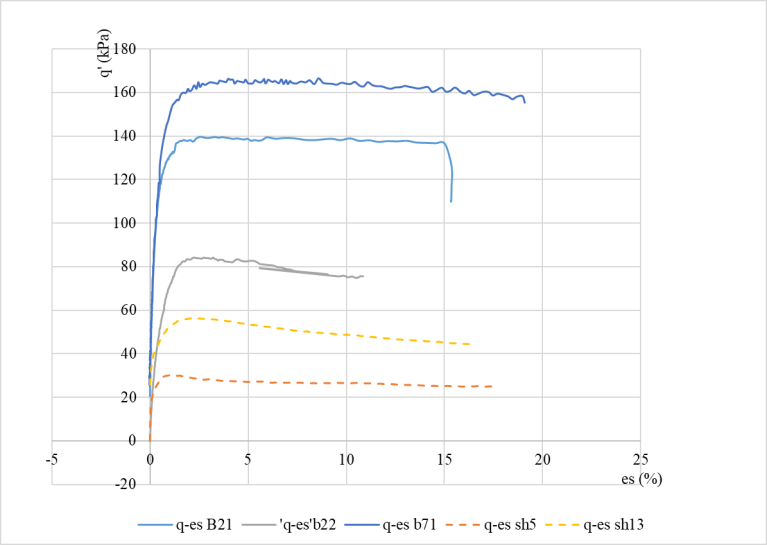
Figure 11. q’-es for five tests.
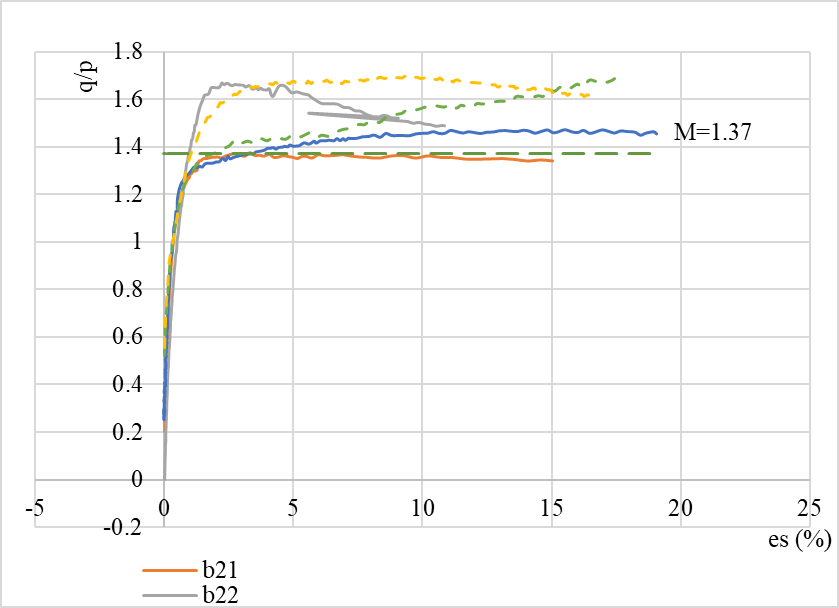
Figure 12. q’/p’-es.
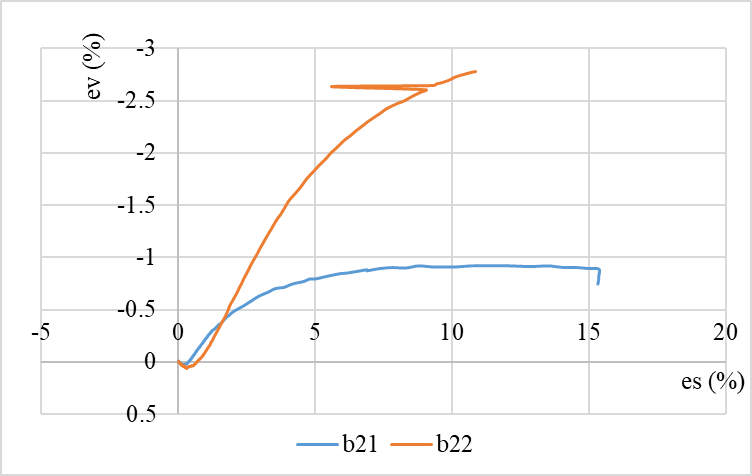
Figure 13. ev-es of B71, SH5. SH13.
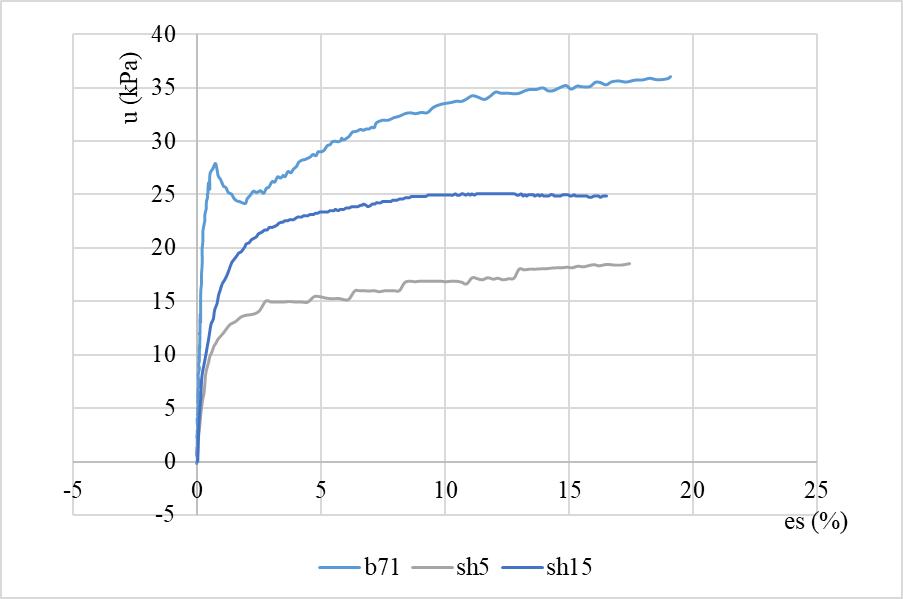
Figure 14. u-es for B21, B22.
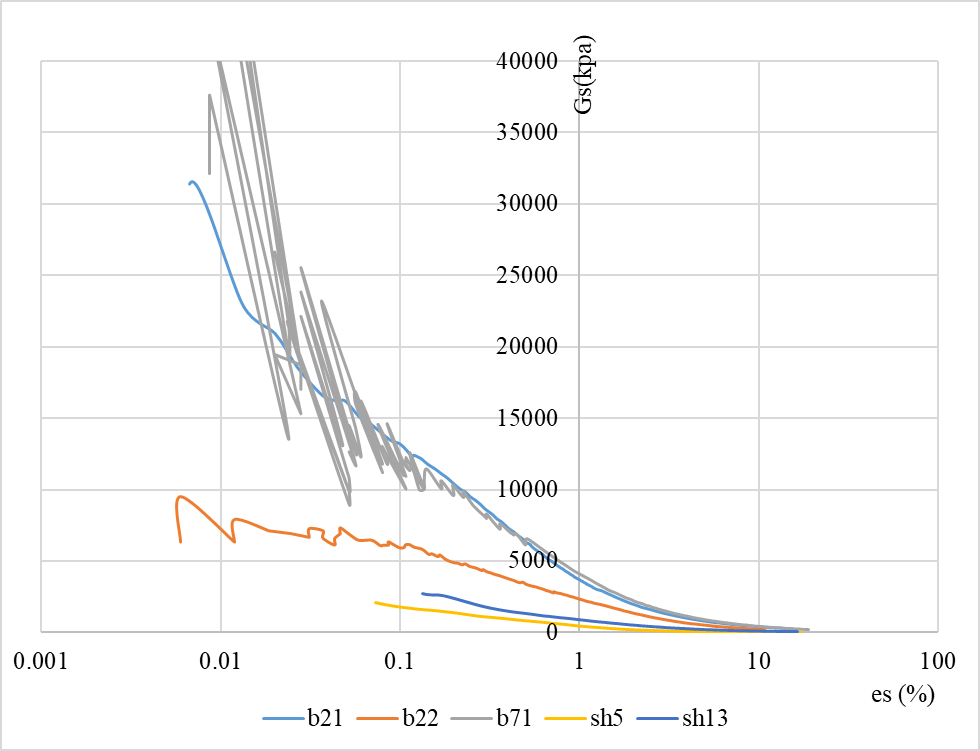
Figure 15. Secant Shear Stiffness(Gs- es).
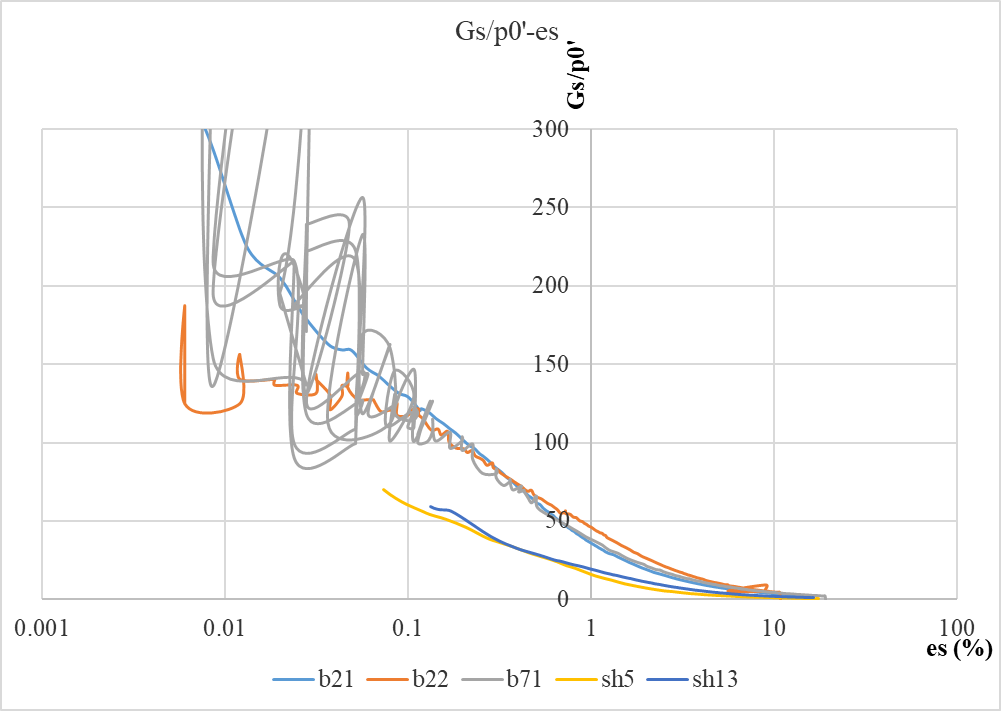
Figure 16. normalization Secant Shear Stiffness(Gs/p0’- es).
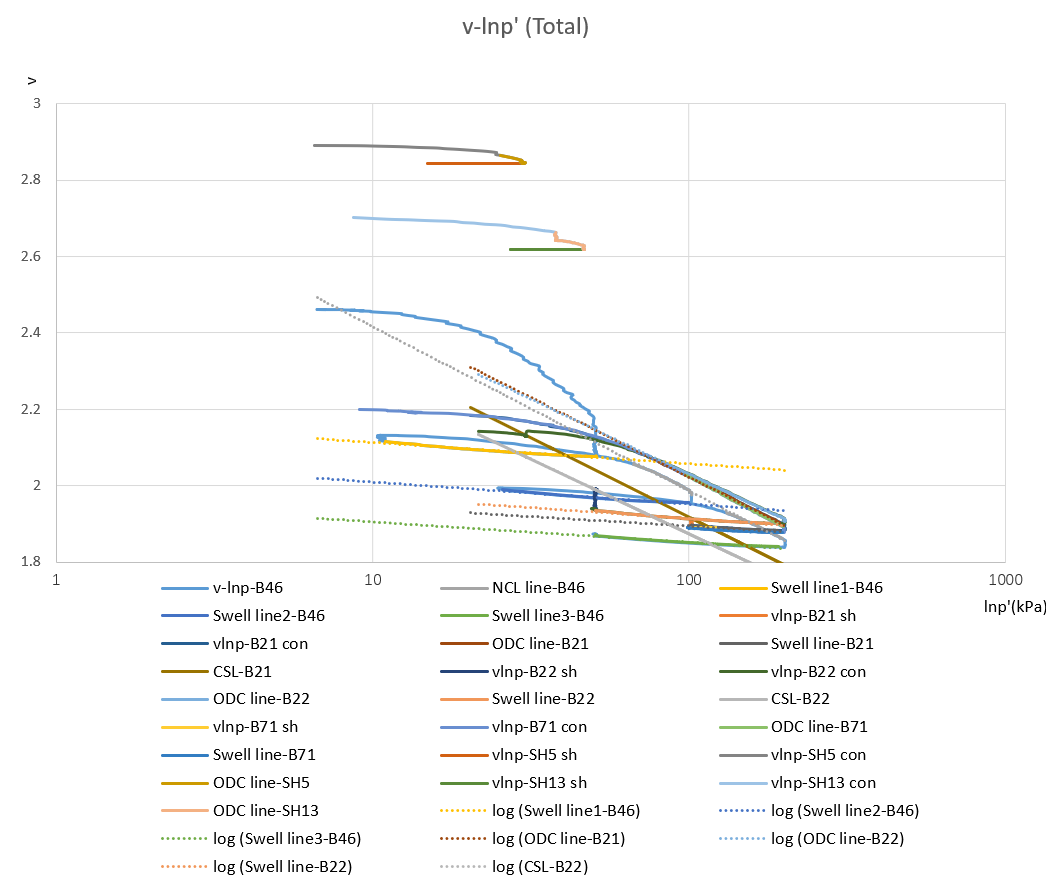
Figure 17. v-lnp′ results of continuous loading compression, swelling and shear tests for reconstituted soil and natural soil (in total).
The Figure 15 shown that Gs is the slope corresponding to q' and es curves in The Figure 11, and its calculation can be obtained from Formula 8.
\( ε_{s}=1/3×\frac{(q-q_{0})}{s} \)(8)
Figure 17 shown that The stiffness is normalized for all Gs divided by p0 prime. Where p0' is the initial value of the shear force at the beginning of shearing.
3.3.Discussion of natural sample
The difference in compression behaviour between natural and reconstituted soils can be demonstrated by the graphs of v-lnp (Figure 6) and sensitivity (Figure 19). Foremost, the natural soil shows a higher initial void ratio than the reconstituted soil, which is located to the right of the iso NCL in its initial state. And this state continues throughout the consolidation test, even to the final point which is considered to be the same state of stress for the soil in situ. This situation where the natural soil has a greater pore ratio at the same stress compared to the reconstituted soil is due to sedimentation and ageing [8]. And they point out that the effects of ageing are equivalent to overconsolidation. Furthermore, the consolidation curve of the natural soils is flatter than the NCL, which means that the natural soils have greater strength and stiffness during the consolidation phase. And for two different natural soils, the properties vary considerably. And even for the sh5 and sh13 test, there are also great differences in their behavior as natural soil. These phenomena are determined by the historical presses of the natural soils. During soil formation, some residual stresses and structures like fabric and bonding also caused by sedimentation and post- sedimentation. They take up part of the load which appears at a macro level as an increase in the strength and stiffness of the soil. The specific content will be elaborated in the structure of Section 4 of this paper.
As for shear behavior, Natural soil and reconstituted soil show great difference in stress path and largest effective shear stress q'. For the triaxial undrained shear test, the natural soil shows a completely different stress path than b71 (Figure 6). By normalizing the stress path, this gap can be more clearly observed (Figure 22). The pressure path of natural soil is far outside the state boundary of the reconstituted soil theory. Under the condition of undrained soil, the shear stress increases to the peak (harden)when effective main stress decreases. After the peak point, the effective main stress and shear stress decrease simultaneously (soften). The reduction path of different groups of natural soil after reaching the peak value seems to be in the same straight line and move back to critical state boundary. However, at the end of the test, where the strain was about 10%, and the natural soil sample did not reach the critical state point of reconstituted soil. According to Figure 10~16, the relationship between q’, q/p’, u, Gs and es of natural soil has the same trend as that of reconstituted soil, but the shear stress and water pressure in failure and the shear modulus of the whole shear process are smaller than those of the reconstituted soil. After the normalized stiffness, there is no significant difference between the natural soil and reconstituted soil (Figure 16).
It can be known from the previous analysis that the natural soil is subject to sedimentation and overconsolidation. Therefore, the critical state boundary of natural soil is enlarged and lengthened vertically compared to the critical state frame.
The right boundary of the Critical state framework (Roscoe-Rendulic surface) is determined by considering normal consolidation, while the left boundary is determined by the M peak value of overconsolidation (Hvorslev surface) and uniaxial compression shear under the same void ratio. However, for undrained tests, the stress path cannot exceed the yeild envelope [11], which is inside the Roscoe-Rendulic surface. Since the shear peak of natural soil is after soil hardening, this will be higher than the critical state boundary.
4.Effects of structure soil behaviour
4.1.Effects of natural clay structure
According to the sensitivity framework, the v-lnp graph is processed to get the Figure 19. Using Figure 18, it can be determinecd the pore ratio for vertical effective stresses of 100 kPa and 1000 kPa as e100* and e1000* (after Burland, 1990), and a slope (determined positive), Cc* = (e100* - e1000*)/log(1000/100), otherwise Cc* = e100* - e1000*. The values of Cc*, e100* and e1000* are unique for a given clay, and they determine the intercept and slope of the NCL. We can normalise by taking into account the slope and intercept of each clay, introducing a new parameter Iv (void index) by Formula 8
\( I_{v}=\frac{e-e100*}{e100* - e1000*} \)(8)
By the transformation of formula 8 we get a line with void ratio e is equal to e100*, Iv = 0, and void ratio e is equal to e = e1000*, Iv = -1. This means that we have completed the NCLs replotted from the e - log v 'into the Iv - log v' plot. This Line is also defined as the Intrinsic Compression Line (ICL). We can get different sensitivity curves by shifting them. Burland J. B. [4] indicates that the sensitivity of SCL is about 4 to 6, here we take 5. The structure is therefore considered to be the result of both sedimentation and post-sedimentation. By finding the corresponding sensitivity line of structural yield stress of sh5 and sh13, the sensitivity of sh5 and sh13 is 9 and 19 respectively.
The NCL line of the reconstituted soil is normalized to ICL. Burland [4] believed that the ICL line corresponding to the reconstituted soil represented the most essential compression property of clay as a granular material. Reconstituted soils are considered to have completely lost their structure during the reconstituting process. Therefore, the difference between the compression curve of natural soil and the ICL is considered to be the embodiment of the structure. These structures include bonding structures that are easy to crush when the stress is greater than the yield stress in the consolidation test and easy to shear in the shear test, and the fiber structures that are not easy to crush and shear. These structures are formed by sedimentation and post- sedimentation processes during soil formation, in which the soil curves that are only subject to sedimentation processes appear as SCL and post- sedimentation processes deviate the soil curves from SCL. These structures increase soil porosity and significantly affect soil compression properties, but a certain stress level the structure will start degrading(Figure 20). This is marked by an abrupt change in compressibility past yield. As structure degardes, the behaviour of the soil seems to join that of the reconstituted soil. Moreover, it will affect the yield characteristics of soil [11] and produce an obvious structural yield stress. In addition, the influence of structure on soil consolidation behavior, shear behavior, stress-strain relationship, stress path, strength and stiffness is shown in 3.3 of this paper.
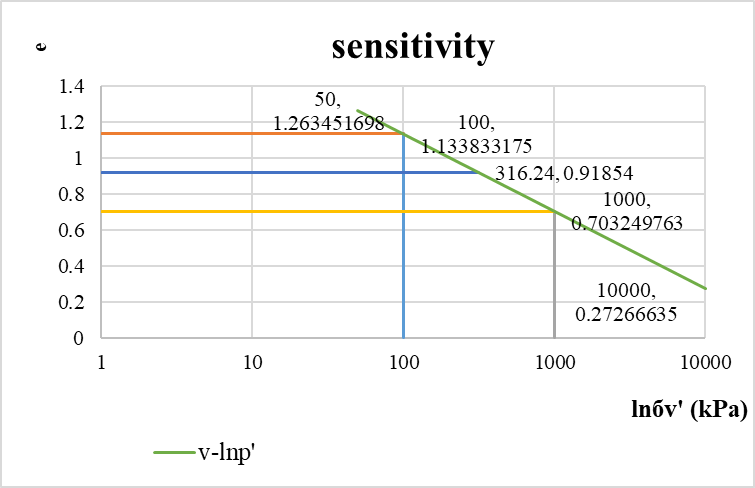
Figure 18. sensitivity in e and бv.
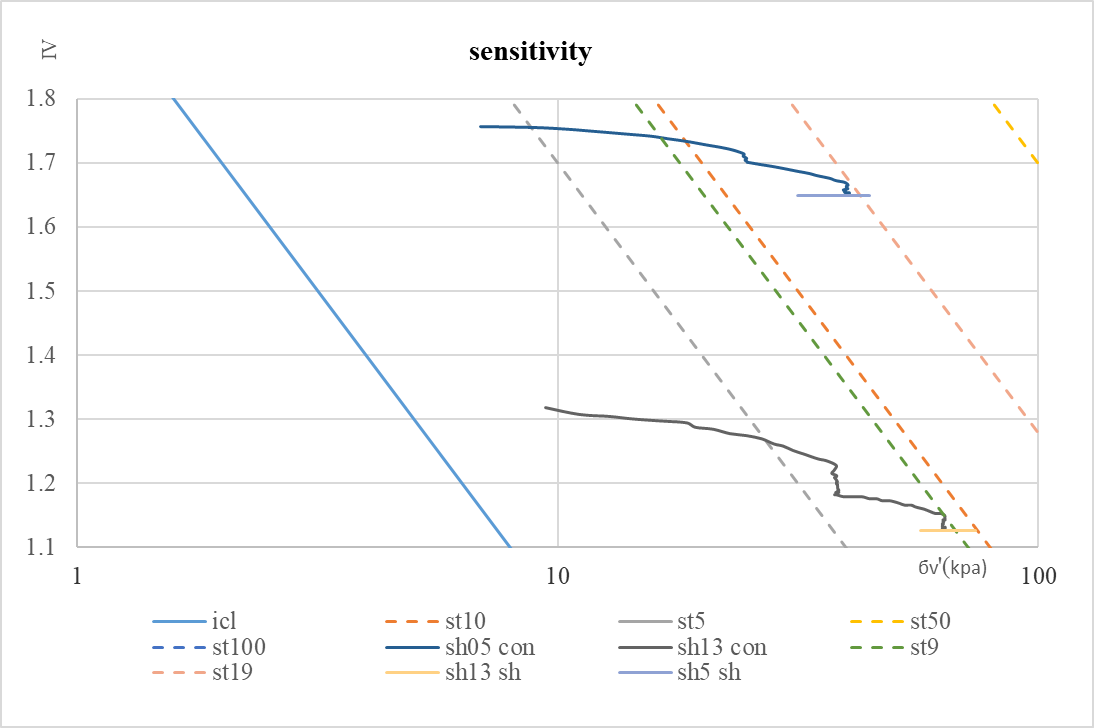
Figure 19. Sensitivity of Natural soil in Iv and бv.
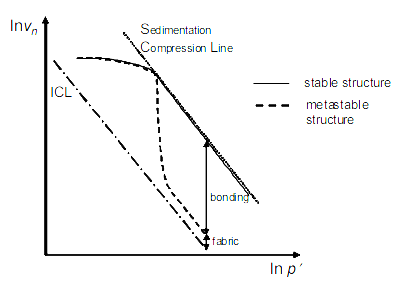
Figure 20. Simplified effects of fabric and bonding on natural clay behaviour .
4.2.Sensitivity
For the study of Bothkennar clay's structure, Burland's [4] sensitivity framework was used. In Figure 16, sensitivity can be obtained by yield strength according to sensitivity framework. sh5 has a sensitivity of 9 and sh13 has a sensitivity of 19. A smaller sensitivity means that they are dominated by fibrous structures. The stress at the final point of the consolidation test, i.e. the original soil stress, is taken as the yield stress and is the sensitivity of measurement. This is because Tavenas [12] pointed out that hardening in undrained shear tests indicates that the consolidation pressure is higher than the structural yield stress (Figure 19). The proportion of fibrous and bonding in the structure can be verified by shear test, in which the amount of shear failure close to ICL is bonding, and the remaining amount means fibrous, because bonding is easier to be sheared. This also demonstrates the dominance of fibrous structures.
4.3.Normalization
Judgments of structure are made through the framework of uniformity. Applying the equations
\( p \prime _{e}=EXP(\frac{N-V*}{λ}) \)(9)
to the q' and p' axes by the normalised stress paths, Normalization stress paths obtained in Figure with the axes changed to q'/pe' and p'/pe'. Figure shows the undrained stress paths on the intact and reconstituted Bothkennar clay. An elliptical critical state boundary was obtained by fitting a one-dimensional NCL point, M peak and initial stress. This is somewhat different from the ideal boundary consisting of the Roscoe-Rendulic surface, the Hvorslev surface and the no tension cut off boundary, but is more in conformity with this test.
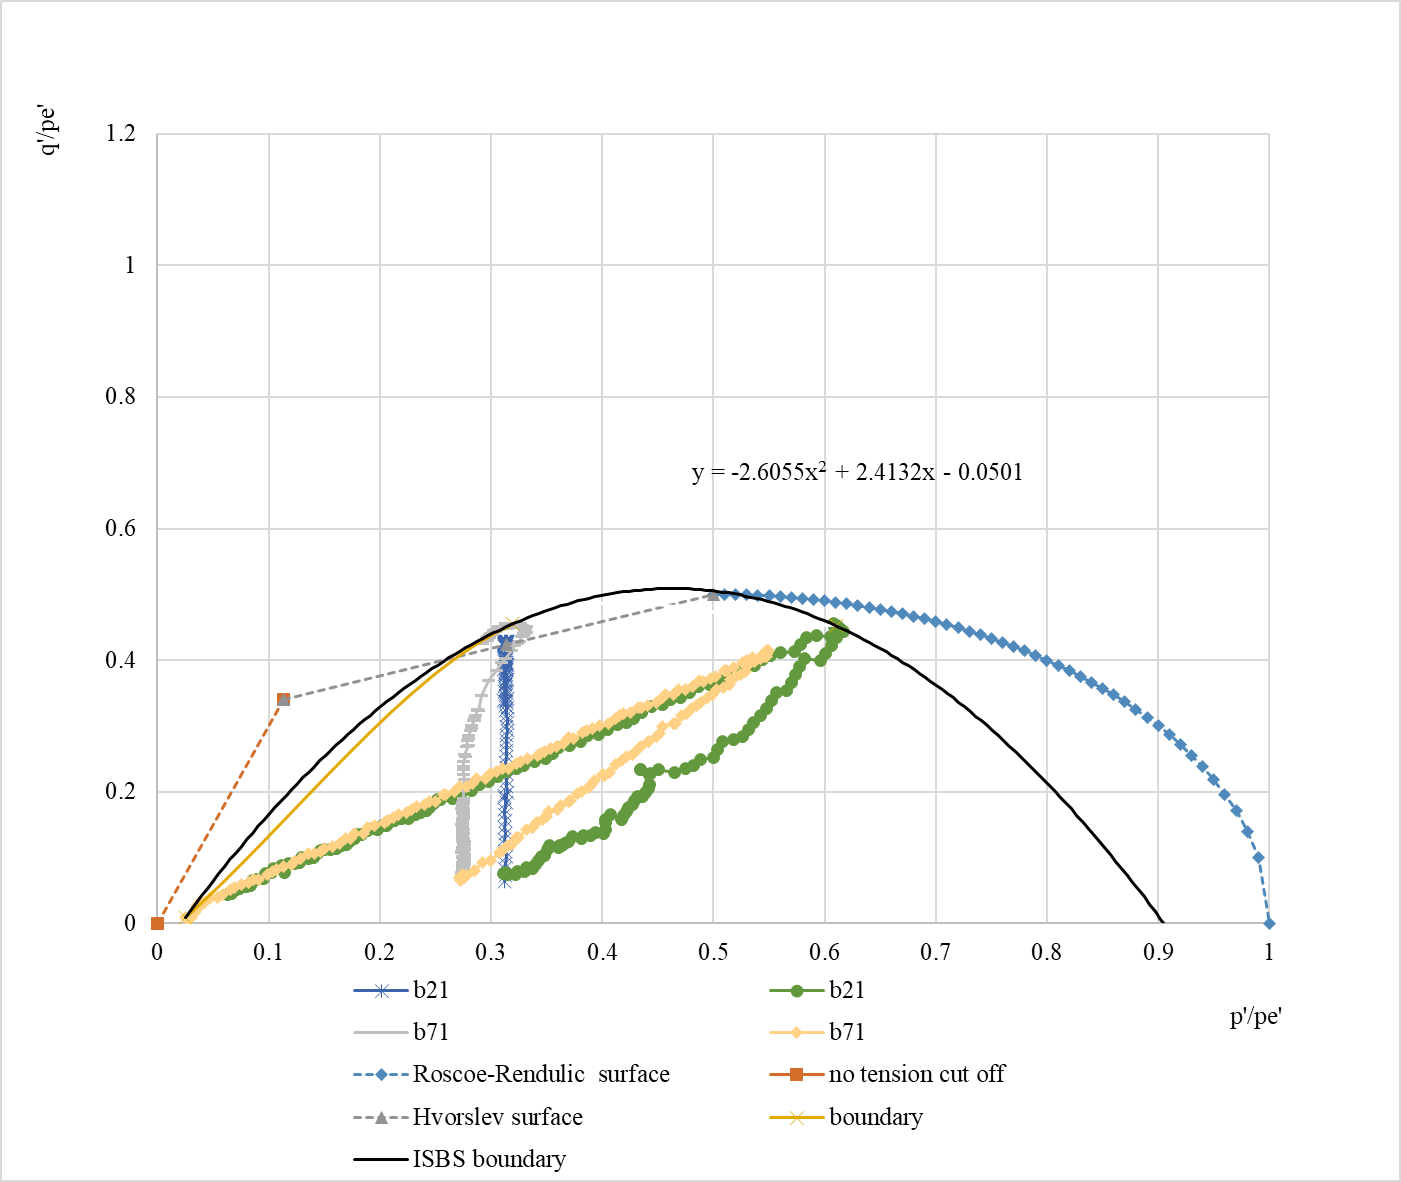
Figure 21. q’/pe’-p’/pe’ diagrams for reconstituted soil.
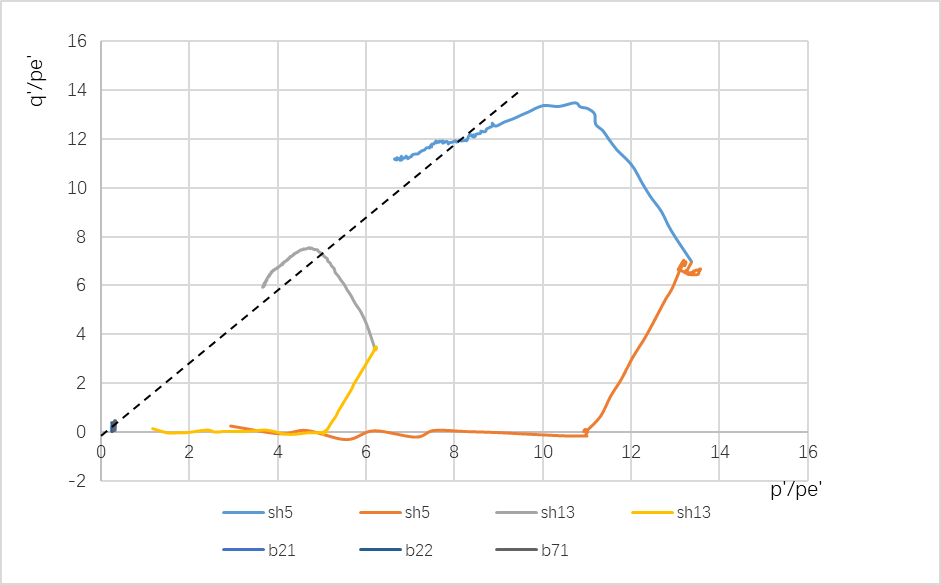
Figure 22. q’/pe’-p’/pe’ diagrams for reconstituted and natural soil.
The sensitivity of natural soil can be measured by scaling the most critical boundary. However, due to the limitations of the critical state framework mentioned in 3.3. It not gives us sensitivity by directly scaling the critical state boundary. Smith [11] elaborated on the construction theory of Bothkennar clay's envelope boundary (Figure 23). By bringing the data into the envelope boundary obtained by Smith [11], the sensitivity of sh5 is about 9.3 and that of sh13 is about 16, roughly the same as that of the sensitivity framework. In addition, in undrained triaxial tests, the peak deviation stress is generally considered to be twice the unconsolidated undrained shear strength. By the ratio of undrained shear strength, the sensitivity of sh5 is about 8.5.3 and that of sh13 is about 16.5, which is consistent with what we calculated before (Figure 22).
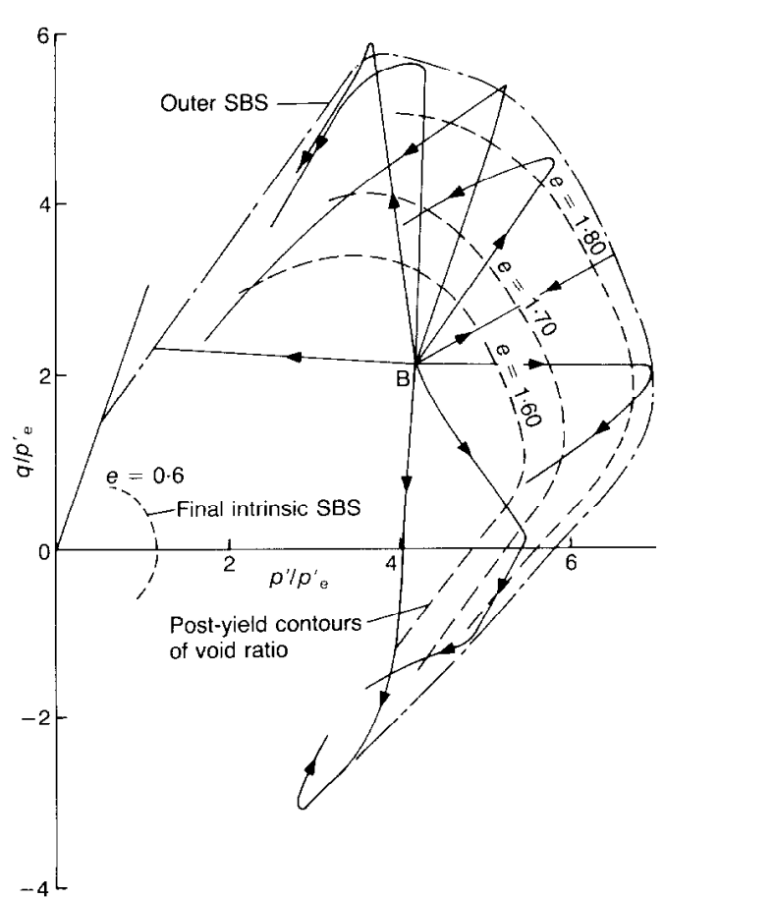
Figure 23. Normalized large strain behaviour of Laval samples by Smith [11].
In contrast to the reconstituted clay, the additional strength and stiffness of the intact natural Bothkennar clay is derived from the structure in the clay (mainly fibrous as discussed above), and the falling off from the peak value shown in the diagram is a softening of the strains as well as a disruption of the fibrous structure. The higher the sensitivity, the further the curve of the intact clay is from the Intrinsic CSL line, representing a stronger fibrous structure and a more pronounced decrease in strength of the soil after disturbance. The results were consistent with the sensitivity framework.
4.4.Discussion
The Bothkennar Clay is remarkably uniform in composition and mineralogy but exhibits natural variability in structure, fabric and state. Variations in the level of structure relate to facies type, being highest in the mottled facies and least in the laminated facies [13,14]
5.Conclusion
This paper introduces the basic information about Bothkennar soil. Also, based on the Cambridge model, the basic behavior of reconstituted Bothkennar soil was established, and its main material parameters were solved and discussed. Moreover, The behavior of natural Bothkennar soil is described by the critical boundary framework and compared with that of reconstituted soil. Finally, Bothkennar soil structure was explored through sensitivity models and normalization models.
References
[1]. Kailun Shen. (2006). Degradation of Soil Structure and Anisotropic Plasticity Evolution of Natural Clay. Zhejiang University.
[2]. Kailun Shen. (2006). Degradation of Soil Structure and Anisotropic Plasticity Evolution of Natural Clay. Zhejiang University. [2] Paul, M. A., Peacock, J. D. & Wood, B. F. (1992). The engineering geology of the Carse clay at the National Soft ClayResearch Site, Bothkennar. Géotechnique 42, No. 2, 183-198.
[3]. Nash, D. F. T., Powell, J. J. M. & Lloyd, I. M. (1992). Initial investigations of the soft clay test siteat Bothkennar。 Géotechnique 42, No. 2, 163-181.
[4]. Burland J. B. (1990). On the compressibility and shear strength of natural clays. Géotechnique 40, No. 3, 329-378.
[5]. Leroueil S. (1995). Compressibility of clays: fundamental and practical aspects[J).J.Geotech. Engng, ASCE, 122(7): 534-543.
[6]. BS EN ISO 17892-5:2017(E) Geotechnical investigation and testing - Laboratory testing of soil-Part 5: Incremental loading oedometer test.
[7]. Nash D. F. T., Sills, G. C. & Davison, L. R. (1992). One-dimensional consolidation testing of soft clay from Bothkennar.Géotechnique 42, No. 2, 241-256.
[8]. Allman, M. A. & Atkinson, J. H. (1992). Mechanical properties of reconstituted Bothkennar soil. Giotechnique 42, No. 2, 289-301.
[9]. Atkinson, J. H., Allman, M. A. & Böese, R. J. (1992). Influence of laboratory sample preparation procedures on the strength and stiffness of intact Bothkennar soil recovered using the Laval sampler. Géotechnique 42, No. 2, 349-354.
[10]. BS EN ISO 22475-1:2006(E) Geotechnical investigation and testing Sampling methods and groundwater measurements-Part 1: Technical principles for execution.
[11]. Smith, P. R., Jardine, R. J. & Hight, D. W. (1992). The yielding of Bothkennar clay. Géotechnique 42, No. 2, 257-274.
[12]. Tavenas F, Leroueil S. (1977). Effects of stresses and time on yielding of clays[J]. Proc. 9 ICSMFE, Tokyo, 1: 319-326.
[13]. Hight, D. W., Bond, A. J., & Legge, J. D. (1992). Characterization of the Bothkennar clay: an overview. Geotechnique, 42, No. 2, 303-347.
[14]. Hight, D. W., Böese, R., Butcher, A. P., Clayton, C. R. I. & Smith, P. R. (1992). Géotechnique 42, No. 2, 199-217.
Cite this article
Niu,S. (2024). Behavioral analysis and structural evolution of bothkennar clay: Insights from laboratory and field investigations. Advances in Engineering Innovation,13,55-70.
Data availability
The datasets used and/or analyzed during the current study will be available from the authors upon reasonable request.
Disclaimer/Publisher's Note
The statements, opinions and data contained in all publications are solely those of the individual author(s) and contributor(s) and not of EWA Publishing and/or the editor(s). EWA Publishing and/or the editor(s) disclaim responsibility for any injury to people or property resulting from any ideas, methods, instructions or products referred to in the content.
About volume
Journal:Advances in Engineering Innovation
© 2024 by the author(s). Licensee EWA Publishing, Oxford, UK. This article is an open access article distributed under the terms and
conditions of the Creative Commons Attribution (CC BY) license. Authors who
publish this series agree to the following terms:
1. Authors retain copyright and grant the series right of first publication with the work simultaneously licensed under a Creative Commons
Attribution License that allows others to share the work with an acknowledgment of the work's authorship and initial publication in this
series.
2. Authors are able to enter into separate, additional contractual arrangements for the non-exclusive distribution of the series's published
version of the work (e.g., post it to an institutional repository or publish it in a book), with an acknowledgment of its initial
publication in this series.
3. Authors are permitted and encouraged to post their work online (e.g., in institutional repositories or on their website) prior to and
during the submission process, as it can lead to productive exchanges, as well as earlier and greater citation of published work (See
Open access policy for details).
References
[1]. Kailun Shen. (2006). Degradation of Soil Structure and Anisotropic Plasticity Evolution of Natural Clay. Zhejiang University.
[2]. Kailun Shen. (2006). Degradation of Soil Structure and Anisotropic Plasticity Evolution of Natural Clay. Zhejiang University. [2] Paul, M. A., Peacock, J. D. & Wood, B. F. (1992). The engineering geology of the Carse clay at the National Soft ClayResearch Site, Bothkennar. Géotechnique 42, No. 2, 183-198.
[3]. Nash, D. F. T., Powell, J. J. M. & Lloyd, I. M. (1992). Initial investigations of the soft clay test siteat Bothkennar。 Géotechnique 42, No. 2, 163-181.
[4]. Burland J. B. (1990). On the compressibility and shear strength of natural clays. Géotechnique 40, No. 3, 329-378.
[5]. Leroueil S. (1995). Compressibility of clays: fundamental and practical aspects[J).J.Geotech. Engng, ASCE, 122(7): 534-543.
[6]. BS EN ISO 17892-5:2017(E) Geotechnical investigation and testing - Laboratory testing of soil-Part 5: Incremental loading oedometer test.
[7]. Nash D. F. T., Sills, G. C. & Davison, L. R. (1992). One-dimensional consolidation testing of soft clay from Bothkennar.Géotechnique 42, No. 2, 241-256.
[8]. Allman, M. A. & Atkinson, J. H. (1992). Mechanical properties of reconstituted Bothkennar soil. Giotechnique 42, No. 2, 289-301.
[9]. Atkinson, J. H., Allman, M. A. & Böese, R. J. (1992). Influence of laboratory sample preparation procedures on the strength and stiffness of intact Bothkennar soil recovered using the Laval sampler. Géotechnique 42, No. 2, 349-354.
[10]. BS EN ISO 22475-1:2006(E) Geotechnical investigation and testing Sampling methods and groundwater measurements-Part 1: Technical principles for execution.
[11]. Smith, P. R., Jardine, R. J. & Hight, D. W. (1992). The yielding of Bothkennar clay. Géotechnique 42, No. 2, 257-274.
[12]. Tavenas F, Leroueil S. (1977). Effects of stresses and time on yielding of clays[J]. Proc. 9 ICSMFE, Tokyo, 1: 319-326.
[13]. Hight, D. W., Bond, A. J., & Legge, J. D. (1992). Characterization of the Bothkennar clay: an overview. Geotechnique, 42, No. 2, 303-347.
[14]. Hight, D. W., Böese, R., Butcher, A. P., Clayton, C. R. I. & Smith, P. R. (1992). Géotechnique 42, No. 2, 199-217.