


1. Introduction
Mineral resources are an essential basis for human survival and development and an indispensable means of production in economic construction. With the rapid growth of the world economy and the advent of the information age, the importance of mineral resources has attracted more and more attention from various countries, and the existing results of mines have been "digitized." It is of great significance to display the spatial location of the ore body through the three-dimensional ore deposit model [1-2], and to use the digital ore deposit model for the comprehensive utilization of mineral resources and comprehensive economic evaluation of mines [3].
Surpac software is an international large-scale mining engineering software developed by SMG in Australia. It is now widely used in many countries around the world. Its core is to form an actual three-dimensional graphics module through fully integrated data visualization and editing [4]. This paper uses Surpac software to establish a three-dimensional digital model of the Manjiazhai mine section. After evaluating the grade block model, the different element combinations of the entire mine section are calculated to obtain the corresponding ore body boundary grade. And compare and analyze the change of ore body boundary grade, ore body shape change, and average grade change obtained under the single element and element combination to realize the practical application of the digital ore deposit model to the comprehensive economic evaluation of the mine.
2. The establishment of a three-dimensional ore deposit mathematical model
2.1. Establishment of geological database
A total of 413 surface prospecting projects in the mining area were collected this time, and 38,133 samples were analyzed. The database tool provided by Surpac software imports all the engineering data files into three files: collar, survey, and assay [4]. The construction of the three essential data files of the model database is basically completed. Subsequently, the validity of the three data files was verified to ensure that the orifice coordinates and maximum depth are not missing, the initial value of the sample spacing is less than the stop value overlapping samples, engineering data is not missing, the depth in the inclinometer table cannot exceed the maximum depth in the orifice table [5], etc. Then, the drill hole database, after the validity verification, is visually displayed in the plan view and compared with the plan layout of the exploration project to ensure that the positions between the drill holes are correct.
2.2. Basic parameters of the model
In order to meet the needs of mine production, accurately delineate the ore body, and calculate reserves, the row, column, and layer directions of the model unit blocks should be perpendicular to the direction, inclination, and thickness of the ore body, respectively. Based on this, the specific scope and basic parameters of the model are determined as follows:
Model range: north coordinate (Y): 2000-6000; east coordinate (X): 2000-4000; elevation (Z): 450-1650.
Unit volume: 25m×25m×10m.
The number of model rows: 80; the number of model columns: 160; the number of model layers: 120.
Model indicators: D1: Sn; D2: Zn.
2.3. Variogram calculation
A variogram is a distance function. It was introduced to compensate for the shortcomings of traditional reserve calculation methods and classical probability statistics. It describes the correlation between variables at different locations. The larger the value, the worse the correlation. In general, the variogram increases with the increase of the distance h. After h reaches a specific value, the value of the variogram reaches the maximum, and then it remains unchanged [6]. After the comprehensive analysis of geological information and the modeling study, the experimental variograms in each direction are calculated and fitted, and the theoretical variograms are finally calculated (Table 1).
Table 1. Theoretical variation function parameter table
direction | Towards | tendency | Vertical | |
Zn | A | 40.116 | 41.162 | 14.359 |
C0 | 2.871 | 4.199 | 2.769 | |
C | 5.414 | 3.471 | 2.847 | |
C0+C | 8.285 | 7.670 | 5.616 | |
C/A | 0.1350 | 0.084 | 0.198 | |
Sn | A | 20.581 | 16.419 | 13.876 |
C0 | 2.234 | 0.167 | 0.124 | |
C | 2.289 | 0.202 | 0.124 | |
C0+C | 4.523 | 0.369 | 0.248 | |
C/A | 0.111 | 0.012 | 0.009 | |
Note: A: Variable range C0: Nugget constant C: Transition constant C0+C: Abutment value C/A: The degree of change in unit range.
After the theoretical variogram is obtained, the variance verification method is used to test it. The principle is to use the selected theoretical variogram parameters to perform Kriging estimation on the data around the known data. Finally, the estimated value is compared with the original value, and the comparison result is statistically analyzed. Generally speaking, the difference between the two data sets in a good variance verification result is minimal, and the variance is also minimal. And with a good positive correlation, you can judge the correctness of the theoretical variogram parameters. After using Surpac software to verify the variance, the following results are obtained (Table 2, Figure 1-Figure 4):
Table 2. Kriging residual verification statistical results table
index | Zn | Sn | |
Residual mean | 0.0446 | 0.004 | |
Standard deviation | 1.4786 | 0.1777 | |
variance | 2.1862 | 0.0316 | |
Number of samples | 47560 | 47459 | |
Residual parameter between two standard deviations | 95% | 96.03% | |
Mean Kriging variance | 2.5214 | 0.0385 | |
|
| ||
Figure 1. Zn Kriging residual histogram | Figure 2. Zn Kriging residual/standard deviation histogram | ||
|
| ||
Figure 3. Sn Kriging residual histogram | Figure 4. Sn Kriging residual/standard deviation histogram | ||
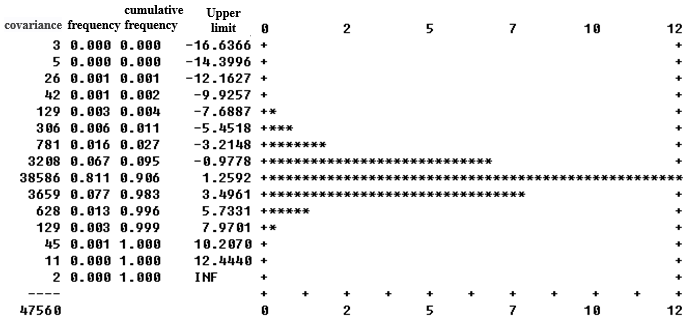
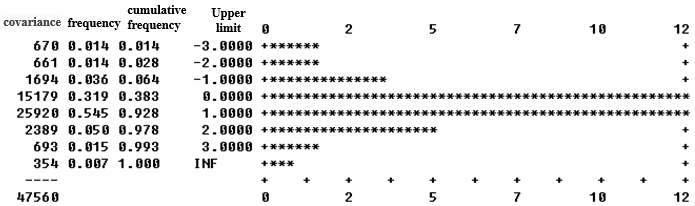
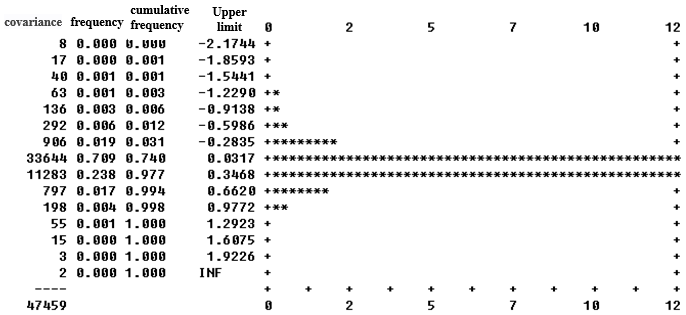
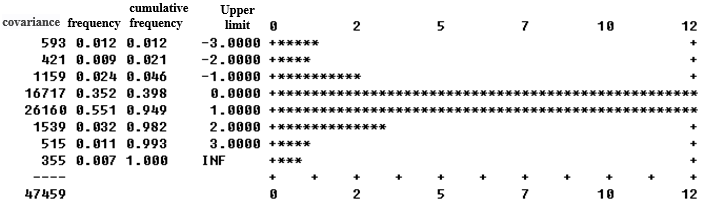
From the results in Table 2 and Figure 1 to Figure 4, it can be seen that the mean Kriging residuals of Sn and Zn are close to 0; the error between the actual Kriging variance and the theoretical Kriging variance is much less than 15%; The residual parameters between the two standard deviations are close to 95%; while the Kriging residuals and the Kriging residuals/standard deviation histograms of Sn and Zn all obey the normal distribution, which meets the test standards. Therefore, it is correct to use the theoretical variation function in Table 1 to fit the data; that is, it is feasible to use this data set to estimate the grade and establish the grade model.
2.4. Construction of ore body model
The constructed ore body model can not only accurately grasp the geometric spatial form of the ore body but also lay the foundation for the evaluation range of the grade model [7-9]. This article uses the boundary grade of the ore as a benchmark, supplemented with borehole data, using Surpac's solid model function to perform a geological interpretation of each section to generate a series of closed curves. The section lines of each exploration line are put into a three-dimensional space, and the adjacent exploration lines are connected to the triangle network according to the trend of the ore body, and the two ends of the ore body are sealed to form an ore body entity. Finally, the validity of the triangulation network is verified for the formed ore body entity[10], and the establishment of the ore body model can be completed after passing. The result is shown in Figure 5.
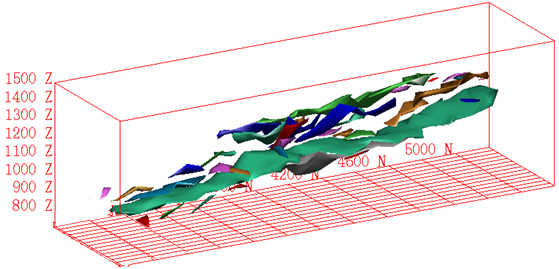
Figure 5. Physical model of the Manjiazhai tin-zinc polymetallic deposit
2.5. Establishment of grade model
The process of grade modeling is to estimate the grade of each unit block within the range of the ore body model according to the geological information around the unit block [11-12]. This time, taking the established ore body solid model as the regional constraint condition, the grade Kriging interpolation is performed on the ore body. The range of the grade block model covers the area determined by all prospecting boreholes collected in the mine, and the spherical variation function model is adopted. The variogram analysis and fitting are carried out along the 3 directions of the ore body’s strike, inclination, and thickness, respectively, and combined with the characteristics of the grade distribution of various elements in the mining area. The ordinary Kriging method of the block model module of Surpac software is used to estimate the grade model. Calculate 8 attribute values, such as zinc grade, tin grade, unit block volume or quantity, zinc metal quantity, tin metal quantity, and comprehensive metal quantity[13-15]. Finally, the grade model of the Manjiazhai tin-zinc polymetallic deposit is obtained. (Figure 6).
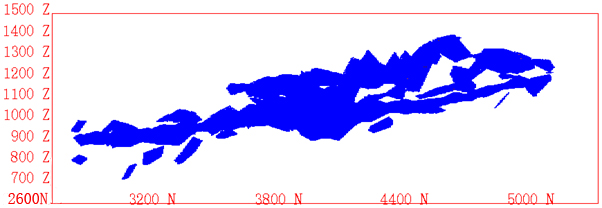
Figure 6. Cross-section of the grade model of the Manjiazhai tin-zinc polymetallic deposit
After the grade model is established, different colors or patterns can be used to represent each metal element's grade distribution [16]. It can also generate grade distribution profiles in any direction to reveal the distribution of grades inside the ore body and provide a basis for the comprehensive utilization of mine resources.
3. Economic evaluation of mineral deposit
For several deposits of the same mineral type, due to the significant differences in the size of the deposit, the depth of the ore body, the thickness, and the grade and composition of the ore, the physical geography and transportation of the deposit will also be different. The mining method, ore beneficiation performance, and cost are also different. Therefore, the industrial index of the mineral deposit cannot remain unchanged [17]. The changes in industrial indicators of mineral deposits will have a chain reaction, such as changes in boundary grade, which will cause changes in ore body shape (number), occurrence, average grade, ore reserves, etc. It even causes changes in mining and dressing technology, cost indicators, recovery rates of valuable components, and economic benefits of mine production. After the ore deposit is digitized, multiple indicators can be selected to dynamically circle various plans for the ore body, and the multi-objective decision-making method can be combined to choose a plan suitable for the actual situation of the enterprise.
3.1. Dynamic delineation of ore bodies with single zinc grade
Based on the establishment of the grade model, four ore body schemes are respectively circled according to different indicators[18], such as Zn0.8%, 0.97%, 2.00%, and 3.20%, and each scheme will get a set of ore body parameters, and economic parameters. On this basis, the multi-objective decision-making method is used to select the optimal plan for the enterprise to adopt, and this plan can be adjusted at any time according to the changes in the production cost of the mine and the market price of the product. The calculation tables of 4 different schemes are compared and analyzed, and the results are shown in Table 3.
Table 3. Changes of ore bodies with different cut-off grades of Zn
Cut-off grade (%) | 0.80 | 0.97 | 2.00 | 3.20 | ||||||||
elevation (m) | Average grade (%) | Ore volume (Kt) | Metal amount (Kt) | Average grade (%) | Ore volume (Kt) | Metal amount (Kt) | Average grade (%) | Ore volume (Kt) | Metal amount (Kt) | Average grade (%) | Ore Volume (Kt) | Metal Amount (Kt) |
740 | 1.425 | 44.12 | 0.63 | 1.478 | 40.49 | 0.60 | 2.269 | 9.38 | 0.21 | 0.00 | 0.00 | |
800 | 2.037 | 27.92 | 0.57 | 2.163 | 25.15 | 0.54 | 5.476 | 5.75 | 0.32 | 5.476 | 5.75 | 0.32 |
900 | 3.829 | 1079.05 | 41.31 | 3.97 | 1029.61 | 40.88 | 4.401 | 880.85 | 38.77 | 5.207 | 598.46 | 31.16 |
1000 | 4.17 | 3817.28 | 159.16 | 4.327 | 3643.16 | 157.63 | 4.952 | 2980.34 | 147.58 | 5.734 | 2227.37 | 127.71 |
1100 | 3.408 | 1790.68 | 61.03 | 3.533 | 1705.64 | 60.26 | 4.713 | 1083.53 | 51.07 | 6.026 | 677.10 | 40.81 |
1200 | 3.706 | 1694.77 | 62.80 | 3.81 | 1634.46 | 62.27 | 4.533 | 1247.63 | 56.56 | 5.356 | 885.11 | 47.41 |
1300 | 3.725 | 735.07 | 27.38 | 3.767 | 724.20 | 27.28 | 4.434 | 556.47 | 24.67 | 5.048 | 415.81 | 20.99 |
1400 | 2.069 | 49.23 | 1.02 | 2.101 | 47.95 | 1.01 | 2.205 | 36.23 | 0.80 | 0.00 | 0.00 | |
total | 3.911 | 57528.41 | 2250.22 | 4.05 | 55033.35 | 2228.08 | 4.839 | 42040.61 | 2034.47 | 5.768 | 29811.29 | 1719.48 |
3.2. Dynamic delineation of ore bodies by comprehensive grade
Calculate the other associated elements of the deposit based on market prices, production costs, etc. [12], and determine the equivalent conversion coefficient of the symbiotic element's grade relative to the zinc grade, and then the comprehensive Zn grade can be determined. The ore body can be delineated according to the comprehensive grade, and the ore body can be delineated by the same scheme as Zn single element. The calculation results of the four schemes are compared. See Table 4.
Table 4. Changes of ore bodies of different comprehensive grades
Cut-off grade (%) | 0.80 | 0.97 | 2.00 | 3.20 | ||||||||
eleva-tion (m) | Average grade (%) | Ore volume (Kt) | Metal amount (Kt) | Average grade (%) | Ore volume (Kt) | Metal amount (Kt) | Average grade (%) | Ore volume (Kt) | Metal amount (Kt) | Average grade (%) | Ore volume (Kt) | Metal amount (Kt) |
740 | 1.695 | 44.12 | 0.75 | 1.736 | 40.49 | 0.70 | 2.401 | 9.38 | 0.23 | 0.00 | 0.00 | |
800 | 2.767 | 27.92 | 0.77 | 2.903 | 25.15 | 0.73 | 6.043 | 5.75 | 0.35 | 6.043 | 5.75 | 0.35 |
900 | 4.453 | 1079.05 | 48.05 | 4.607 | 1029.61 | 47.43 | 5.073 | 880.85 | 44.69 | 5.907 | 598.46 | 35.35 |
1000 | 4.686 | 3817.28 | 178.89 | 4.851 | 3643.16 | 176.72 | 5.502 | 2980.34 | 163.97 | 6.317 | 2227.37 | 140.70 |
1100 | 4.018 | 1790.68 | 71.95 | 4.152 | 1705.64 | 70.81 | 5.352 | 1083.53 | 57.99 | 6.64 | 677.10 | 44.96 |
1200 | 4.209 | 1694.77 | 71.33 | 4.319 | 1634.46 | 70.59 | 5.079 | 1247.63 | 63.37 | 5.964 | 885.11 | 52.79 |
1300 | 4.156 | 735.07 | 30.55 | 4.197 | 724.20 | 30.39 | 4.893 | 556.47 | 27.23 | 5.537 | 415.81 | 23.02 |
1400 | 2.208 | 49.23 | 1.09 | 2.241 | 47.95 | 1.07 | 2.349 | 36.23 | 0.85 | 0.00 | 0.00 | |
total | 4.476 | 57528.4 | 2574.84 | 4.62 | 55033.4 | 2542.34 | 5.452 | 42040.6 | 2292.06 | 6.427 | 29811.3 | 1916.12 |
3.3. Comparison of single zinc grade and comprehensive grade delineated ore bodies
Using single-element boundary grade to delineate the ore body, we only use a single component in the entire ore deposit to determine whether a specific ore section has utility value. The comprehensive grade refers to utilizing the boundary grade of the main components to delineate the ore body in the mining process. However, before delineating the ore body, the grade of the associated component should be converted into the grade of the main element, and after adding it to the grade of the main component, the initially determined boundary grade is used to delineate the ore body. Therefore, using comprehensive grade to delineate the ore body is conducive to extensively utilizing various associated resources of the mine and avoids waste of resources.
For the Manjiazhai tin-zinc polymetallic deposit, the comparison results of the two schemes delineated ore bodies are shown in Table 5:
Table 5. Changes of delineated ore bodies with different boundary grades of the two schemes
Cut-off grade (%) | Ore volume (kt) | Average grade (%) | Metal amount (kt) | Comprehensive average grade (%) | Comprehensive metal content (kt) |
0.8 | 57528.41 | 3.911 | 2250.22 | 4.476 | 2574.84 |
0.97 | 55033.35 | 4.05 | 2228.08 | 4.62 | 2542.34 |
2.0 | 42040.61 | 4.839 | 2034.47 | 5.452 | 2292.06 |
3.2 | 29811.29 | 5.768 | 1719.48 | 6.427 | 1916.12 |
Use the section function in the Surpac block module to compare and analyze the two delineation schemes to generate the exact middle section of the ore body, as shown in Figure 7.
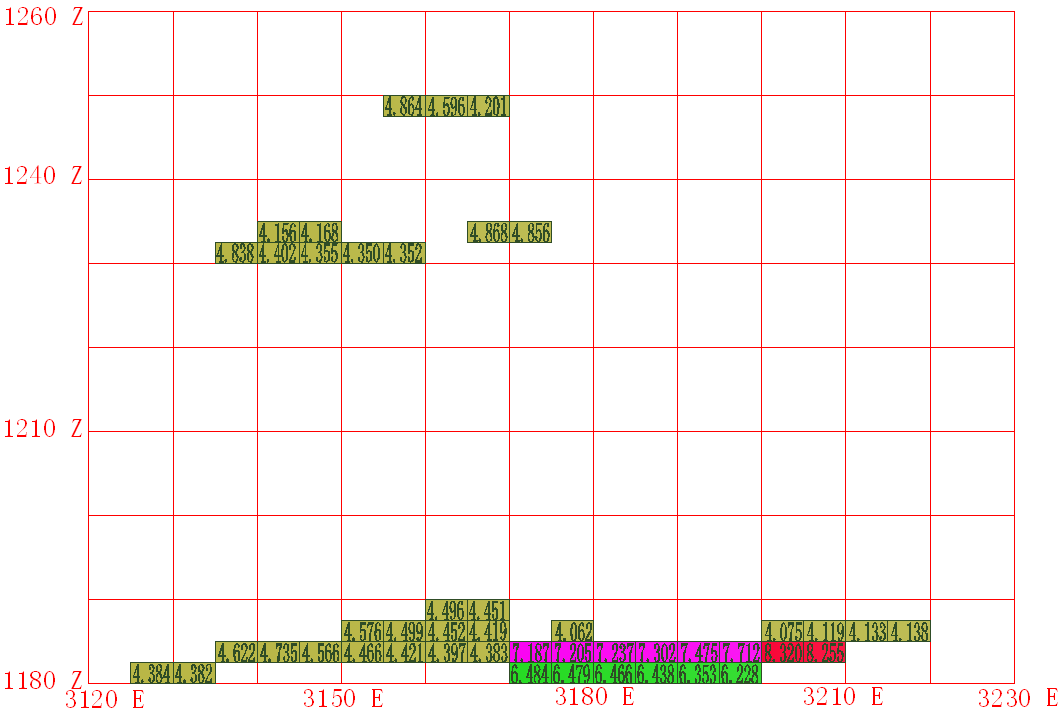
Exploration section view of ore body No. 113 delineated by single Zn break-even grade (4.05%).
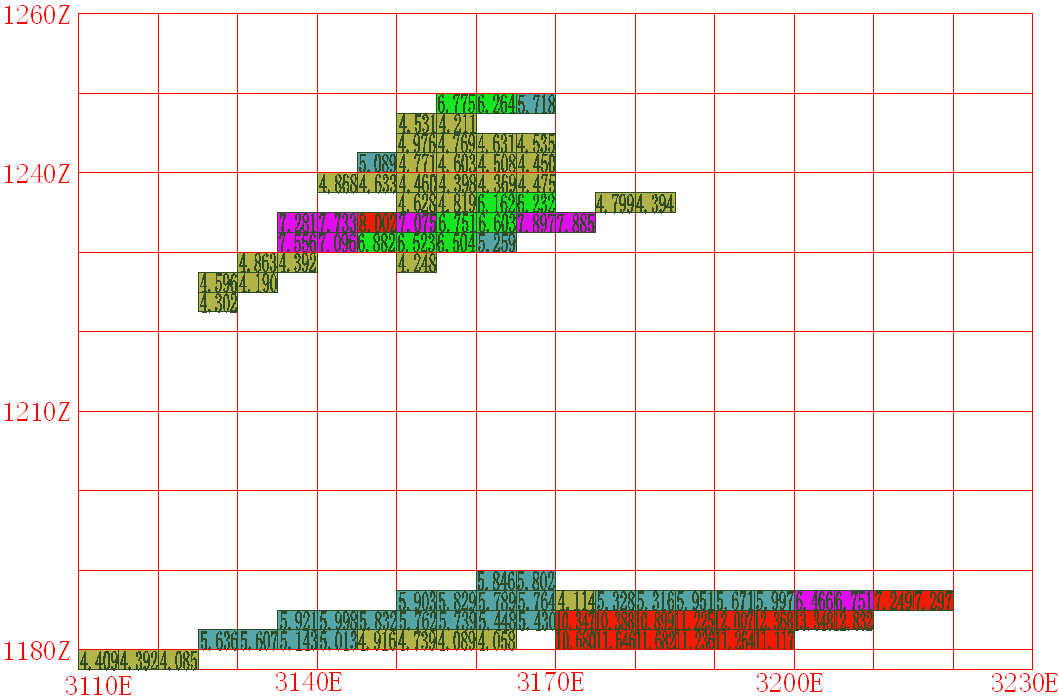
Exploration profile of ore body No. 113 delineated by the comprehensive break-even grade (4.05%).
Figure 7. Sectional view of ore body morphology delineated by two schemes under the same boundary grade
4. Conclusion
After using Surpac software to establish a digital ore deposit model, the dynamic management of mine production can be realized, including the dynamic query of data, the three-dimensional visual model of the mine, the dynamic delineation of the ore body, and the automatic mapping of the computer. The three-dimensional visual model of the ore deposit and the dynamic delineation of the ore body play a significant role in the economic evaluation of the mine, which is mainly reflected in: (1) The physical model of the ore body intuitively reflects the spatial continuity and thickness changes of the ore body;. In contrast, the grade model reflects the spatial distribution of element grades, resource reserves, and grades in the ore deposit. (2) The dynamic delineation of the ore body can be quickly realized based on establishing the mathematical model of the ore deposit. Through the changes of the ore body delineated by different boundary grades, the vertical change of the grade tonnage of the ore body can be clearly obtained. Including the rich and thin areas of the ore body can guide the mining work and ore blending work in a targeted manner. (3) After converting the associated components into the grade of the main component Zn, the comprehensive average grade is much higher than the average grade of a single Zn under the same boundary grade. According to the relationship between the amount of ore, metal, and the grade, it can also be obtained intuitively. Under the same boundary grade, the metal content of the ore body delineated by the comprehensive grade is much higher than the metal quantity of the ore body delineated by the single grade. (4) Under the same boundary grade, the ore body delineated by the comprehensive grade has better continuity, and the volume is obviously more extensive than the ore body delineated by the single Zn component. The corresponding amount of metal has also increased to achieve full and reasonable utilization of resources, improve the service life of the mine, and increase the overall economic benefit of the mine.
To sum up, with the rapid development of computer technology today, the results of my exploration are "digitized." Establishing a digital mineral deposit model can not only realize the three-dimensional visualization of the ore body but also play a specific guiding role in the comprehensive utilization of mineral resources and mine mining planning. At the same time, it can also provide guidance for the realization of the green and sustainable development of the mine.
Acknowledgments
This work were financially supported by Scientific Research Foundation Project of Kunming Metallurgical College: Application of digital spatial information system in Panlongshan Iron Mine, Menghai County, Yunnan Province(2022xjy22) fund and Scientific Research Fund project of Education Department of Yunnan Province:Research on ecological mine development model of resource-based enterprises in Yunnan Province under the background of ecological civilization--a case study of lead-zinc mining enterprises(2022J1308).
Zhuo-jun Ren is a correspondent.
References
[1]. Song, G., Bai, X., Zhao, J., & Zhang, Y. (2017). Reserve estimation and three-demensional model building for deposits based on Surpac software: a case study of Zhuanzhilian Ore Section in Dongping Gold district, north Hebei Province. Gold, 38(11), 9-13.
[2]. Li, G., & Hu, N. (2010). Study on the Digital 3D Modeling and its Application in a Gold&Copper Deposit. 2010 International Conference on Management and Service Science, 8.
[3]. Turner, A. K. (2006). Challenges and trends for geological modelling and visualization. Bulletin of Engineering Geology and the Environment, 65, 109-127.
[4]. Wang, B., Liu, B., Wang, T., et al. (2011). Research and application of the three-dimensional visualization geological modeling of mine based on surpac. China Mining Magazine, 20(2), 106-109.
[5]. Wei, K. (2020). The Realization and Geological significance of YangLa Cu digital deposit in NW Yunna. Yunnan Geology, 39(4), 516-521.
[6]. Li, Y., Qin, D., Cai, Y., et al. (2004). Three-Dimension Mathmatical Model of the Dahongshan Iron Ore Deposit in Yunnan Province. Bulletin of Mineralogy, Petrology and Geochemistry, 23(4), 332-335.
[7]. Luo, Z., Liu, X., Su, J., et al. (2006). Building of Three-Dimensional Models of Deposit Based on Surpac. Metal Mine, 358(4), 33-36, 72.
[8]. Huang, Y., & Esple, S. (2005). A 3D mine simulation model for decision-making in mine design and production. International Journal of Surface Mining, Reclamation and Environment, 19(4), 251-259.
[9]. Huang, Z., Song, J., Hu, K., & Li, Y. (2011). Mining 3D visualization simulation and safety evaluation. 2011 International Conference on Management of e-Commerce and e-Government, 261-268.
[10]. Sganzerla, C., Seixas, C., & Conti, A. (2016). Disruptive Innovation in Digital Mining. Procedia Engineering, 138, 64-71.
[11]. Yan, L., Tang, G., Yu, X., et al. (2021). Three-Dimensional Model Construction and Reserves Estimation of the Heiniudong Cu Orebodies Based on Surpac. Acta Geologica Sichuan, 41(2), 338-342.
[12]. Smirnova, A. D., Chen, S., & Mikhaylova, T. V. (2022). Geological Mathematical Block Modelling in Kuzbass Mining Industry. 2022 International Multi-Conference on Engineering, Computer and Information Sciences (SIBIRCON), 1970-1973.
[13]. Wang, G., Li, R., Carranza, E. J. M., Zhang, S., Yan, C., Zhu, Y., Qu, J., Hong, D., Song, Y., Han, J., Ma, Z., Zhang, H., & Yang, F. (2015). 3D geological modeling for prediction of subsurface Mo targets in the Luanchuan district, China. Ore Geology Reviews, 65, 1-19.
[14]. Khakulov, V. A., Shapovalov, V. A., Ignatov, V. N., Ignatov, M. V., Karpova, Z. V., & Khatukhova, D. V. (2022). Digital Transformation of Mining and Technological Mapping of Rock Masses Operational Data. 2022 International Conference on Quality Management, Transport and Information Security, Information Technologies (IT&QM&IS), 90-93.
[15]. Greevy, O., Lanza, M., & Wysseier, C. (2015). Visualizing Feature Interaction in 3-D. 3rd IEEE International Workshop on Visualizing Software for Understanding and Analysis, 114-119.
[16]. Jiao, H., Huang, Y., Gao, F., et al. (2021). Application of Surpac 3D-geological modeling in mineralization and structure of studies of Jiama skarn. China Mining Magazine, 30(suppl 2), 201-205.
[17]. Guo, Q., Dai, X., & Sun, C. (2015). The Sensitivity Analysis of Associated Elementary Grade for the Comprehensive Grade in Polymetallic Deposit Mining. Journal of Gansu Sciences, 27(4), 91-94.
[18]. Wu, Q., & Xu, H. (2014). Three-dimensional geological modeling and its application in Digital Mine. Earth Sciences, 57(3), 491-502.
Cite this article
Wu,W.;Ren,Z.;Liu,W.;Zhu,Y.;Deng,J. (2025). Visualized dynamic analysis of digital deposit model in mine economic evaluation. Advances in Engineering Innovation,16(1),1-7.
Data availability
The datasets used and/or analyzed during the current study will be available from the authors upon reasonable request.
Disclaimer/Publisher's Note
The statements, opinions and data contained in all publications are solely those of the individual author(s) and contributor(s) and not of EWA Publishing and/or the editor(s). EWA Publishing and/or the editor(s) disclaim responsibility for any injury to people or property resulting from any ideas, methods, instructions or products referred to in the content.
About volume
Journal:Advances in Engineering Innovation
© 2024 by the author(s). Licensee EWA Publishing, Oxford, UK. This article is an open access article distributed under the terms and
conditions of the Creative Commons Attribution (CC BY) license. Authors who
publish this series agree to the following terms:
1. Authors retain copyright and grant the series right of first publication with the work simultaneously licensed under a Creative Commons
Attribution License that allows others to share the work with an acknowledgment of the work's authorship and initial publication in this
series.
2. Authors are able to enter into separate, additional contractual arrangements for the non-exclusive distribution of the series's published
version of the work (e.g., post it to an institutional repository or publish it in a book), with an acknowledgment of its initial
publication in this series.
3. Authors are permitted and encouraged to post their work online (e.g., in institutional repositories or on their website) prior to and
during the submission process, as it can lead to productive exchanges, as well as earlier and greater citation of published work (See
Open access policy for details).
References
[1]. Song, G., Bai, X., Zhao, J., & Zhang, Y. (2017). Reserve estimation and three-demensional model building for deposits based on Surpac software: a case study of Zhuanzhilian Ore Section in Dongping Gold district, north Hebei Province. Gold, 38(11), 9-13.
[2]. Li, G., & Hu, N. (2010). Study on the Digital 3D Modeling and its Application in a Gold&Copper Deposit. 2010 International Conference on Management and Service Science, 8.
[3]. Turner, A. K. (2006). Challenges and trends for geological modelling and visualization. Bulletin of Engineering Geology and the Environment, 65, 109-127.
[4]. Wang, B., Liu, B., Wang, T., et al. (2011). Research and application of the three-dimensional visualization geological modeling of mine based on surpac. China Mining Magazine, 20(2), 106-109.
[5]. Wei, K. (2020). The Realization and Geological significance of YangLa Cu digital deposit in NW Yunna. Yunnan Geology, 39(4), 516-521.
[6]. Li, Y., Qin, D., Cai, Y., et al. (2004). Three-Dimension Mathmatical Model of the Dahongshan Iron Ore Deposit in Yunnan Province. Bulletin of Mineralogy, Petrology and Geochemistry, 23(4), 332-335.
[7]. Luo, Z., Liu, X., Su, J., et al. (2006). Building of Three-Dimensional Models of Deposit Based on Surpac. Metal Mine, 358(4), 33-36, 72.
[8]. Huang, Y., & Esple, S. (2005). A 3D mine simulation model for decision-making in mine design and production. International Journal of Surface Mining, Reclamation and Environment, 19(4), 251-259.
[9]. Huang, Z., Song, J., Hu, K., & Li, Y. (2011). Mining 3D visualization simulation and safety evaluation. 2011 International Conference on Management of e-Commerce and e-Government, 261-268.
[10]. Sganzerla, C., Seixas, C., & Conti, A. (2016). Disruptive Innovation in Digital Mining. Procedia Engineering, 138, 64-71.
[11]. Yan, L., Tang, G., Yu, X., et al. (2021). Three-Dimensional Model Construction and Reserves Estimation of the Heiniudong Cu Orebodies Based on Surpac. Acta Geologica Sichuan, 41(2), 338-342.
[12]. Smirnova, A. D., Chen, S., & Mikhaylova, T. V. (2022). Geological Mathematical Block Modelling in Kuzbass Mining Industry. 2022 International Multi-Conference on Engineering, Computer and Information Sciences (SIBIRCON), 1970-1973.
[13]. Wang, G., Li, R., Carranza, E. J. M., Zhang, S., Yan, C., Zhu, Y., Qu, J., Hong, D., Song, Y., Han, J., Ma, Z., Zhang, H., & Yang, F. (2015). 3D geological modeling for prediction of subsurface Mo targets in the Luanchuan district, China. Ore Geology Reviews, 65, 1-19.
[14]. Khakulov, V. A., Shapovalov, V. A., Ignatov, V. N., Ignatov, M. V., Karpova, Z. V., & Khatukhova, D. V. (2022). Digital Transformation of Mining and Technological Mapping of Rock Masses Operational Data. 2022 International Conference on Quality Management, Transport and Information Security, Information Technologies (IT&QM&IS), 90-93.
[15]. Greevy, O., Lanza, M., & Wysseier, C. (2015). Visualizing Feature Interaction in 3-D. 3rd IEEE International Workshop on Visualizing Software for Understanding and Analysis, 114-119.
[16]. Jiao, H., Huang, Y., Gao, F., et al. (2021). Application of Surpac 3D-geological modeling in mineralization and structure of studies of Jiama skarn. China Mining Magazine, 30(suppl 2), 201-205.
[17]. Guo, Q., Dai, X., & Sun, C. (2015). The Sensitivity Analysis of Associated Elementary Grade for the Comprehensive Grade in Polymetallic Deposit Mining. Journal of Gansu Sciences, 27(4), 91-94.
[18]. Wu, Q., & Xu, H. (2014). Three-dimensional geological modeling and its application in Digital Mine. Earth Sciences, 57(3), 491-502.