


1. Introduction
According to energy use data from the U.S. Energy Information Administration (EIA), the contribution of buildings to energy consumption, both residential and commercial, has steadily increased globally, reaching 20% to 40% in developed countries [1]. Over the past 25 years, energy use in residential and commercial buildings has increased by about 7% and 10%, respectively [2]. Today, with a growing population and increasing demand for functionality and comfort in buildings, and considering that people are spending more and more time indoors, this upward trend in energy demand will continue [3]. Therefore, both national and international levels attach great importance to building energy consumption, among which the energy consumption of residential buildings cannot be ignored.
Global climate change, as well as population growth, will have a serious impact on building energy consumption. For example, cooling energy consumption in the building sector is likely to increase significantly due to the projected severe increase in temperatures in the future [4]. Residential energy consumption is mainly impacted by various factors, such as the building size, the number of occupants, the thermal characteristics of the building envelope, the operation of the HVAC and refrigeration systems, and the use of electrical appliances such as lighting systems [5]. In addition, if energy use can be minimized, energy waste can be reduced. Improving the energy efficiency of residential buildings will effectively reduce the amount of money spent on energy by the state and the government each year, and at the same time, it will also reduce carbon emissions and environmental pollution [6]. Since building energy consumption accounts for a large part of total energy consumption in the US, reducing energy consumption in residential buildings can contribute significantly to reducing overall energy consumption.
In the early stages of traditional building design workflow, architects are unable to quantify the environmental impact of a building due to incomplete information on materials and processes, and they need to rely on building energy modelers to conduct building energy simulations and share the energy usage. In the past decade, integrating the building energy modeling process with the building design process has become popular and researched. By doing building energy simulation early on in the design stage, it enables building architects to conduct an environmental assessment of their designs and help optimize the building envelope materials [7].
While a variety of data needs to be coordinated during the building design process, the manual process can be very time-consuming. Integrated design can evaluate and analyze a wide range of conditions, such as planned space, building flow, energy consumption, and preliminary costs [8]. These analyses are processed through a model that predicts the applicability of different conditions, computationally supporting the energy-efficient design and accomplishing the most reasonable low-energy building design solution [9]. Thus, integrated design ensures optimal building performance when other specialists are working on the building design, while integrated dynamic modeling can be combined with design tools to better support designers [10].
Today, energy efficiency in buildings is receiving a lot of attention, and energy policies at national and even international levels are closely related. Among building services, the growth in HVAC systems energy use is particularly significant (50% of building consumption and 20% of total consumption in the US) [3]. Nowadays, we use various tools such as EnergyPlus, DOE, TRANSYS, and ESP-r for building energy modeling. These tools are designed for energy loss and energy usage calculation [11]. The focus of this research paper is to use EnergyPlus to perform building energy modeling of selected typical Chicago residential prototypes and to investigate how variations in various design factors affect the energy consumption of a building, particularly as it relates to the HVAC and cooling system.
Chicago is a good example of climate variability, thus providing an adequate testing environment for green buildings. Chicago has distinct seasons, with long, cold winters and hot, dry summers. The population density is high, leading to significant demand for cooling and heating. In regions where the climate characteristics are not distinct and the temperature difference between seasons is small, the energy consumption for cooling and heating is relatively low. Choosing Chicago as the research site makes the findings more instructive for energy optimization in other regions with high heating and cooling energy demands, and the results are more universally applicable. Most studies used high-rise buildings as architectural models, considering high-rise buildings as development hotspots. However, the types of residential buildings in Chicago are mostly two- and three-story apartments. In the world, mid- and low-rise buildings account for a large proportion of residential buildings, and most residential buildings that need optimization are mid- and low-rise buildings. Therefore, choosing low-rise buildings as research models in this study is more reliable. Laid the foundation for future simulation validation in a broader range of climatic regions and more types of buildings.
This research used the integrated design combining building model and energy simulation, including active design and passive design, to conduct a comprehensive analysis of the energy consumption of heating, cooling, and the whole building. Unlike most studies that only focus on the enhancements of passive envelope structures or the optimization of HVAC, this study is more comprehensive. Active design comprehensively considered occupant activities, comfort, and energy-saving goals. It set temperature setpoint schedules based on occupant activities, making it more operational compared to other active design factors. Clustering the thickness and thermal conductivity of different wall layers in passive design eliminated the limitations and uncertainties of research results caused by single-factor studies. Compared to other studies that often focus on single factors or cases, this approach is innovative. No prior study has compared ±30% parametric variation in wall layer properties while calibrating occupant-centric temperature schedules in a low-rise prototype in a continental climate. In the analysis, the effectiveness of the optimization plan is verified in this research through a comparison of ±30% in both positive and negative aspects. This is innovative compared to previous research. Through simulation and validation, the effects of various design factors on optimizing building energy consumption were demonstrated, providing comprehensive optimization guidance.
2. Literature review
2.1. US home energy consumption review
Home energy consumption can be mainly divided into year-round energy consumption and seasonal energy consumption. Year-round energy consumption mainly includes lighting, TVs, washing machines, and other equipment, such as computer tablets, cell phones, and smart robots, while seasonal energy consumption is used mainly to regulate the temperature to improve the occupants’ comfort level by consuming heating and air-conditioning energy [12].
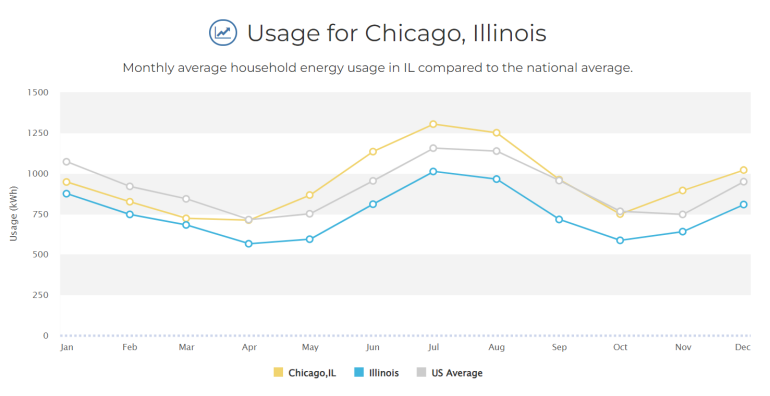
The residential energy sources in Chicago are mainly electricity and gas, and the average cost of electricity for Chicago residential homeowners is about $124.24, which is much higher compared to the U.S. average of $118.93. Gas usage level is also higher than the average U.S. bill. This indicates that Chicago, as the third-largest city in the United States, consumes more energy than the U.S. average, as Figure 1 shows [13].
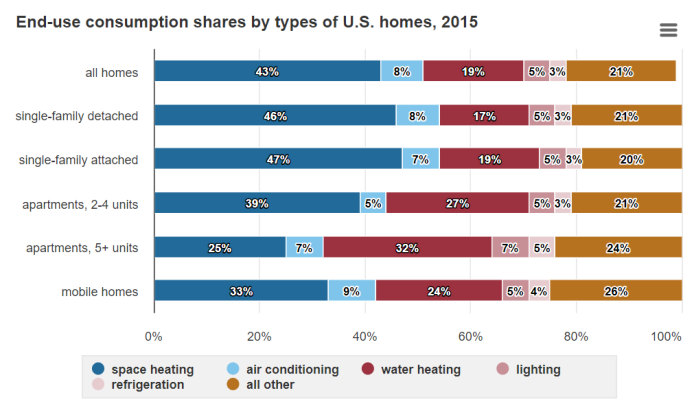
The survey conducted by EIA showed that energy consumption varies slightly by type of home, but most of it is used in the HVAC and ACR systems, as Figure 2 illustrates.
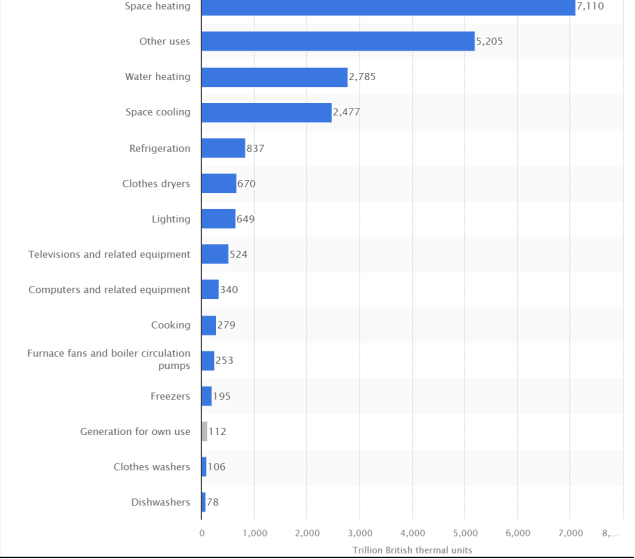
As Figure 3 shows, in 2022, the top energy usage in a typical US residential building are space heating, water heating, space cooling, and refrigeration. Where 65% of home residential energy is used for room heating and cooling, and 14% for hot water, if we consider and adopt energy-efficient cooling and heating systems in our design, we can greatly reduce the overall energy consumption of home energy [13].
2.2. Building energy simulation tool review
There are various building simulation tools available. EnergyPlus is a complete building energy simulation system integrated with the HVAC system for simultaneous design, comfort metrics calculations, and simulation of regulated and under-regulated spaces, with multiple upgrades to facilitate co-simulation with other engines [14]. DOE can predict energy conditions and make forecasts for all types of buildings and can especially pre-process weather data, and its projections are made on an hourly basis. However, new versions of eQUEST, DOE-2.2E, and DOE-2.3E provide more powerful and accurate HVAC modeling and simulation algorithms [15]. Since DOE does not have a strict zonal heat balance program, the prediction is subject to a large error compared to EnergyPlus when one zone is regulated for a specific period and adjacent zones are not regulated [16]. TRNSYS is one of the more flexible types of energy simulation systems, generally used to simulate transient systems, widely used in the prediction of electrical and thermal energy because of its extensive library of components, so the user can modify or write the elements needed to extend the functionality of the environment [17]. ESP-r, unlike DOE, is a general-purpose energy modeling tool for multi-zone simulation systems, and its models can encompass both room-level and neighborhood scopes to meet specific forecasting needs [18]. ESP-r can also simulate and predict heat, air, moisture, light, and electricity for a specified time and space [19].
These are all building energy simulation tools, but the simulation results can be biased when simulating different scenarios. For example, experiments were conducted at the Swiss Federal Laboratory for Materials Testing and Research (EMPA) campus in Dübendorf, Switzerland, where EnergyPlus and DOE are more credible [20].
Through comparison, EnergyPlus has better compatibility, making it easier to connect and run with other programs and applications. For example, Stadler et al. used EnergyPlus to analyze distributed generation technology [21]. Fumo et al. used it to analyze combined cooling, heating, and power systems [22]. EnergyPlus was chosen in this research primarily due to its user-friendly interface, clarity of output data, and capability of simulating hourly building energy consumption, resulting in a better comprehensive simulation performance compared to DOE and other simulation tools [14].
2.3. Significance of integrating building design with building energy simulation
Evaluating the energy consumption and efficiency of buildings is always a complex issue that requires the consideration of many factors. Despite the availability of dynamic energy simulation software, it is still difficult to perform an energy analysis of a building during the design process without integrating it with modeling software. Today, a variety of building information modeling tools can be used for energy analysis of building design, making the interaction between energy information and building design process smoother. For example, it is now possible to automatically generate energy models from building models, and the combination of 3D building models and energy analysis models greatly reduces the steps and time required in building design, and provides a more comprehensive analysis, even considering the internal space and external environment of the building at the same time [23]. At present, many Building Information Modeling programs have the EnergyPlus simulation engine as a plug-in to simulate the energy consumption of the whole building, and this method is also welcomed by architectural designers [24]. The integration of architectural design and building energy consumption simulation is crucial in the field of architectural design, as it has the potential to enhance design efficacy and decrease energy consumption [25].
3. Case studies - building energy simulation using energyplus
3.1. Building prototype summary
DOE provides various building prototypes for energy modelers to conduct building energy simulations. In this research, a residential building prototype is selected to be used [26]. The total building area of this residential building prototype is 331.3 m2, of which the unconditioned building area is 110.4 m2 and the net conditioned building area is 220.8 m2. There are two zones in this building, the living unit 1 and the attic. There are three occupants in this residential building. The door is installed on wall LDB1 Unit 1 with a gross area of 3.7 m2, and the cardinal direction is north. Table 1 summarizes the count of each component in this prototype residential building.
|
Objects |
Total |
Outdoors |
|
Wall |
10 |
10 |
|
Floor |
3 |
0 |
|
Roof |
3 |
2 |
|
Window |
8 |
8 |
|
Door |
1 |
1 |
|
Shading |
4 |
4 |
|
Overhang |
2 |
2 |
In terms of building materials, the main components of the exterior wall include stucco, sheathing console layer, OSB (oriented strand board), wall console layer, and drywall, with the wall console layer being 0.14 m, an important part of the wall structure. However, the interior wall is different, primarily composed of Air 4 in vert, OSB, and drywall. Other parts, such as the exterior roof, are primarily composed of asphalt shingles, while the windows mainly use glass. The floors are divided into attic floors, interior floors, and exterior floors, with various types of materials, but all include plywood.
Chicago is featured with cold weather in the winter, which usually requires a large amount of heating. Studies have shown that heating and cooling occupy the majority of residential building energy consumption in Chicago [13]. Hence, when minimizing the overall building energy consumption, optimizing the heating temperature setpoint schedule through active design strategies can be impactful, such as optimizing the setpoint schedule based on the occupants' activities.
On the other side, another crucial characteristic to investigate the impact on building energy consumption is the thermal conductivity and thickness of the main construction materials of the building. The thermal insulation capability of walls varies by material, as different materials possess distinct characteristics and thermal conductivities, influencing indoor temperature regulation and consequently impacting energy usage. The wall's thickness will also influence its thermal insulation efficacy. As a result, the second design factor chosen to investigate the building energy impact is passive design, which focuses on the thermal conductivity and thickness of the main construction materials.
3.2. Design factor 1 - heating temperature setpoint schedule
In the default use case, the default heating temperature setpoint is 22 degrees Celsius for 24 hours. To optimize the temperature setpoint schedule based on occupants’ activities through active design, below is the updated optimized temperature setpoint schedule: 22 degrees Celsius from 6 AM to 8 AM when the occupants just wake up and have breakfast, 15 degrees Celsius from 8 AM to 5 PM when there are no occupants in the home, 22 degrees Celsius from 5 PM to 10 PM when occupants cook dinner and have family time, and 19 degrees Celsius from 10 PM to 6 AM when it is sleeping time.
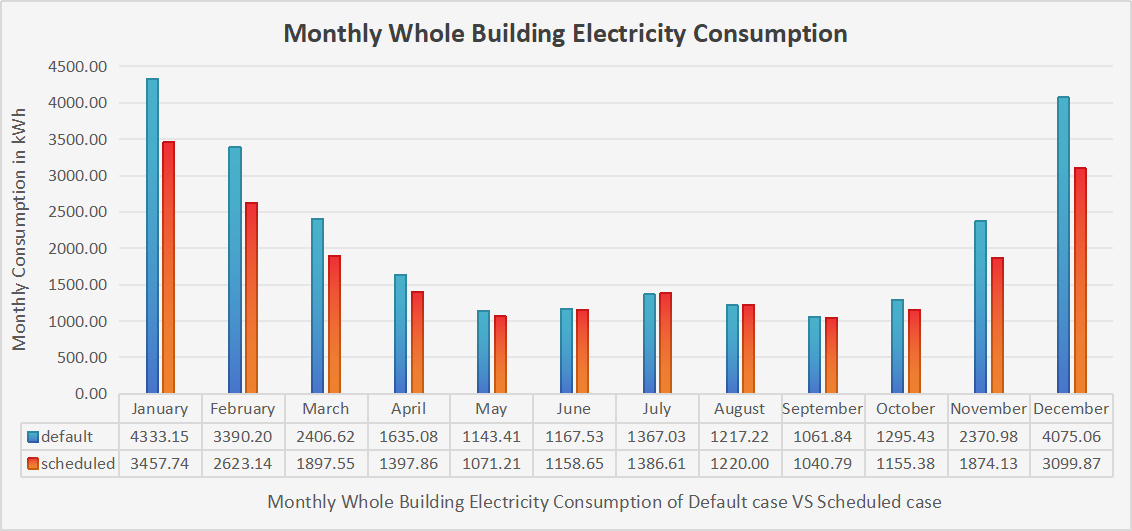
Figure 4 shows the monthly whole building electricity consumption comparing the default case with a case that optimizes temperature setpoint based on occupants’ activities. In both cases, the total electricity consumption trend varies with the weather conditions in Chicago. Electricity consumption is relatively steady in summer but experiences a significant increase in winter, peaking in December and January due to heating needs in cold winter. The energy consumption comparison indicates that the disparity in electricity consumption between the two cases from May to August throughout the summer is minimal. However, in winter, the scheduled case conserves a significant amount of electricity relative to the default case. During winter, a single month can decrease consumption by as much as 975.19 kW·h, representing 24%. The annual electricity consumption savings can amount to 4080.62 kW·h, representing 16%, nearly sufficient to satisfy the power supply requirements for the three summer months of May, June, and July.
Due to the climate conditions in Chicago, with warm summers and harsh winters, the primary electricity consumption for its residential buildings is for heating. Figure 5 shows the monthly electricity use for heating between the default temperature setting and the optimized temperature setting across two distinct cases.
The data indicates that summer has negligible heating power used, while the heating energy is consumed starting in October and November, reaches its zenith in December and January, and diminishes gradually starting in February. By optimizing the heating setpoint based on the occupant’s activities, an average monthly reduction of 30% is achieved, with a peak as high as 35%.
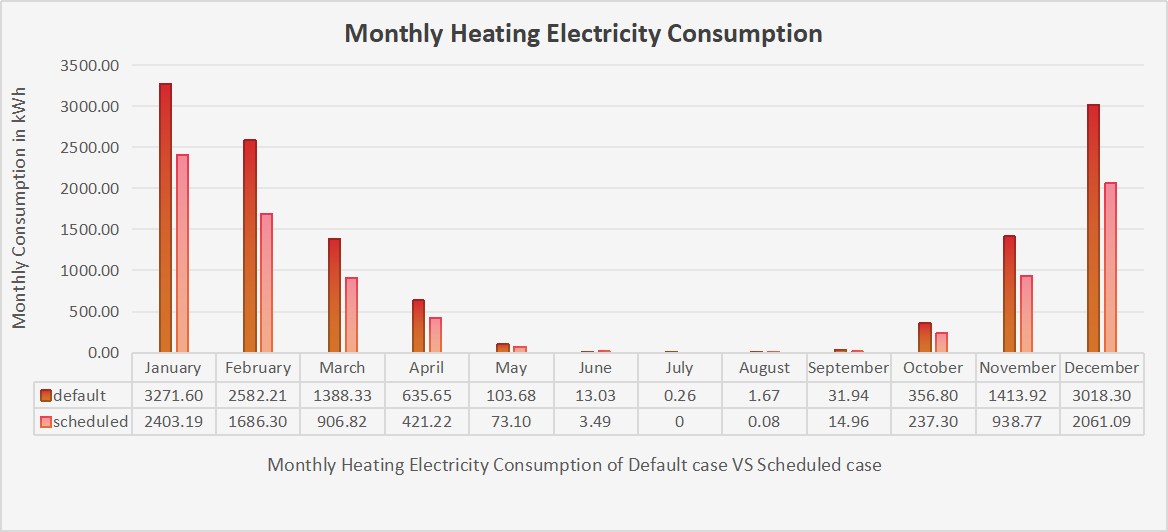
In summary, these data confirm that simply optimizing the heating setpoint schedule can significantly reduce unnecessary electricity consumption. Hence, when minimizing residential building energy consumption, optimizing the temperature setpoint based on occupants’ activities is crucial. The implementation of active design strategies in modern architecture is straightforward, which can reduce construction time and the funds spent on labor. Incorporating active design strategies into smart thermostats or IoT-enabled systems facilitates unified monitoring and management of energy consumption, which can effectively reduce energy consumption.
3.3. Design factor 2 - material property
The chosen residential building resides in Chicago, where there are about four to five extremely cold months in a year and hence needs lots of heating power during winter. Among all the building surfaces, the exterior wall plays a crucial role in providing an insulating layer for the indoor climate. Therefore, the exterior wall is identified as a simulation object in passive design to see the impact of changing the design parameters of the exterior wall on the building energy consumption.
Fourier's Law of Heat Conduction quantifies the diffusion of thermal heat within one material or between materials in contact, as the below formula shows:
Where Q is the heat transfer rate, A is the surface area, and dT/dx is the temperature gradient across the thickness "x" of the material. It means a higher thermal conductivity leads to larger heat transfer, while a larger thickness results in less heat transfer. Therefore, to optimize wall design parameters, it is vital to optimize the wall thickness and its thermal conductivity.
The exterior wall materials of this building prototype comprise five components. Table 2 shows the thermal conductivity and thickness comparison of the five layers of the identified exterior wall. As it shows, the innermost layer is the wall console layer with the most considerable thickness at 0.130 m and a thermal conductivity of 0.057 W·m-1·k-1, ranking second in insulation performance after the sheathing layer. Conversely, the sheathing has the lowest thermal conductivity at 0.035 W·m-1·k-1 and a thickness of 0.030 m, only second to the wall console. Therefore, wall console and sheathing layers are chosen for the simulation comparisons.
|
Layer |
Conductivity |
Thickness |
Influence Evaluation |
|
Wall console |
0.057 W·m-1·k-1 |
0.130 m |
More influential |
|
Sheathing |
0.035 W·m-1·k-1 |
0.030 m |
More influential |
|
Dry wall |
0.160 W·m-1·k-1 |
0.010 m |
Less influential |
|
OSB 7/16 inch |
0.116 W·m-1·k-1 |
0.010 m |
Less influential |
|
Stucco |
0.087 W·m-1·k-1 |
0.003 m |
Least important |
3.3.1. Thermal conductivity
3.3.1.1. Wall console layer
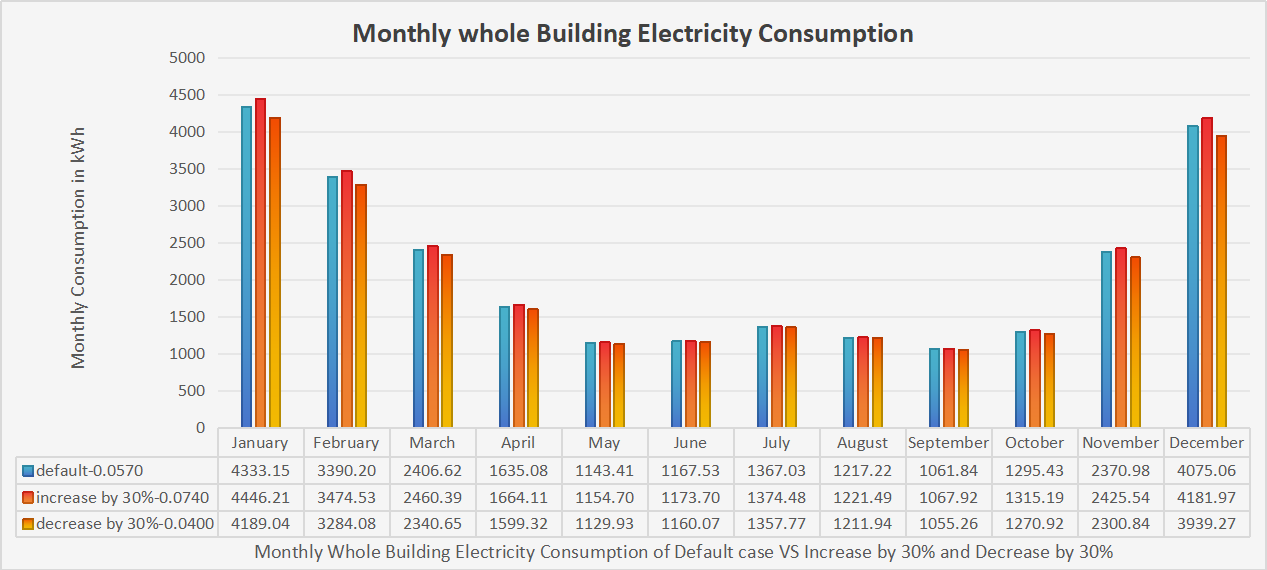
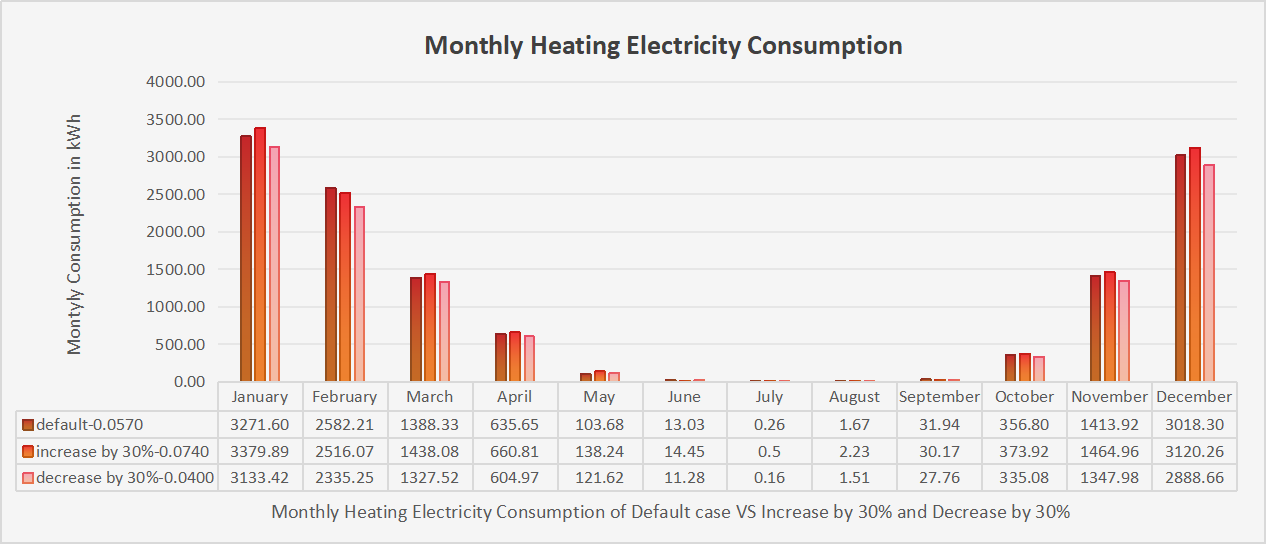
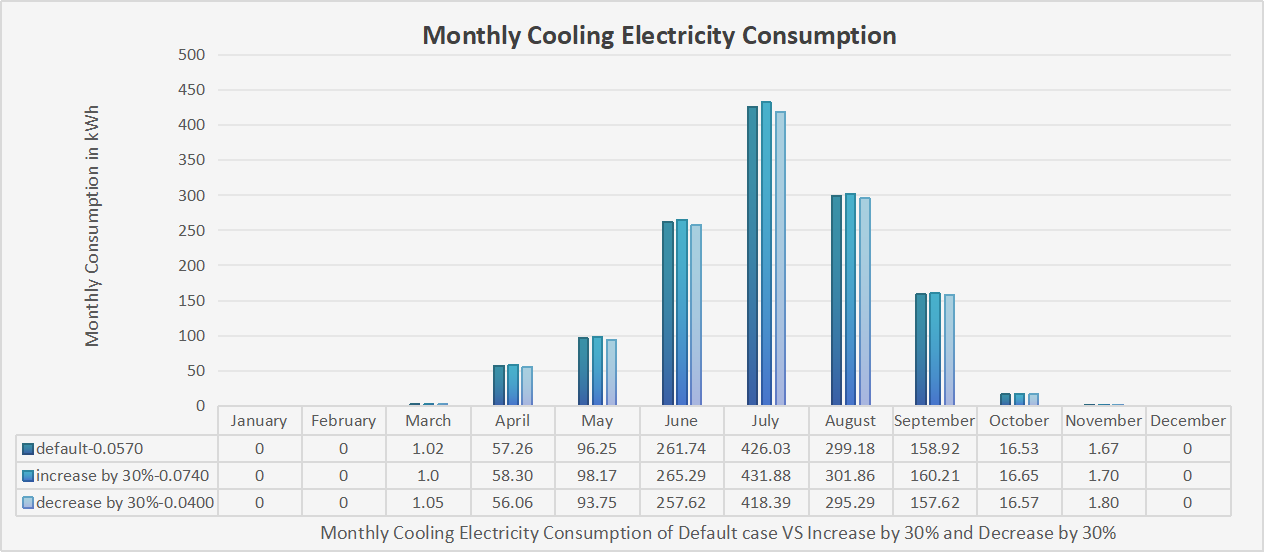
From the building prototype, the default thermal conductivity of the wall console layer is 0.0570 W·m-1·k-1. By increasing and decreasing the thermal conductivity by 30%, the other two comparison cases have a thermal conductivity of 0.0740 W·m-1·k-1 (increase case) and 0.0400 W·m-1·k-1 (decrease case). Figure 6, Figure 7, and Figure 8 show the energy consumption comparison of the three cases: monthly whole building electricity consumption, monthly heating electricity consumption, and monthly cooling electricity consumption.
As Figure 6 shows, the increase case has an increased energy consumption each month while the decrease case has a decreased energy consumption each month, which makes sense since a larger thermal conductivity leads to a larger heat transfer rate and faster energy loss from the building to the outside, and hence requiring more electricity supply to maintain the desired temperature setpoint. Similar trends can be observed from Figure 7 and Figure 8. This phenomenon is especially evident during the winter months, specifically November, December, January, and February. Comparing with the default case, the increase case has increased annual power consumption by 2.00% while the decrease case has decreased by 2.45%. The most significant variation in energy use after optimization occurred in January, with a decrease of 144.11 kW·h, which almost equals to the cooling energy consumption for September. Among the twelve months, January has the most noticeable variation in both increase case and decrease case, with increased energy consumption by 2.61% and decreased by 3.33%, respectively. Similarly, the most noticeable variation for heating happens in January, where the increased energy consumption is by 3.31%, while the decreased energy consumption is by 4.22%. However, the most noticeable variation for cooling happens in July, where the increased energy consumption is by 1.37%, while the decreased energy consumption is by 1.80%.
3.3.1.2. Sheathing layer
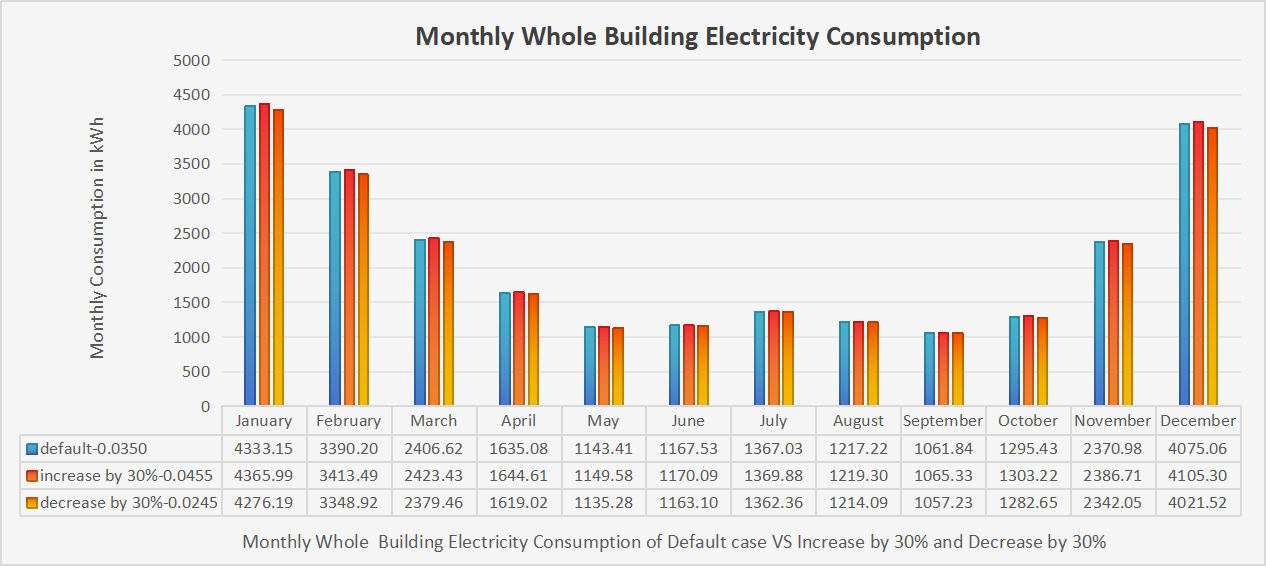
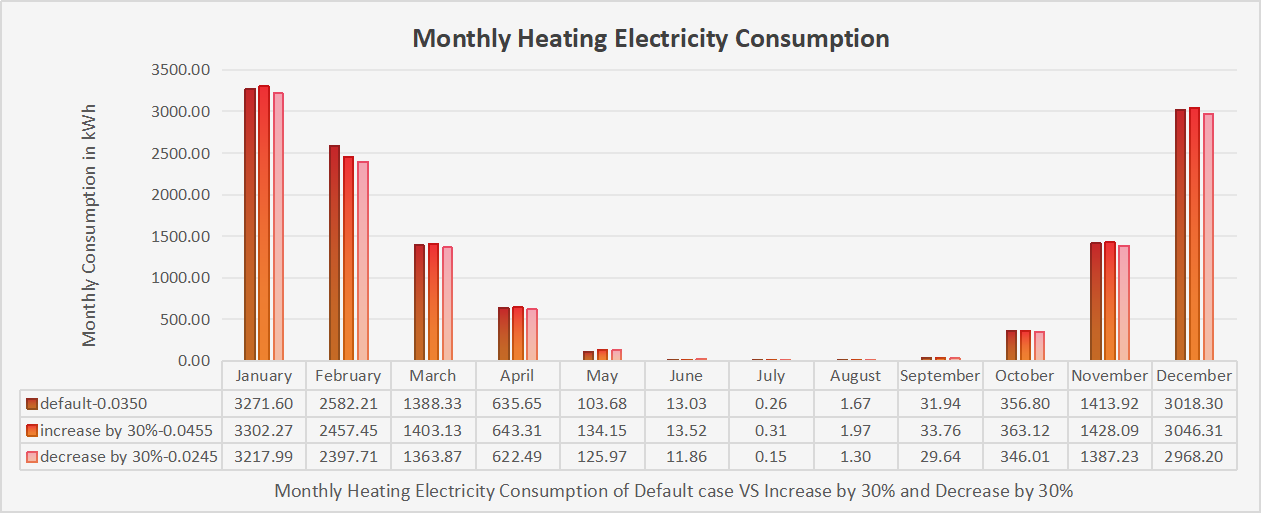
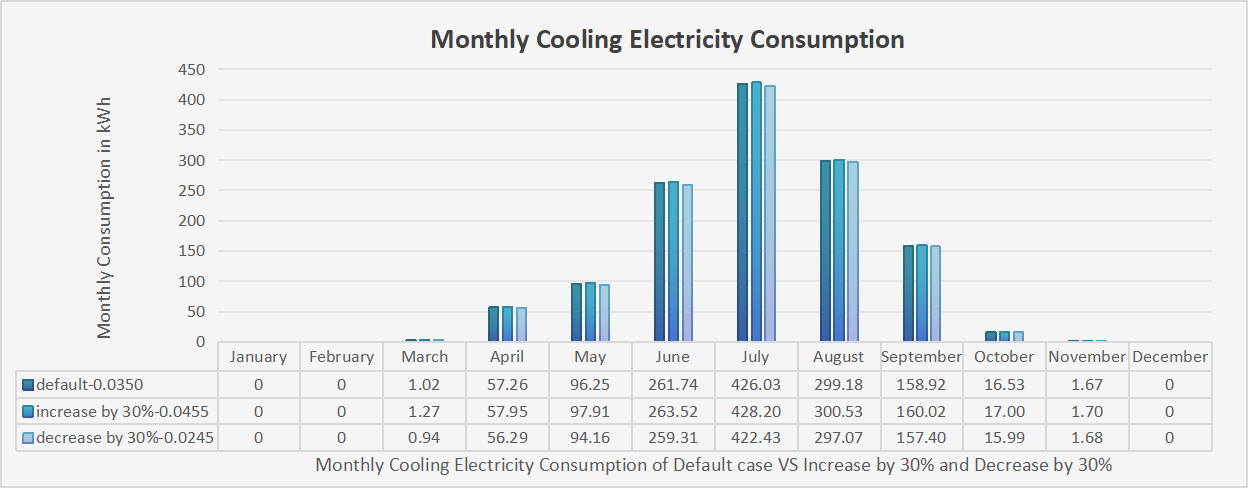
As Table 2 shows, the sheathing layer has the smallest thermal conductivity, which represents the best insulation performance. The default thermal conductivity of the sheathing layer is 0.0350 W·m-1·k-1. By increasing and decreasing the thermal conductivity by 30%, the other two comparison cases have a thermal conductivity of 0.0455 W·m-1·k-1 (increase case) and 0.0245 W·m-1·k-1 (decrease case). Figure 9, Figure 10, and Figure 11 show the energy consumption comparison of the three cases: monthly whole building electricity consumption, monthly heating electricity consumption, and monthly cooling electricity consumption.
As Figure 9, Figure 10, and Figure 11 show, the increase case has an increased energy consumption each month while the decrease case has a decreased energy consumption each month. Comparing with the default case, the increase case has increased annual power consumption by 0.60% while the decrease case has decreased by 1.03%. The most noticeable variation in overall building power consumption caused by increasing and decreasing thermal conductivity occurs in January, with increased energy consumption by 0.76% and decreased by 1.31%, respectively. Similarly, the most noticeable variation for heating happens in January, where the increased energy consumption is by 0.93%, while the decreased energy consumption is by 1.67%. However, the most noticeable variation for cooling happens in July, where the increased energy consumption is by 0.51%, while the decreased energy consumption is by 0.85%.
The findings indicate that a 30% increase or decrease in thermal conductivity of sheathing layer, relative to the unmodified default case, yields negligible variation in energy use. There is no substantial effect on energy use for cooling and heating, suggesting that optimizing the thermal conductivity of sheathing has little significant impact on reducing the overall energy consumption of the building.
3.3.2. Thickness
According to Fourier's Law of Heat Conduction, heat conduction is not only related to the thermal conductivity of the material itself. By changing the thickness of the material, its insulation performance can also be impacted, thereby reducing energy consumption.
3.3.2.1. Wall console layer
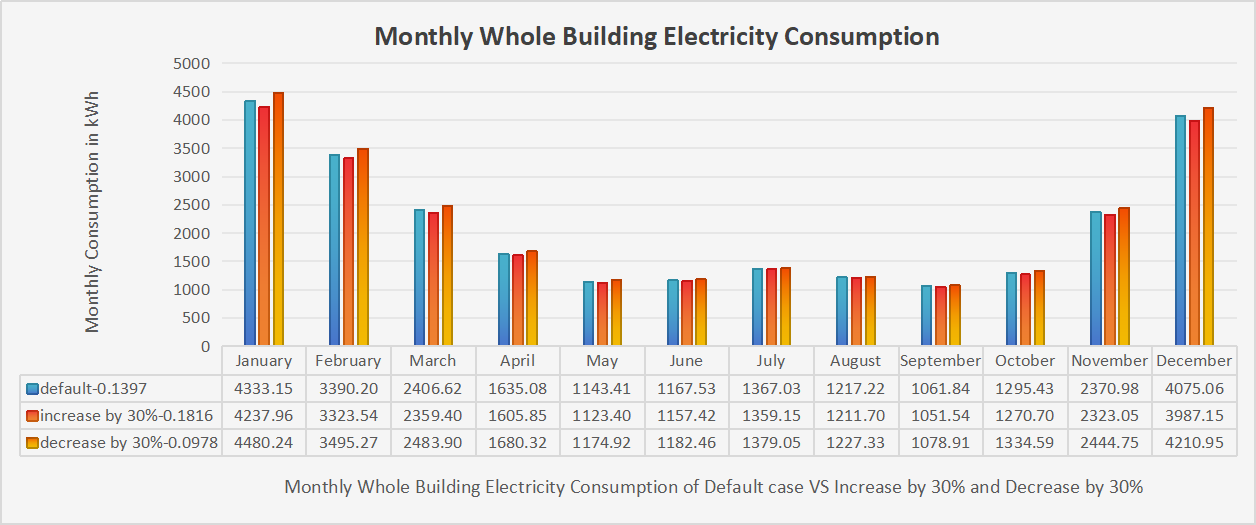
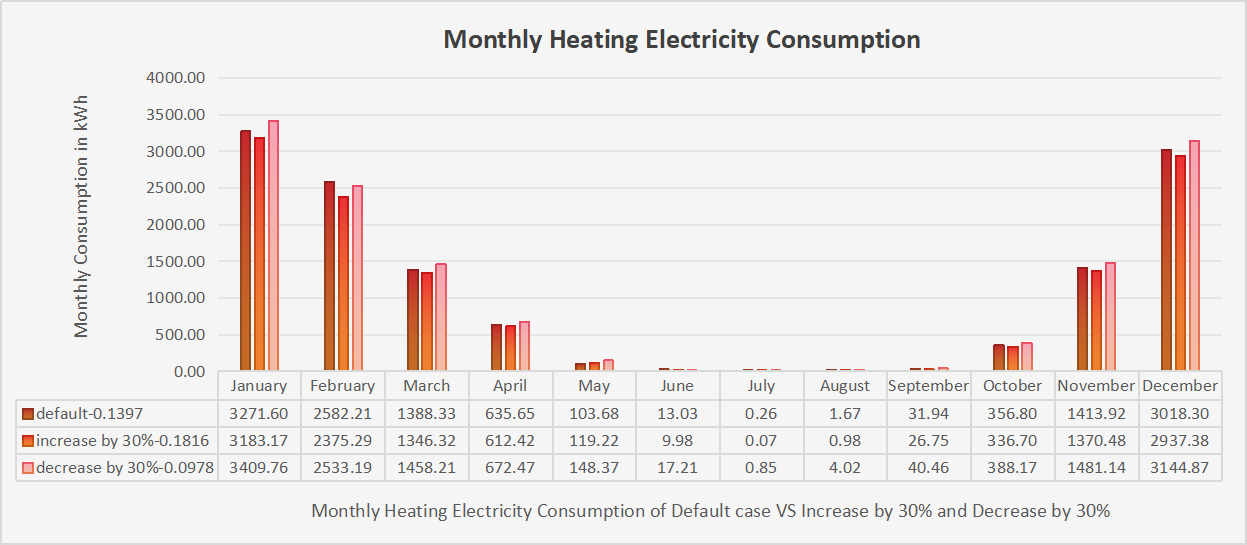
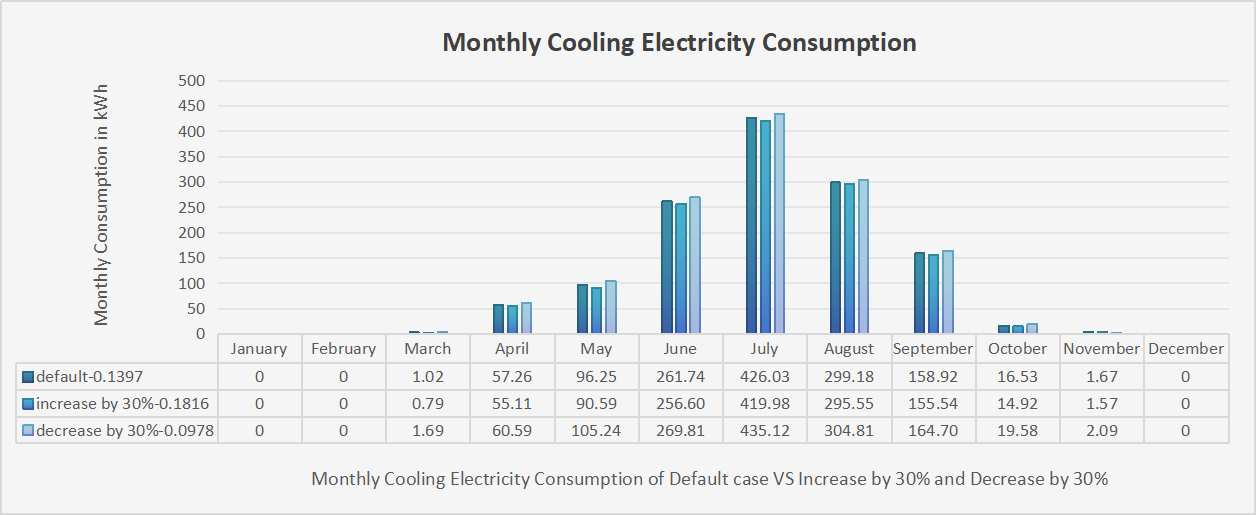
As Table 2 shows, the wall console layer has the largest wall thickness of 0.1397 m. By increasing and decreasing the thickness by 30%, the other two comparison cases have a thickness of 0.1816 m (increase case) and 0.0978 m (decrease case). Figure 12, Figure 13, and Figure 14 show the energy consumption comparison of the three cases: monthly whole building electricity consumption, monthly heating electricity consumption, and monthly cooling electricity consumption.
As Figure 12, Figure 13, and Figure 14 show, the increase case has a decreased energy consumption each month while the decrease case has an increased energy consumption each month. Comparing with the default case, the increase case has decreased annual power consumption by 1.78% while the decrease case has increased by 2.78%. The most significant variation in energy use after optimization occurred in January, with decreased energy consumption by 2.20% (increase case) and increased by 3.39% (decrease case), respectively. Similarly, the most noticeable variation for heating happens in January, where the decreased energy consumption is by 2.70% (increase case), while the increased energy consumption is by 4.22% (decrease case). However, the most noticeable variation for cooling happens in July, where the decreased energy consumption is by 1.42% (increase case), while the increased energy consumption is by 2.13% (decrease case).
Therefore, optimizing the thickness of the thickest wall console can help optimize the energy consumption. The total annual energy usage of the entire building is decreased by 1162.83 kW·h through increasing the thickness of the wall console layer by 30%. The energy savings are sufficient to cover the full building's electrical energy usage in June. As Figure 13 and Figure 14 show, increasing the thickness of the wall has a significant effect on optimizing the energy consumption for both cooling and heating. Increasing the thickness of the wall will reduce the energy consumption, and reducing the thickness of the wall will increase the energy consumption, which makes sense because increasing the thickness of the wall will enhance its thermal insulation performance, the loss of heat will be reduced, and therefore it will require less power supply than the original situation.
3.3.2.2. Sheathing layer
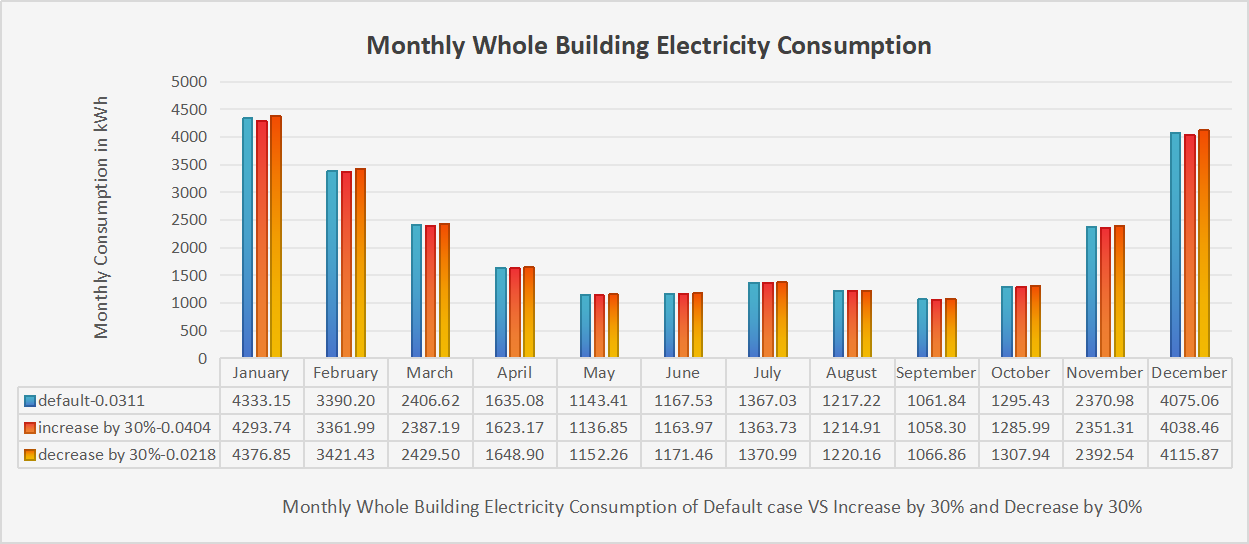
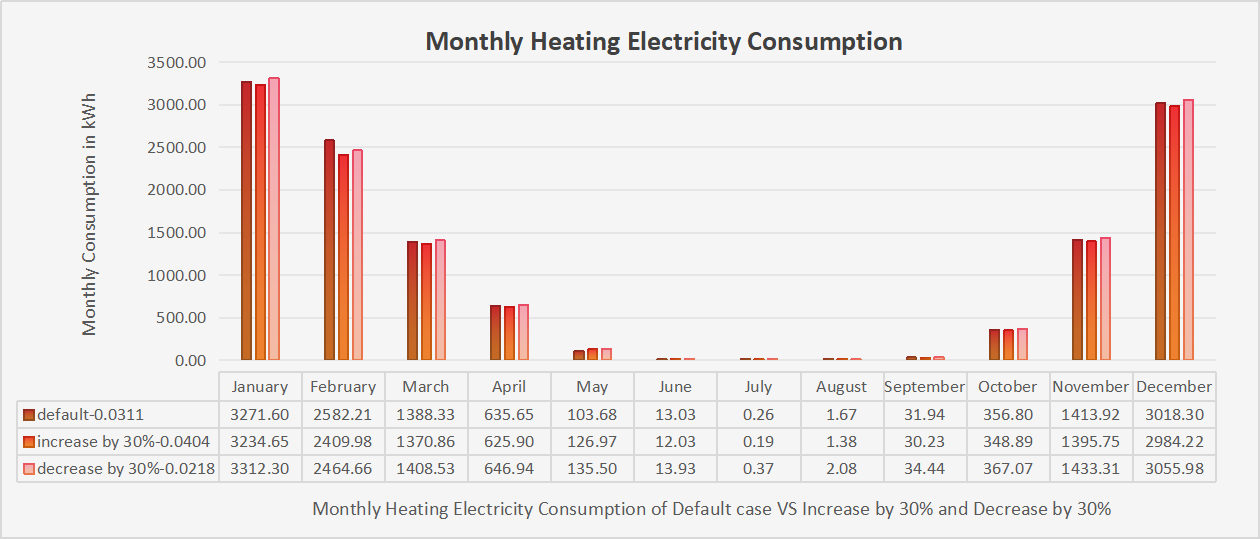
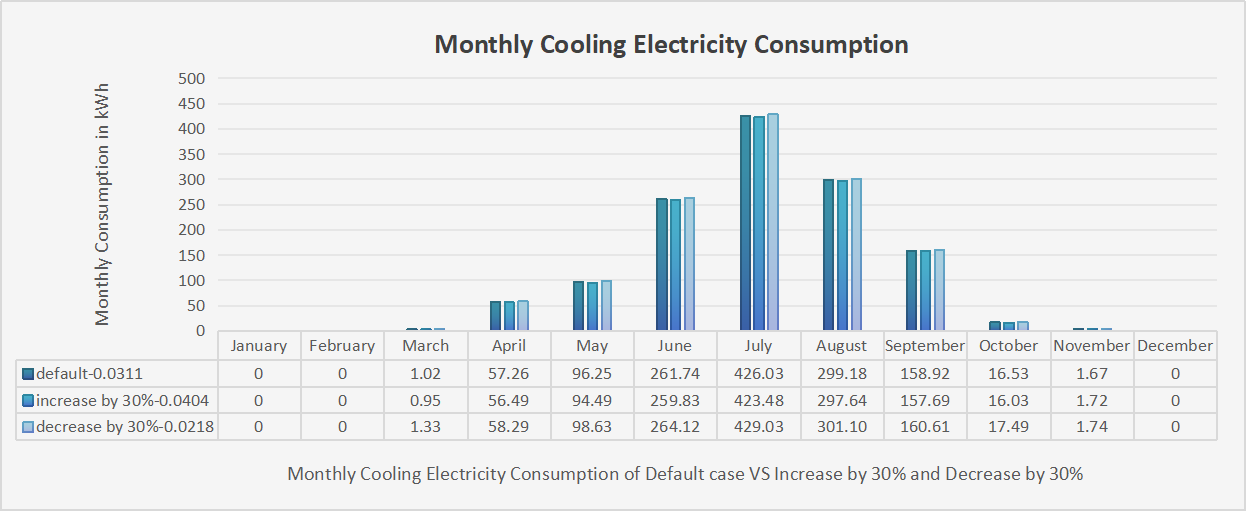
From the building prototype, the default thickness of the sheathing layer is 0.0311 m. By increasing and decreasing the thickness by 30%, the other two comparison cases have a thickness of 0.0404 m (increase case) and 0.0218 m (decrease case). Figure 15, Figure 16, and Figure 17 show the energy consumption comparison of the three cases: monthly whole building electricity consumption, monthly heating electricity consumption, and monthly cooling electricity consumption.
As Figure 15, Figure 16, and Figure 17 show, the increase case has a decreased energy consumption each month while the decrease case has an increased energy consumption each month. Comparing with the default case, the increase case has decreased annual power consumption by 0.72% while the decrease case has increased by 0.83%. The most significant variation in energy use after optimization occurred in January, with decreased energy consumption by 0.91% (increase case) and increased by 1.00% (decrease case), respectively. Similarly, the most noticeable variation for heating happens in January, where the decreased energy consumption is by 1.13% (increase case), while the increased energy consumption is by 1.24% (decrease case). However, the most noticeable variation for cooling happens in July, where the decreased energy consumption is by 0.60% (increase case), while the increased energy consumption is by 0.70% (decrease case).
The simulation of the effects of alterations in sheathing thickness on energy consumption revealed no significant difference pre- and post-change. The statistics chart exhibited minimal variation, reflecting an influence of under 3 kW·h on monthly cooling energy usage. Consequently, altering the sheathing thickness does not substantially influence the optimization of overall building energy usage.
In this case study, two construction layers, wall console layer and sheathing layer, are investigated, where both thermal conductivity and thickness are used as design parameters to conduct building energy simulations. As the simulation result shows, for both thermal conductivity and thickness properties, wall console layer has turned out to have bigger impact on energy consumption than sheathing. In passive design, this indicates that different construction layers have different levels of energy impact, and it is crucial for architects to identify the most impactful layer for optimization to achieve impactful results during the building design stage.
Active design can be applied in modern architecture, such as setting different indoor temperatures for distinct periods based on various conditions, intelligently managing the utilization of energy, improving energy management efficiency, and reducing energy consumption. The energy savings achieved through temperature control strategies can amount to approximately $600 to $700 per year, while the cost of installing a smart control system ranges from $200 to $300. With a long service life after installation, the return on investment is high. Passive design strategies can provide evaluation information for buildings before renovation according to building codes and policies, effectively reducing energy consumption. Passive designs require low maintenance expenses, have a long service life, and offer high-quality returns, making them suitable for renovation and optimization work in some projects. The investment payback period for both designs is very short, with strong practicality and feasibility, making them suitable for widespread promotion and application.
Green buildings are garnering more and more attention, and various policies are continuously being introduced to encourage projects to actively develop and practice green building. However, the applicability of these policies varies under different circumstances. This study provides data references for the feasibility of policies in projects, offers a basis for designers, and sets expectations for energy-saving effects. This research method also provides a simple and convenient technical reference for the validation of effectiveness in the future formulation of green building policies.
4. Conclusion
EnergyPlus was chosen for the building energy simulation due to its various benefits, including relatively higher simulation accuracy and user-friendliness. This research used the integrated design combining building model and energy simulation and conducted a comprehensive analysis of the energy consumption optimization effects of the whole building from both active and passive design perspectives. The active design made a more reasonable temperature setpoint based on occupant activity factors. The passive design underwent multi-factor design optimization from different performance and layer perspectives, and the effectiveness of the optimization design has been verified through comparisons from both positive and negative aspects.
• Based on the simulation results, optimizing the temperature setpoint schedule based on occupants’ activities can significantly decrease unnecessary energy consumption of heating and cooling. The electricity saved by optimizing temperature settings can even cover the electricity needs for the months of May, June, and July. This approach is particularly suitable for modern residential buildings. In the future, advanced smart control systems can be installed in new residential buildings to adjust temperature settings. This would minimize excessive energy consumption, lower electricity expenses for summer cooling and winter heating, facilitate unified management, improve energy efficiency, and align with the goals of creating environmentally friendly, low-carbon, green, and sustainable buildings.
• According to modern energy policies, the issue society faces is that a large number of old residential buildings need to be upgraded and renovated to meet the new standards of energy policies, so finding the best renovation plan for existing buildings is crucial. However, the investment cost of installing smart control systems is high, and the renovation construction is difficult, making it unsuitable for retrofitting old residential buildings. Although the effect of changing the envelope structure is not as obvious as the active design, optimizing the exterior wall is highly feasible and cost-effective, making this approach convenient for practical application. Optimizing different layers and different performances will produce different effects. This research did not focus on specific materials but optimized wall layers with different functions so that the research results can be widely adopted in practical applications. The results showed that optimizing the wall console layer, which has higher impact factors, can produce more effective results. The findings also showed that when optimizing different performance aspects, such as thickness and thermal conductivity, the differences in effectiveness are not significant. Therefore, one can refer to actual conditions and construction circumstances in the real project to select convenient and appropriate optimization focuses.
• Many people believe that green buildings require high technology and investment, so they are unwilling to develop or purchase green buildings, which hinders the development of green buildings. Therefore, it is essential to study comprehensive optimization and construction plans. The optimization design strategies proposed in this research can provide systematic and comprehensive decision support for designers or other stakeholders, reducing resource consumption during the building renovation process and ensuring that the building meets energy policy standards. These simulation results can help in selecting the best optimization plan in the future based on investment costs, construction difficulty, and optimization effects, providing guidance for better energy management during the development of green buildings. This has significant theoretical value and practical significance for the sustainable development of green buildings.
• The increase in building energy consumption has made energy efficiency strategies a key focus of energy policy, leading to the establishment of new building regulations and certification programs. Mastering comprehensive information on building energy consumption is crucial for conducting appropriate analyses and effectively planning future energy policies. The data and methods provided by this research can serve as a reference for the applicability and effectiveness of policies, which is meaningful for future policies and the sustainable development of green buildings.
Chicago has distinct seasons, and low-rise buildings account for a large proportion of residential buildings. Choosing Chicago and low-rise buildings for simulation lays the foundation for future validation in a broader range of climatic regions and building types. The paper only researched one type of building, the climate zone is relatively single, and the simulated occupancy data may not represent a wide range of residents. In the future, further research is needed to analyze other building types and climate zones to broaden the applicability of these findings.
Funding sources
This research did not receive any specific grant from funding agencies in the public, commercial, or not-for-profit sectors.
References
[1]. Shapi, M. K. M., Ramli, N. A., & Awalin, L. J. (2021). Energy consumption prediction by using machine learning for smart building: Case study in Malaysia.Developments in the Built Environment, 5, 100037.
[2]. Bae, Y., Kim, D., & Horton, W. T. (2023). Development of Building Design Optimization Methodology: Residential Building Applications.Buildings, 14(1), 107.
[3]. Mariano-Hernández, D., Hernández-Callejo, L., Zorita-Lamadrid, A., Duque-Pérez, O., & García, F. S. (2021). A review of strategies for building energy management system: Model predictive control, demand side management, optimization, and fault detect & diagnosis.Journal of Building Engineering, 33, 101692.
[4]. Mutschler, R., Rüdisüli, M., Heer, P., & Eggimann, S. (2021). Benchmarking cooling and heating energy demands considering climate change, population growth and cooling device uptake.Applied Energy, 288, 116636.
[5]. Agarwal, R., Garg, M., Tejaswini, D., Garg, V., Srivastava, P., Mathur, J., & Gupta, R. (2023). A review of residential energy feedback studies.Energy and buildings, 290, 113071.
[6]. Bataineh, K., & Alrabee, A. (2018). Improving the energy efficiency of the residential buildings in Jordan.Buildings, 8(7), 85.
[7]. Rezaei, F., Bulle, C., & Lesage, P. (2019). Integrating building information modeling and life cycle assessment in the early and detailed building design stages.Building and Environment, 153, 158-167.
[8]. Sanguinetti, P., Abdelmohsen, S., Lee, J., Lee, J., Sheward, H., & Eastman, C. (2012). General system architecture for BIM: An integrated approach for design and analysis.Advanced Engineering Informatics, 26(2), 317-333.
[9]. Bonomolo, M., Di Lisi, S., & Leone, G. (2021). Building information modelling and energy simulation for architecture design.Applied Sciences, 11(5), 2252.
[10]. Negendahl, K. (2015). Building performance simulation in the early design stage: An introduction to integrated dynamic models.Automation in construction, 54, 39-53.
[11]. Yu, N., & Paolucci, S. (2017). Model-based design optimization and predictive control to minimize energy consumption of a building. In Proceedings of CHT-17 ICHMT international symposium on advances in computational heat transfer.Begel House Inc..
[12]. Use of energy explained, 2023. Retrieved on July 25, from https: //www.eia.gov/energyexplained/use-of-energy/homes.php
[13]. Chicago Illinois home energy statistics, 2024. Retrieved on July 25, from https: //alsairandheating.com/chicago-illinois-home-energy-statistics/#: ~: text=This%20amount%20leads%20to%20an, 893%20kWh%20per%20residential%20unit.
[14]. EnerguPlus, 2024. Retrieved on July 25, from https: //energyplus.net/
[15]. DOE-2, 2024. Retrieved on July 26, from https: //doe2.com/DOE2/
[16]. Zhu, D., Hong, T., Yan, D., & Wang, C. (2013, September). A detailed loads comparison of three building energy modeling programs: EnergyPlus, DeST and DOE-2.1 E.In Building Simulation(Vol. 6, No. 3, pp. 323-335). Berlin/Heidelberg: Springer Berlin Heidelberg.
[17]. TRNSYS, 2019. Retrieved on July 26, from https: //www.trnsys.com/
[18]. ESP-r, 2018. Retrieved on July 26, from https: //www.esru.strath.ac.uk/Courseware/ESP-r/tour/
[19]. ESP-r, 2024. Retrieved on July 26, from https: //www.strath.ac.uk/research/energysystemsresearchunit/applications/esp-r/
[20]. Loutzenhiser, P. G., Manz, H., Felsmann, C., Strachan, P. A., & Maxwell, G. M. (2007). An empirical validation of modeling solar gain through a glazing unit with external and internal shading screens.Applied Thermal Engineering, 27(2-3), 528-538.
[21]. Fumo, N., Mago, P., & Luck, R. (2010). Methodology to estimate building energy consumption using EnergyPlus Benchmark Models.Energy and Buildings, 42(12), 2331-2337.
[22]. Fumo, N., Mago, P. J., & Chamra, L. M. (2009). Energy and economic evaluation of cooling, heating, and power systems based on primary energy.Applied Thermal Engineering, 29(13), 2665-2671.
[23]. Tahmasebinia, F., Jiang, R., Sepasgozar, S., Wei, J., Ding, Y., & Ma, H. (2022). Using regression model to develop green building energy simulation by BIM tools.Sustainability, 14(10), 6262.
[24]. Elnabawi, M. H. (2020). Building information modeling-based building energy modeling: investigation of interoperability and simulation results.Frontiers in Built Environment, 6, 573971.
[25]. Pan, Y., Zhu, M., Lv, Y., Yang, Y., Liang, Y., Yin, R., ... & Yuan, X. (2023). Building energy simulation and its application for building performance optimization: A review of methods, tools, and case studies.Advances in Applied Energy, 10, 100135.
[26]. Residential building prototype, 2024. Retrieved on December 28, from https: //www.energycodes.gov/sites/default/files/2021-05/resstd_CZ5A_IECC_2021.zip
Cite this article
Li,Q. (2025). Residential building energy optimization using EnergyPlus. Advances in Engineering Innovation,16(10),65-78.
Data availability
The datasets used and/or analyzed during the current study will be available from the authors upon reasonable request.
Disclaimer/Publisher's Note
The statements, opinions and data contained in all publications are solely those of the individual author(s) and contributor(s) and not of EWA Publishing and/or the editor(s). EWA Publishing and/or the editor(s) disclaim responsibility for any injury to people or property resulting from any ideas, methods, instructions or products referred to in the content.
About volume
Journal:Advances in Engineering Innovation
© 2024 by the author(s). Licensee EWA Publishing, Oxford, UK. This article is an open access article distributed under the terms and
conditions of the Creative Commons Attribution (CC BY) license. Authors who
publish this series agree to the following terms:
1. Authors retain copyright and grant the series right of first publication with the work simultaneously licensed under a Creative Commons
Attribution License that allows others to share the work with an acknowledgment of the work's authorship and initial publication in this
series.
2. Authors are able to enter into separate, additional contractual arrangements for the non-exclusive distribution of the series's published
version of the work (e.g., post it to an institutional repository or publish it in a book), with an acknowledgment of its initial
publication in this series.
3. Authors are permitted and encouraged to post their work online (e.g., in institutional repositories or on their website) prior to and
during the submission process, as it can lead to productive exchanges, as well as earlier and greater citation of published work (See
Open access policy for details).
References
[1]. Shapi, M. K. M., Ramli, N. A., & Awalin, L. J. (2021). Energy consumption prediction by using machine learning for smart building: Case study in Malaysia.Developments in the Built Environment, 5, 100037.
[2]. Bae, Y., Kim, D., & Horton, W. T. (2023). Development of Building Design Optimization Methodology: Residential Building Applications.Buildings, 14(1), 107.
[3]. Mariano-Hernández, D., Hernández-Callejo, L., Zorita-Lamadrid, A., Duque-Pérez, O., & García, F. S. (2021). A review of strategies for building energy management system: Model predictive control, demand side management, optimization, and fault detect & diagnosis.Journal of Building Engineering, 33, 101692.
[4]. Mutschler, R., Rüdisüli, M., Heer, P., & Eggimann, S. (2021). Benchmarking cooling and heating energy demands considering climate change, population growth and cooling device uptake.Applied Energy, 288, 116636.
[5]. Agarwal, R., Garg, M., Tejaswini, D., Garg, V., Srivastava, P., Mathur, J., & Gupta, R. (2023). A review of residential energy feedback studies.Energy and buildings, 290, 113071.
[6]. Bataineh, K., & Alrabee, A. (2018). Improving the energy efficiency of the residential buildings in Jordan.Buildings, 8(7), 85.
[7]. Rezaei, F., Bulle, C., & Lesage, P. (2019). Integrating building information modeling and life cycle assessment in the early and detailed building design stages.Building and Environment, 153, 158-167.
[8]. Sanguinetti, P., Abdelmohsen, S., Lee, J., Lee, J., Sheward, H., & Eastman, C. (2012). General system architecture for BIM: An integrated approach for design and analysis.Advanced Engineering Informatics, 26(2), 317-333.
[9]. Bonomolo, M., Di Lisi, S., & Leone, G. (2021). Building information modelling and energy simulation for architecture design.Applied Sciences, 11(5), 2252.
[10]. Negendahl, K. (2015). Building performance simulation in the early design stage: An introduction to integrated dynamic models.Automation in construction, 54, 39-53.
[11]. Yu, N., & Paolucci, S. (2017). Model-based design optimization and predictive control to minimize energy consumption of a building. In Proceedings of CHT-17 ICHMT international symposium on advances in computational heat transfer.Begel House Inc..
[12]. Use of energy explained, 2023. Retrieved on July 25, from https: //www.eia.gov/energyexplained/use-of-energy/homes.php
[13]. Chicago Illinois home energy statistics, 2024. Retrieved on July 25, from https: //alsairandheating.com/chicago-illinois-home-energy-statistics/#: ~: text=This%20amount%20leads%20to%20an, 893%20kWh%20per%20residential%20unit.
[14]. EnerguPlus, 2024. Retrieved on July 25, from https: //energyplus.net/
[15]. DOE-2, 2024. Retrieved on July 26, from https: //doe2.com/DOE2/
[16]. Zhu, D., Hong, T., Yan, D., & Wang, C. (2013, September). A detailed loads comparison of three building energy modeling programs: EnergyPlus, DeST and DOE-2.1 E.In Building Simulation(Vol. 6, No. 3, pp. 323-335). Berlin/Heidelberg: Springer Berlin Heidelberg.
[17]. TRNSYS, 2019. Retrieved on July 26, from https: //www.trnsys.com/
[18]. ESP-r, 2018. Retrieved on July 26, from https: //www.esru.strath.ac.uk/Courseware/ESP-r/tour/
[19]. ESP-r, 2024. Retrieved on July 26, from https: //www.strath.ac.uk/research/energysystemsresearchunit/applications/esp-r/
[20]. Loutzenhiser, P. G., Manz, H., Felsmann, C., Strachan, P. A., & Maxwell, G. M. (2007). An empirical validation of modeling solar gain through a glazing unit with external and internal shading screens.Applied Thermal Engineering, 27(2-3), 528-538.
[21]. Fumo, N., Mago, P., & Luck, R. (2010). Methodology to estimate building energy consumption using EnergyPlus Benchmark Models.Energy and Buildings, 42(12), 2331-2337.
[22]. Fumo, N., Mago, P. J., & Chamra, L. M. (2009). Energy and economic evaluation of cooling, heating, and power systems based on primary energy.Applied Thermal Engineering, 29(13), 2665-2671.
[23]. Tahmasebinia, F., Jiang, R., Sepasgozar, S., Wei, J., Ding, Y., & Ma, H. (2022). Using regression model to develop green building energy simulation by BIM tools.Sustainability, 14(10), 6262.
[24]. Elnabawi, M. H. (2020). Building information modeling-based building energy modeling: investigation of interoperability and simulation results.Frontiers in Built Environment, 6, 573971.
[25]. Pan, Y., Zhu, M., Lv, Y., Yang, Y., Liang, Y., Yin, R., ... & Yuan, X. (2023). Building energy simulation and its application for building performance optimization: A review of methods, tools, and case studies.Advances in Applied Energy, 10, 100135.
[26]. Residential building prototype, 2024. Retrieved on December 28, from https: //www.energycodes.gov/sites/default/files/2021-05/resstd_CZ5A_IECC_2021.zip