


1. Introduction
The generalization capability of machine learning models is pivotal to their practical application value. Classic models like logistic regression, support vector machines, random forest, XGBoost, and LightGBM perform well in a range of domains because of their distinctive characteristics. The efficacy of logistic regression in risk assessment for structured data is demonstrated by Zhang et al.'s prediction of landslides in the upper Yellow River watershed [1]. Support vector machines are frequently quite effective at handling high-dimensional, small-sample datasets. For instance, Nong et al. employed this model to get precise predictions and maximize the activity of formulae used in traditional Chinese medicine [2]. By combining many decision trees, random forest lower model volatility. This characteristic allowed Zhang et al. to considerably surpass conventional techniques in estimating the amount of selenium in maize cultivated on soils lacking in selenium [3]. Models of gradient boosting trees, such as XGBoost and LightGBM, are excellent at capturing intricate nonlinear interactions. Zhang et al. used the former to improve the forecast accuracy of microchannel heat transfer coefficients, while Zhang et al. used the latter to help them make extremely precise estimates of the total phosphorus concentrations in reservoirs [4, 5].
Strong generalization skills are not the same as superior performance of machine learning models in particular tasks. According to a study by Ruan et al., models that overfit training data may see significant performance drops when used on other datasets. In their investigation, the XGBoost model showed significant overfitting when it crashed to F1=0.552 on an independent validation set after achieving perfect classification on the training set (F1=1.0). On the other hand, for the identical job, the Random Forest and LightGBM models showed more reliable cross-dataset performance [6]. For machine learning model selection, it is crucial to systematically assess and compare the generalization capacities of several models when faced with unknown data.
This study uses a public clinical dataset on heart illness to examine model generalization in depth. Comparing the generalization powers of five fundamental models—logistic regression, support vector machine, Random Forest, XGBoost, and LightGBM—is the main goal. This study also explored the potential enhancement of generalization capabilities through hybrid models. Drawing inspiration from research approaches in hypertension prediction and ancient glass identification, three hybrid models were constructed: the GBDT + Random Forest hybrid model, the Random Forest + LightGBM hybrid model, and the Random Forest + LightGBM + SVM hybrid model [7, 8]. It offers a foundation for model selection in situations requiring high stability by verifying the generalization variations between different models.
2. Research methods
2.1. Method introduction
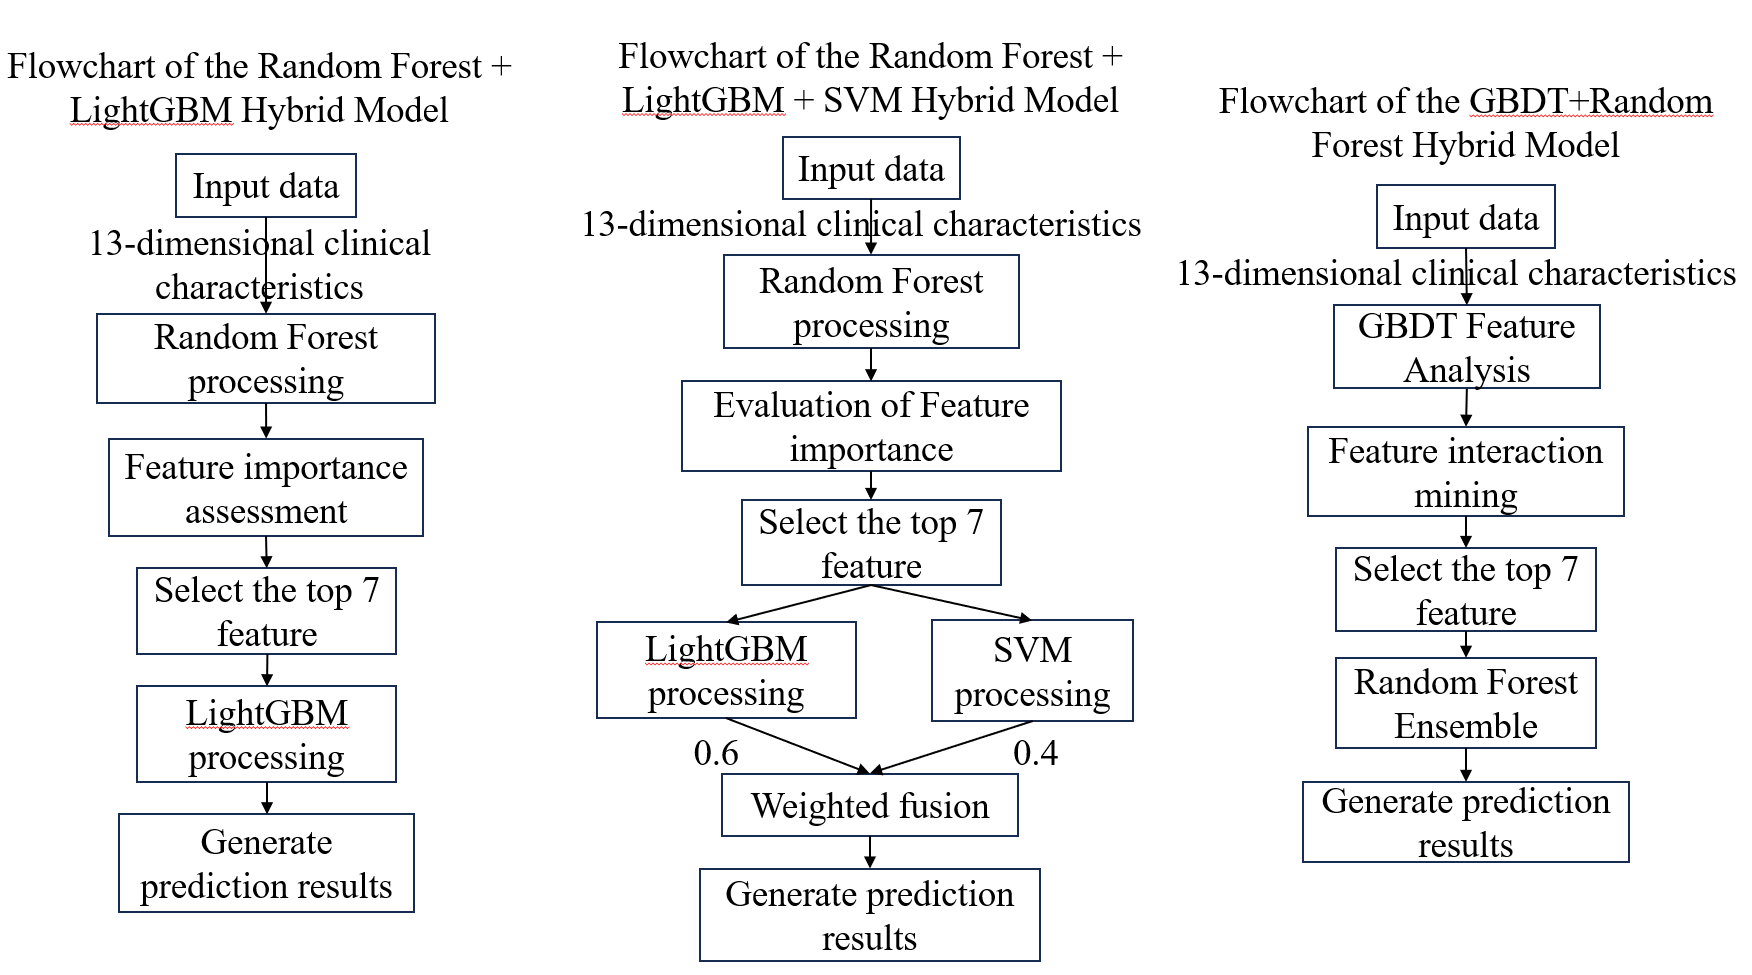
This work built three hybrid models and five single models to comprehensively verify the machine learning models' generalization skills on the dataset (as seen in Figure 1). The following are the setup specifics for each individual model:
There are 150 decision trees in the Random Forest model, with each tree having a maximum depth of seven layers. By reducing variance by random sampling of instances and characteristics, it further manages model complexity and avoids overfitting. Reproducible outcomes are guaranteed by a set random seed. To automatically identify important affecting elements, this model uses an integrated feature significance evaluation.
In order to avoid overly complicated trees, the LightGBM model uses regularization restrictions and limits the number of leaf nodes to 31 per tree. This setup greatly speeds up computation while preserving prediction accuracy while handling medium-sized medical datasets.
A dual randomization method is used in gradient-boosted trees in the XGBoost model to improve stability. It really trains with a maximum of four layers of tree depth and 85% of data and 85% of features. By using random sampling, generalization skills are enhanced and an excessive dependence on certain attributes is decreased.
The Support Vector Machine approach builds a nonlinear classification boundary by mapping data into high-dimensional space using a radial basis function kernel. A boundary adjustment parameter and a gamma parameter that automatically adjusts to the distribution of data while enabling probabilistic prediction are important parameters. Nonlinear correlations between characteristics are well captured by this modeling technique.
The logistic regression model serves as a fundamental linear classifier, employing L2 regularization to constrain weight distributions. The regularization strength is set to 0.5 to balance model complexity and fitting capability. An efficient solver ensures model convergence, with a maximum iteration limit of 2000. This minimalist architecture provides reliable performance for complex models and excels when features exhibit near-linear separability.
Three hybrid models were created for this study: Random Forest + LightGBM, Random Forest + LightGBM + SVM, and Random Forest + LightGBM, as seen in Figure 1. These models show the fundamental hybrid techniques from left to right. The following are the particular hybrid procedures for each model:
Phased processing is used by the Random Forest + LightGBM hybrid model. All features are used to train the Random Forest model in the first stage. It chooses the seven most significant indications for prediction outcomes out of the initial 13 by utilizing Random Forest's skill at spotting significant features. Only these seven features are used by the LightGBM model to construct its prediction model in the second stage. This approach makes use of LightGBM's effectiveness in processing simplified data as well as Random Forest's dependability in feature selection.
In the Random Forest + LightGBM + SVM hybrid model, the first step still starts with Random Forest selecting features to find seven important indications from the initial characteristics. The distinction is that both LightGBM and SVM models were used to train these particular characteristics at the same time. SVM is excellent at recognizing intricate classification boundaries, but LightGBM is excellent at managing feature interactions. In the last step, a voting method is utilized to combine the prediction outputs from both models, with SVM being weighted at 40% and LightGBM at 60%. This weighting lowers the chance of misdiagnosis by allowing for mutual compensation in confusing instances.
The first stage of the GBDT+Random Forest hybrid model uses GBDT to uncover feature interaction effects, selecting the five core indicators with the strongest generalization capabilities. In the second stage, Random Forest performs predictions on the selected core indicators.
2.2. Data sources and description
The Kaggle platform's publicly accessible cardiac clinical diagnostic dataset serves as the source of the study's main data. This dataset, which gathers real medical records from 1,025 people, offers a strong starting point for researching heart disease risk factors. The dataset painstakingly records a variety of patient data, such as: Demographics: sex (sex) and age (age) Physiological markers include maximal heart rate (thalach), fasting blood sugar (fbs), serum cholesterol content (chol), and resting blood pressure (trestbps). The outcomes of the clinical examination include coronary artery calcification (ca), exercise-induced angina (exang), thalassemia type (thal), resting ECG (restecg), chest pain type (cp), ST segment depression peak (oldpeak), and ST segment slope (slope). The diagnostic of heart disease (target), which indicates whether the patient was eventually given a heart disease diagnosis based on the findings of this thorough examination, is the main variable.
This study does not use variable selection and keeps all of its original features. To guarantee dependability, data has been standardized.
2.3. Indicator selection and explanation
The framework for selecting metrics is in line with the classifications needed for clinical cardiac diagnosis, and all indications are taken straight from the original medical records. Clinical relevance (making sure each metric is a physician-recognized diagnostic factor), data completeness (giving priority to metrics with fewer than 5% missing values), and collaborative diagnostic value (giving priority to metrics that cross-validate cardiac disease when combined with others) were the three guiding principles of selection.
The complete names and descriptions of the 13 clinical feature indicators and one target variable utilized in this study are provided in Table 1, which offers a strong starting point for investigating the generalization potential of the model.
|
Full Variable Name |
Variable Explanation |
|
age |
Patient age(years) |
|
sex |
Patient gender(0=female,1=male) |
|
cp |
Chest pain type(0=asymptomatic,1=typical angina,2=atypical angina,3=non-anginal chest pain) |
|
trestbps |
Resting blood pressure(mmHg,normal range 90-120) |
|
chol |
Serum cholesterol concentration(mg/dl,norma range <200) |
|
fbs |
Fasting blood glucose(0=normal,1=abnormal) |
|
restecg |
Resting ECG result(0=normal,1=ST-T wave abnormality,2=left ventricular hypertrophy) |
|
thalach |
Maximum heart rate(beats/minute) |
|
exang |
Exercise-induced angina(0=No,1=Yes) |
|
oldpeak |
Exercise-induced ST-segment depression relative to resting(mm) |
|
slope |
ST segment slope(0=ascending,1=flat,2=descending) |
|
ca |
Number of major vessels with fluorescence staining(0-3) |
|
thal |
Thalassemia type(0=normal,1=fixed defect,2=reversible defect) |
|
target |
Cardiac disease diagnosis result(0=no cardiac disease,1=cardiac disease present) |
3. Results and discussion
3.1. Random Forest model results
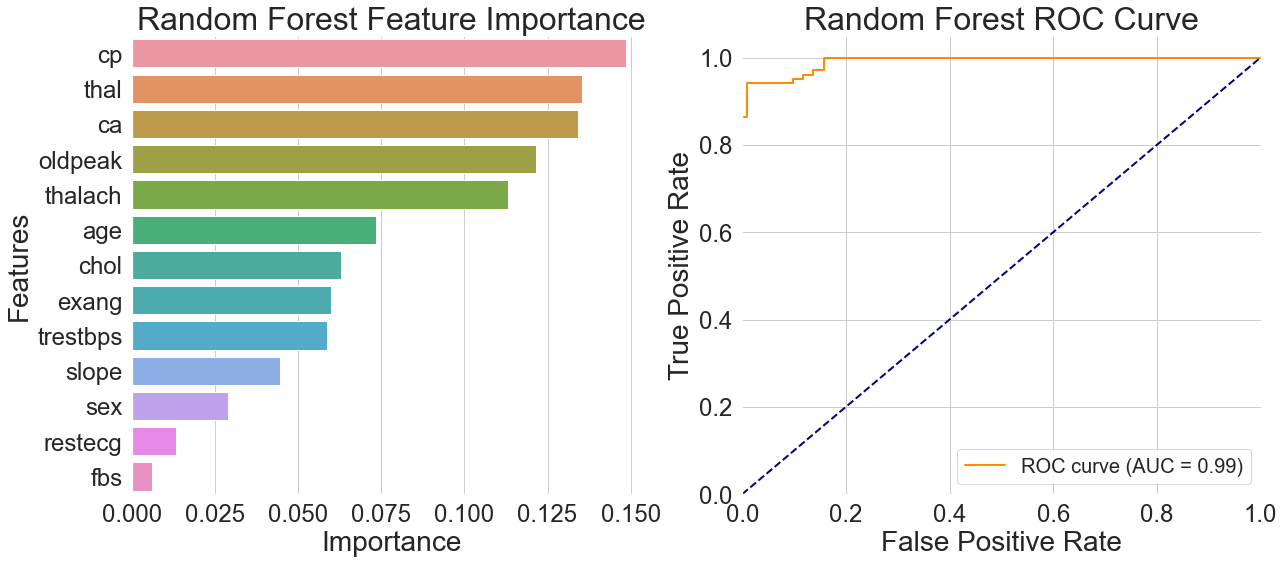
Observing the feature importance distribution on the left side of Figure 2, the importance of chest pain type significantly exceeds that of other features, aligning with physicians' diagnostic experience. Thalassemia and vascular count follow closely, while routine physical examination indicators like fasting blood glucose are ranked much lower by the model. This indicates that some critical medical data contribute very little to actual model predictions.
The ROC curve on the right side of Figure 2 shows the curve concentrated in the upper-left quadrant with an AUC value of 0.99. This suggests that the model has good generalization abilities in differentiating between people with heart disease and healthy people, especially when it comes to recognizing characteristic signs of heart disease. Even though the curve had a nearly perfect form, the model's accuracy in real testing was just 92.68%. The discrepancy between the accuracy and AUC value indicates that while the model fits well, it is unable to generalize sufficiently to samples that are near categorization borders or have less typical traits, which is a scenario that commonly arises in real-world applications.
3.2. LightGBM model results
Maximum heart rate was shown to be the most relevant characteristic, with a significantly higher importance than the others, according to the feature importance plot in Figure 3's left side. Type of chest pain came in eighth, while age and cholesterol came in second and third, respectively. The model's generalization advantage in capturing dynamic signals and nonlinear interactions is demonstrated by this feature weight distribution, which implies that the model prefers learning discriminative patterns from continuous physiological indications.
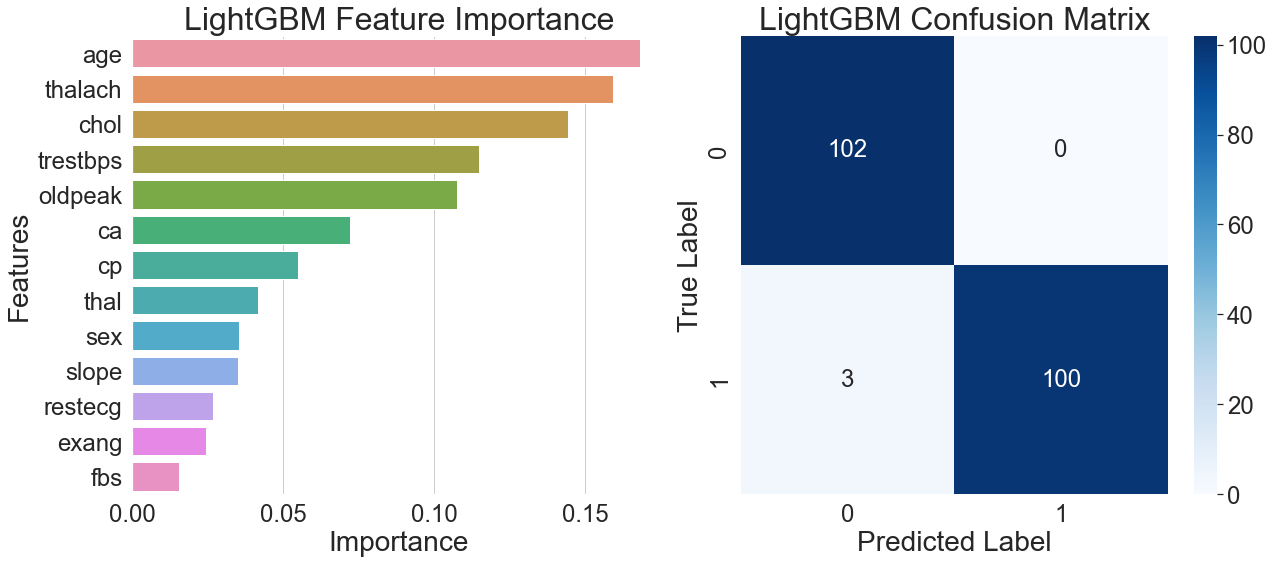
The model's performance in actual predictions is further demonstrated by the confusion matrix on the right side of Figure 3, which shows that all healthy samples were correctly identified, only three patient samples were misclassified, and the patient group achieved 100% recall. The analysis of correctly classified patient samples showed that the majority had a distinct high heart rate feature, while the remaining samples were accurately distinguished using multi-feature combinations of age, blood pressure, and cholesterol. The model demonstrates strong feature interaction recognition capabilities and generalization ability across diverse sample patterns.
3.3. XGBoost model results
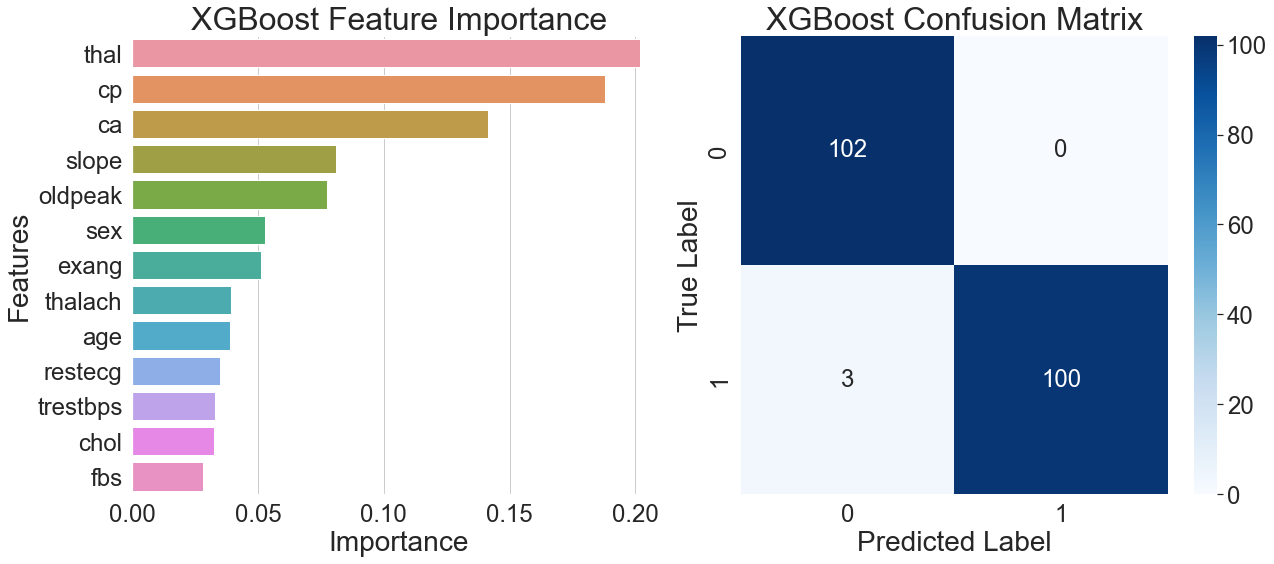
The feature importance plot on the left side of Figure 4 shows that thalassemia was the highest weighted feature in the XGBoost model, followed by resting ECG and fasting blood glucose. The importance of this feature highlights XGBoost's excellent generalization ability by showcasing how well it gathers discriminative data on blood indicators and long-term clinical characteristics.
The remarkable overall prediction accuracy of the model is illustrated by the confusion matrix on the right side of Figure 4. Only one of the 98 sick samples was incorrectly classified, and all 102 healthy samples were correctly identified. This misclassified case exhibited a rare combination of features, with multiple indicators at clinical threshold values, revealing the model's limitations in distinguishing extreme borderline cases.
Combining the results from both figures reveals that when the model simultaneously identifies moderate thalassemia and typical chest pain features, it tends to assign a positive diagnosis. This multi-feature-based decision mechanism exhibits significant generalization capabilities and lowers the risk of misclassification associated with relying on a single indicator.
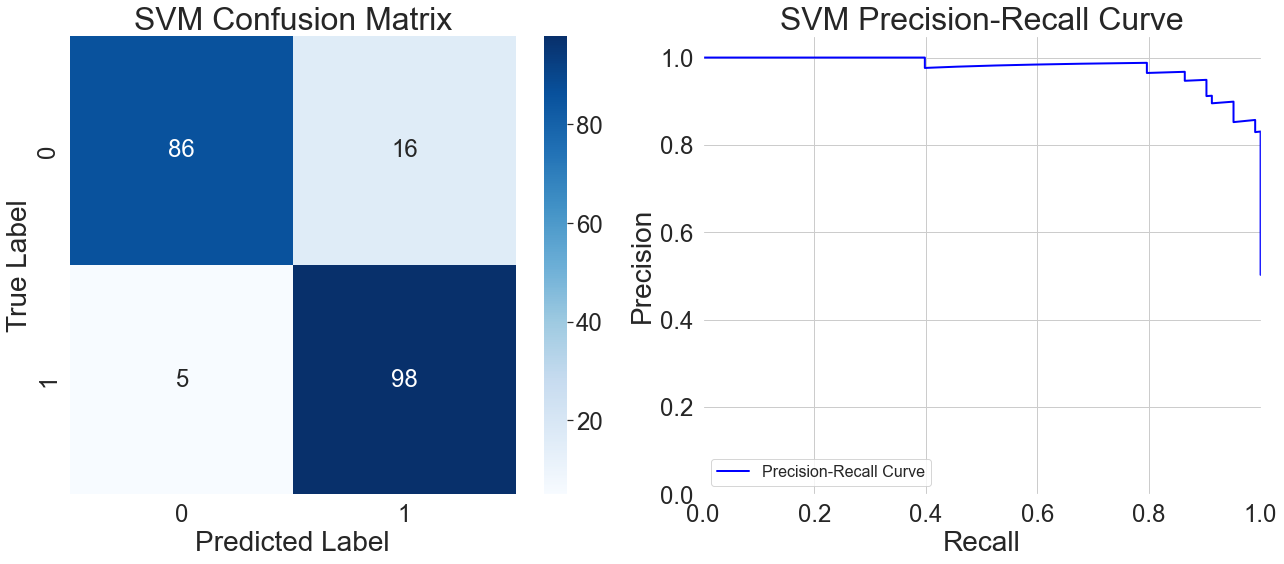
3.4. Support vector machine model results
The model does a good job of recognizing patient samples, properly classifying 95 out of 98 instances, according to the confusion matrix on the left side of Figure 5. With 16 out of 102 instances wrongly predicted as positive, it shows a greater probability of misclassification in healthy samples. Analysis of these misclassified samples reveals that when multiple feature values fall within clinically ambiguous ranges, the model tends to classify them as positive. This cautious approach reduces the number of missed diagnoses, but it makes it more difficult for the model to identify healthy samples. This reflects overly sensitive decision boundaries when handling samples with ambiguous features.
Furthermore, the model's precision starts to progressively deteriorate after recall hits 0.6, as shown by the precision-recall curve on the right side of Figure 5. This indicates that while the model attempts to detect more potential patients, the proportion of healthy samples misclassified as positive also increases. Particularly in the high-recall region at the curve's end, the model can detect patients with atypical symptoms, but the reliability of its classification results significantly diminishes. This reveals a trend of weakened generalization capability under extremely high recall requirements.
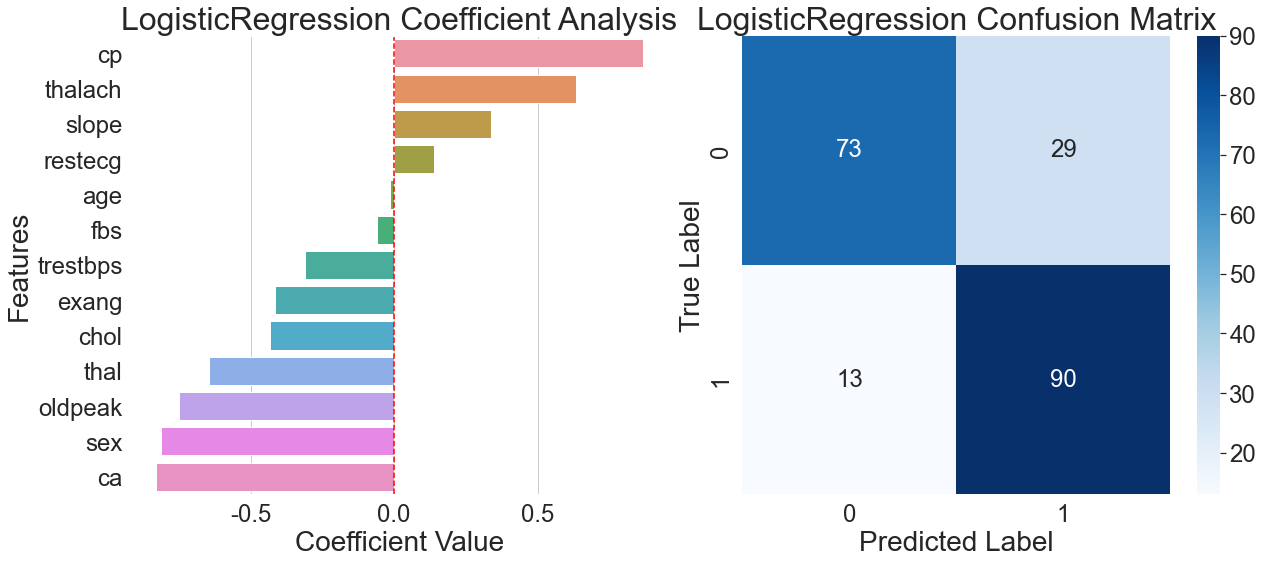
3.5. Logistic regression model results
The feature coefficient for chest pain type dominates the model, reaching as high as 0.75, according to the coefficient analysis diagram on the left side of Figure 6. This pattern of over-reliance on a single feature severely limits the model's generalization ability, making it difficult to effectively distinguish atypical chest pain patterns. This linear assumption creates a significant generalization bottleneck when confronted with the numerous nonlinear relationships prevalent in the real world.
The misclassification rate for healthy samples was 28.4%, which is much higher than the 8.2% rate for patient samples, according to the confusion matrix on the right side of Figure 6. This discrepancy draws attention to a significant drawback in the logistic regression model's capacity for generalization: its excessive dependence on the crucial characteristic of chest pain type results in subpar discrimination for samples with non-typical symptoms. The model performs poorly when processing samples with insignificant features, highlighting the structural limitations of linear models in adapting to complex real-world relationships.
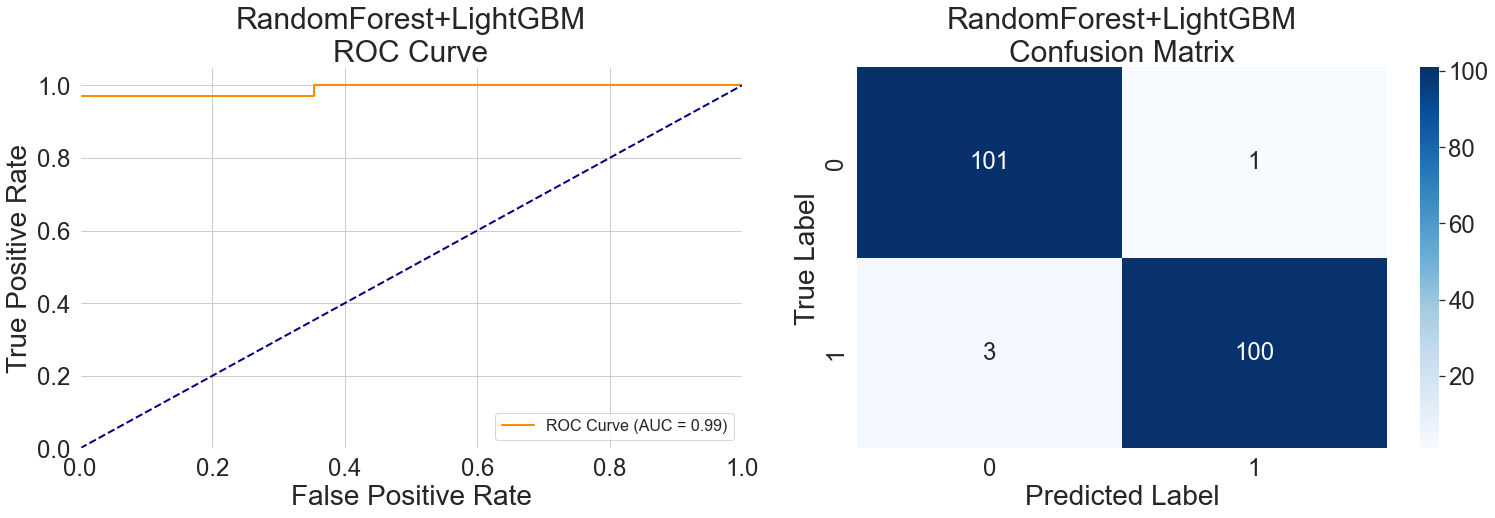
3.6. Random Forest + LightGBM hybrid model results
With a true positive rate of more than 0.95 and a false positive rate of just 0.02 in the first phase, the left ROC curve in Figure 7 shows outstanding performance. This feature demonstrates the hybrid model's high initial generalization capability by effectively identifying typical cases with little misclassification of healthy data. Nevertheless, the curve shows a clear inflection point, and prediction accuracy starts to drop when the false positive rate reaches 0.2, exposing the model's generalization capabilities boundary. This change illustrates how various model attributes interact within the hybrid: Random Forest's sensitivity to age features and LightGBM's sensitivity to heart rate fluctuations work in concert, but they still run into generalization bottlenecks in some age groups or intricate feature combinations.
With just four cases incorrectly classified, the model shows a low overall prediction error, according to the confusion matrix on the right side of Figure 7. These rare errors exemplify the hybrid model's mechanism: when objective examination indicators conflict with subjective symptoms, the model tends to prioritize objective indicators for decision-making. This data-reliability-based strategy enhances the model's judgment stability across diverse cases, demonstrating the hybrid architecture's generalization advantage in complex medical scenarios.
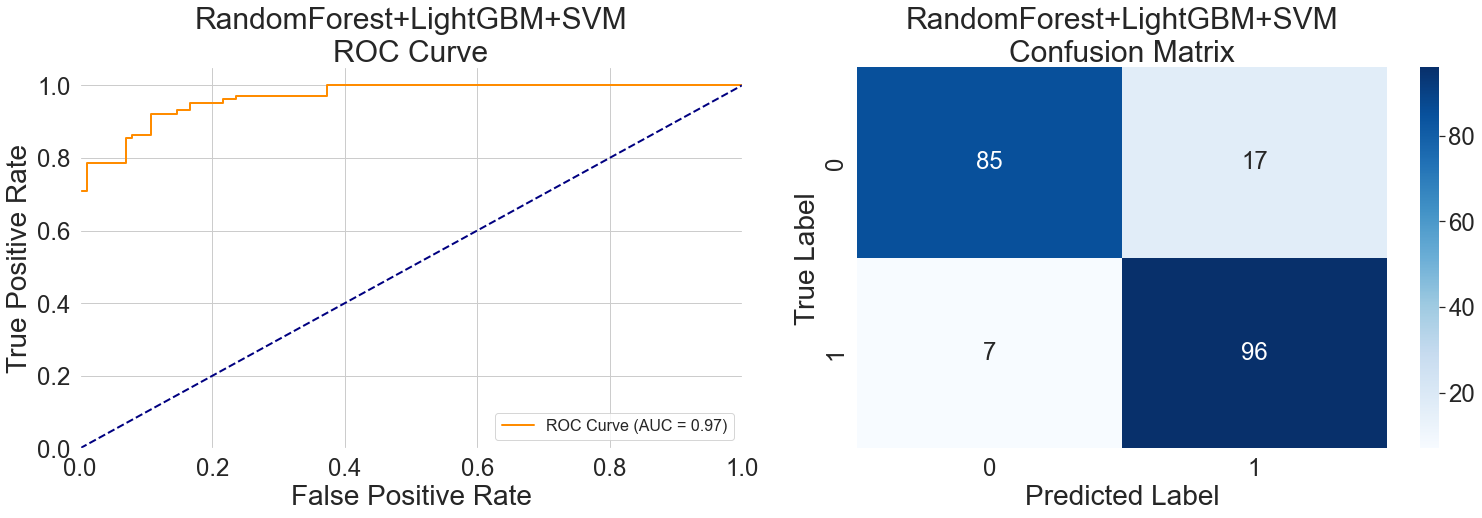
3.7. Random Forest + LightGBM + SVM hybrid model results
The plateau in the middle section of the ROC curve in Figure 8 (left) reflects this hybrid model's generalization capability when handling samples with ambiguous features. When input data lacks typical pathological features, the sensitivity of Random Forest to symptoms, the analytical capability of LightGBM for dynamic indicators, and the relatively conservative classification tendency of SVM complement each other, forming a synergistic decision-making mechanism. This nonlinear response represents a level of generalization difficult for a single model to achieve.
The steep ascent at the curve's end reveals the hybrid's unique decision mechanism: when any model identifies high-risk objective indicators, it tends to classify the sample as positive even if other features are atypical. This approach enhances the detection of severe cases but also indicates the need to balance recognition discrepancies among different models during hybrid training.
Misclassified samples in the confusion matrix are further examined in Figure 8's right panel. Fourteen of the 17 healthy samples that were incorrectly labeled were from middle-aged and older people. Five of the seven patient samples that were incorrectly identified were from cases of asymptomatic vascular lesions. The SVM's capacity for boundary processing is more crucial in this situation. When faced with fresh situations, the hybrid model's generalization performance is more stable than that of individual models because of this dynamic weight adjustment method.
3.8. GBDT + Random Forest hybrid model results
In the ROC curve on the left side of Figure 9, the flat section in the middle of the curve reflects the generalization characteristics of this hybrid model when handling samples with atypical features. It takes more steps for the two models to come to an agreement on a choice because of the GBDT model's gradient optimization mechanism for continuous variables and the Random Forest model's emphasis on discrete features.
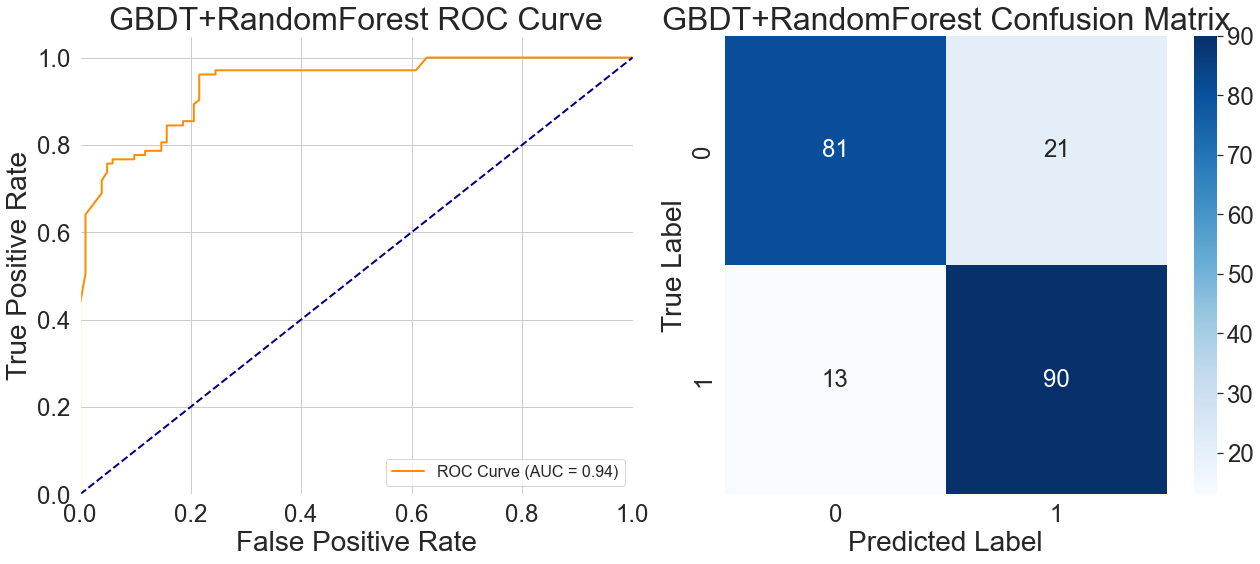
Figure 9's confusion matrix on the right side provides additional insight into the model's features and generalization constraints. Of the 21 healthy samples that were incorrectly classified, 17 were clustered in people who were 50 years of age or older. Conversely, among the 13 unidentified patient samples, 9 exhibited mild vascular obstruction accompanied by typical chest pain. In the training data, these occurrences were naturally rare. This happens because the model has a tendency to make compromise choices when the symptom-based qualities prioritized by Random Forest clash with the numerical features that GBDT relies on. This somewhat reduces its diagnostic precision in actual medical situations.
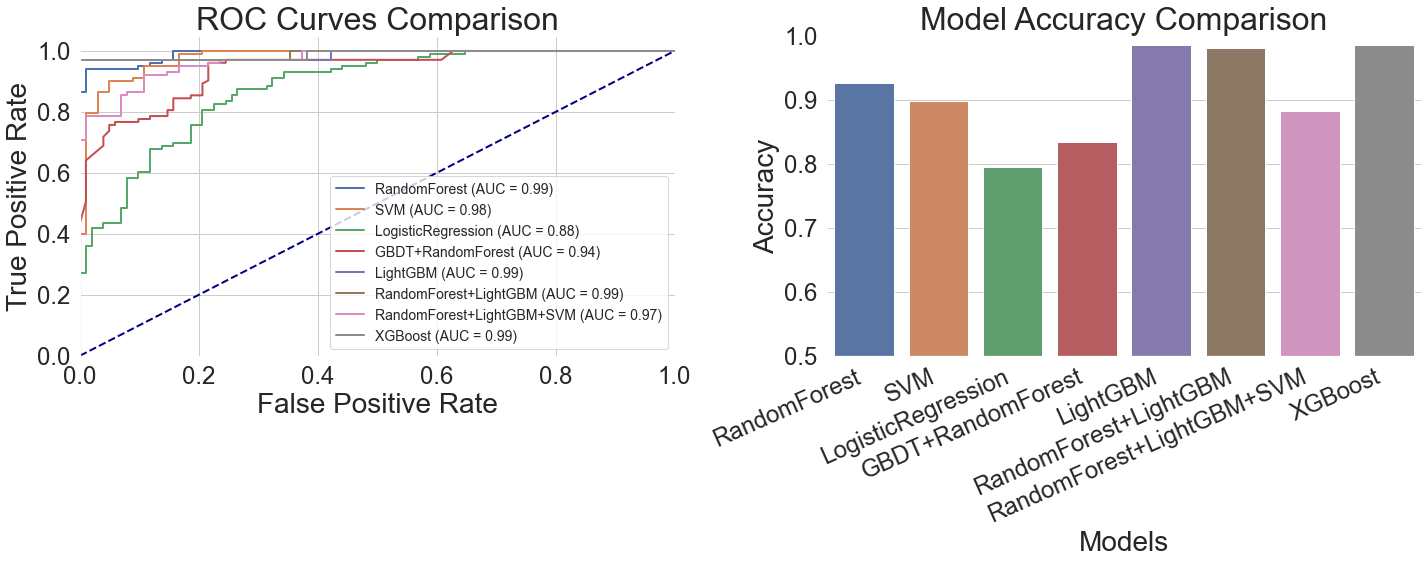
3.9. Performance comparison of models
Overall, the generalization benefits of gradient-boosted tree models were evident. In the left ROC curve comparison of Figure 10, all gradient-boosted tree curves closely approached the upper-left corner of the coordinate axes, achieving AUC values of 0.99, indicating excellent discriminative power. Interestingly, the Random Forest + LightGBM hybrid model greatly reduces misdiagnosis by maintaining a very low false positive rate and an extraordinarily high true positive rate. On the other hand, when the false positive rate surpasses 0.4, the Support Vector Machine model's curve flattens, suggesting that it performs worse when dealing with complicated features. With a fairly flat curve and an AUC of just 0.88, the logistic regression model had the worst performance, suggesting a limited capacity for discrimination. With an AUC of 0.94, the GBDT + Random Forest hybrid model outperformed conventional models but fell well short of the gradient boosting tree model. Its ROC curve exhibits a flatter mid-range.
LightGBM obtained the maximum accuracy of 98.54%, as indicated by the accuracy comparison table on the right side of Figure 10 and Table 2. With an accuracy of 98.05%, the Random Forest + LightGBM hybrid model came in second. Its accuracy was marginally inferior even though its AUC value was the same as LightGBM's, most likely because of small discrepancies between the two models while working with particular samples. With an accuracy of 97.56%, XGBoost came in third place and performed well on thalassemia samples. According to their ROC curve performance, Support Vector Machine and Logistic Regression obtained accuracy rates of 89.76% and 79.51%, respectively, indicating their limits when handling such medical data.
It's not always the case that combining several machine learning models produces better outcomes than using just one. Despite utilizing the advantages of all three models, the Random Forest + LightGBM + SVM hybrid's accuracy of 88.29% was less than that of the LightGBM model alone. This hybrid model's ROC curve showed instability in the region of 0.3 to 0.5 false positive rates, most likely as a result of the several models' disparate decision criteria (Table 2).
LightGBM performed the best overall on this dataset because it could handle both discrete symptom features and physiological indications that changed over time. Model hybrids are not always useful; instead of heedlessly pursuing intricate combinations, one should choose the best individual model based on the properties of the data.
|
Model |
Accuracy |
Recall |
F1 Score |
|
Random Forest |
0.9268 |
0.9268 |
0.9267 |
|
LightGBM |
0.9854 |
0.9854 |
0.9854 |
|
XGBoost |
0.9756 |
0.9756 |
0.9756 |
|
Support Vector Machine |
0.8976 |
0.8976 |
0.8972 |
|
Logistic Regression |
0.7951 |
0.7951 |
0.7938 |
|
Random Forest + LightGBM |
0.9805 |
0.9805 |
0.9805 |
|
Random Forest + LightGBM + Support Vector Machine |
0.8829 |
0.8829 |
0.8826 |
|
GBDT + Random Forest |
0.8341 |
0.8341 |
0.8339 |
4. Conclusion
This study explores important parameters impacting model generalization capabilities by methodically comparing the performance of several machine learning models in cardiac illness prediction tasks. The results show that Gradient Boosted Trees (GBT) perform best in generalization when predicting this type of medical data, mainly because of their capacity to manage complicated feature interactions and continuous physiological signs. The study also shows how model hybrids affect generalization: whereas excessive fusion leads to choice conflicts that impair performance, moderate model fusion improves generalization through complementary strengths. Due to their incapacity to capture intricate nonlinear interactions in medical data, traditional linear models show limited applicability. These results imply that rather than heedlessly chasing complexity, medical prediction tasks should give priority to model architectures that are in line with data features. In order to improve generalization capacities for marginal samples and rare cases, future research may investigate the synergistic optimization of feature engineering and model construction.
References
[1]. Zhang, H. R., Yu, B., & Xu, P. (2025). Analysis of landslide susceptibility in the upper reaches of the Yellow River based on a logistic regression model.People's Yellow River, 47(7), 35–39.
[2]. Nong, S. F., Ye, Z. H., & Yu, H. Z. (2025). Application and validation of support vector machine models in optimizing formulas for cerebral stroke treatment with brain pulse passage.Journal of Guangdong Pharmaceutical University, 41(4), 142–150. https: //doi.org/10.16809/j.cnki.2096-3653.2025040303
[3]. Zhang, J., Chen, W., & Wu, W. B. (2025). Prediction of selenium content in corn grown on selenium-deficient land using a random forest model. Environmental Chemistry. Advance online publication.Retrieved August10, 2025, from https: //link.cnki.net/urlid/11.1844.X.20250805.1101.020
[4]. Zhang, X.-J., Li, G., & Xie, J.-X. (2025). Prediction of flow boiling heat transfer characteristics in tubes using random forest and XGBoost algorithms.Journal of Beihang University. Advance online publication. Retrieved August 10, 2025, from https: //link.cnki.net/urlid/11.2625.V.20250807.1500.005
[5]. Zhang, X., Huang, X., & Zhang, X. T. (2025). Study on total phosphorus prediction in reservoirs based on explainable machine learning methods.Journal of Aquatic Ecology. Advance online publication. https: //doi.org/10.15928/j.1674-3075.202407250001
[6]. Ruan, K. X., Li, B., & Ran, Y. (2025). Comparative study of multiple machine learning and backpropagation neural network models in classifying TCM tonifying formulas.Journal of Traditional Chinese Medicine, 31(7), 232–237. https: //doi.org/10.13862/j.cn43-1446/r.2025.07.040
[7]. Shen, S. L., Zhong, F., & Liang, X. (2023). Analysis and prediction of hypertension based on random forest and gradient boosting decision trees.Computer Times, (5), 15–19. https: //doi.org/10.16644/j.cnki.cn33-1094/tp.2023.05.004
[8]. Li, G. Q., Lin, X. X., & Peng, M. (2023). Analysis and identification of ancient glass artifacts based on random forest and support vector machine.Science and Technology Innovation and Application, 13(34), 109–113. https: //doi.org/10.19981/j.CN23-1581/G3.2023.34.025
Cite this article
Lin,X. (2025). Validation of the generalization capability of machine learning models—Based on a heart disease dataset. Advances in Engineering Innovation,16(10),49-58.
Data availability
The datasets used and/or analyzed during the current study will be available from the authors upon reasonable request.
Disclaimer/Publisher's Note
The statements, opinions and data contained in all publications are solely those of the individual author(s) and contributor(s) and not of EWA Publishing and/or the editor(s). EWA Publishing and/or the editor(s) disclaim responsibility for any injury to people or property resulting from any ideas, methods, instructions or products referred to in the content.
About volume
Journal:Advances in Engineering Innovation
© 2024 by the author(s). Licensee EWA Publishing, Oxford, UK. This article is an open access article distributed under the terms and
conditions of the Creative Commons Attribution (CC BY) license. Authors who
publish this series agree to the following terms:
1. Authors retain copyright and grant the series right of first publication with the work simultaneously licensed under a Creative Commons
Attribution License that allows others to share the work with an acknowledgment of the work's authorship and initial publication in this
series.
2. Authors are able to enter into separate, additional contractual arrangements for the non-exclusive distribution of the series's published
version of the work (e.g., post it to an institutional repository or publish it in a book), with an acknowledgment of its initial
publication in this series.
3. Authors are permitted and encouraged to post their work online (e.g., in institutional repositories or on their website) prior to and
during the submission process, as it can lead to productive exchanges, as well as earlier and greater citation of published work (See
Open access policy for details).
References
[1]. Zhang, H. R., Yu, B., & Xu, P. (2025). Analysis of landslide susceptibility in the upper reaches of the Yellow River based on a logistic regression model.People's Yellow River, 47(7), 35–39.
[2]. Nong, S. F., Ye, Z. H., & Yu, H. Z. (2025). Application and validation of support vector machine models in optimizing formulas for cerebral stroke treatment with brain pulse passage.Journal of Guangdong Pharmaceutical University, 41(4), 142–150. https: //doi.org/10.16809/j.cnki.2096-3653.2025040303
[3]. Zhang, J., Chen, W., & Wu, W. B. (2025). Prediction of selenium content in corn grown on selenium-deficient land using a random forest model. Environmental Chemistry. Advance online publication.Retrieved August10, 2025, from https: //link.cnki.net/urlid/11.1844.X.20250805.1101.020
[4]. Zhang, X.-J., Li, G., & Xie, J.-X. (2025). Prediction of flow boiling heat transfer characteristics in tubes using random forest and XGBoost algorithms.Journal of Beihang University. Advance online publication. Retrieved August 10, 2025, from https: //link.cnki.net/urlid/11.2625.V.20250807.1500.005
[5]. Zhang, X., Huang, X., & Zhang, X. T. (2025). Study on total phosphorus prediction in reservoirs based on explainable machine learning methods.Journal of Aquatic Ecology. Advance online publication. https: //doi.org/10.15928/j.1674-3075.202407250001
[6]. Ruan, K. X., Li, B., & Ran, Y. (2025). Comparative study of multiple machine learning and backpropagation neural network models in classifying TCM tonifying formulas.Journal of Traditional Chinese Medicine, 31(7), 232–237. https: //doi.org/10.13862/j.cn43-1446/r.2025.07.040
[7]. Shen, S. L., Zhong, F., & Liang, X. (2023). Analysis and prediction of hypertension based on random forest and gradient boosting decision trees.Computer Times, (5), 15–19. https: //doi.org/10.16644/j.cnki.cn33-1094/tp.2023.05.004
[8]. Li, G. Q., Lin, X. X., & Peng, M. (2023). Analysis and identification of ancient glass artifacts based on random forest and support vector machine.Science and Technology Innovation and Application, 13(34), 109–113. https: //doi.org/10.19981/j.CN23-1581/G3.2023.34.025