


1.Introduction
Vibroseis seismic acquisition technology is an essential technique for acquiring land seismic data. It offers numerous benefits over explosive sources, such as enhanced safety and environmental protection, higher efficiency, controllable excitation frequency, and lower construction costs. As such, it has been widely adopted in land seismic exploration. The fundamental principle of this method is to employ a theoretically designed scanning signal, i.e. a reference signal, to stimulate the vibroseis. The initial record is gathered via field acquisition, followed by the correlation of the reference signal with said initial record to compact the seismic waveform. This process yields a single shot seismic record of the vibroseis. The formula is as follows:
S(t) W(t)=X(t) (1)
In the equation, S(t) serves as the reference signal, W(t) acts as the master record of collected data, and X(t) is the symbol used for calculating a single shot record.
According to relevant technical principles, the correlation effect is improved by higher correlation between the wavelets in S(t) and W(t). To this end, a geological model (Fig. 1) was established for theoretical simulation testing. The second signal (Fig. 2a) is employed for forward modelling in order to procure the parent record (Fig. 2b). The two forms of correlation singular shots (Fig. 2c-d) are then acquired through the correlation of the two scanning signals (Fig. 2a) with the parent record separately. The results of the test indicate that the quality of the individual shot (Fig. 2c) improves when obtained through the correlation of the No. 2 signal against the mother record. The energy of the in-phase axis concentrates more, and the correlation noise decreases. Conversely, when using the No. 1 signal to correlate with the mother record, the resulting individual shot record (Fig. 2d) shows poor energy concentration and generates more correlation noise. The reason for this is that the No.2 signal corresponds perfectly with the wavelet in the mother record, resulting in the highest correlation between the two signals and thus a superior correlation effect. Conversely, the No.1 signal differs from the wavelet in the mother record resulting in a weaker correlation process and less effective correlation effect. Therefore, after analyzing the relevant technical rules, it was found that the correlation effect is better when the signal S (t) is closer to the wavelet W (t) in the mother record. This means that when the signal related to the mother record is more similar to the wavelet signal, the correlation effect improves. Abbreviations such as S (t) and W (t) have been explained when first used. Additionally, the language used is clear, concise and objective, and conforms to the principles of academic writing, including conventional structure and balance.

Figure 1. Geological model.
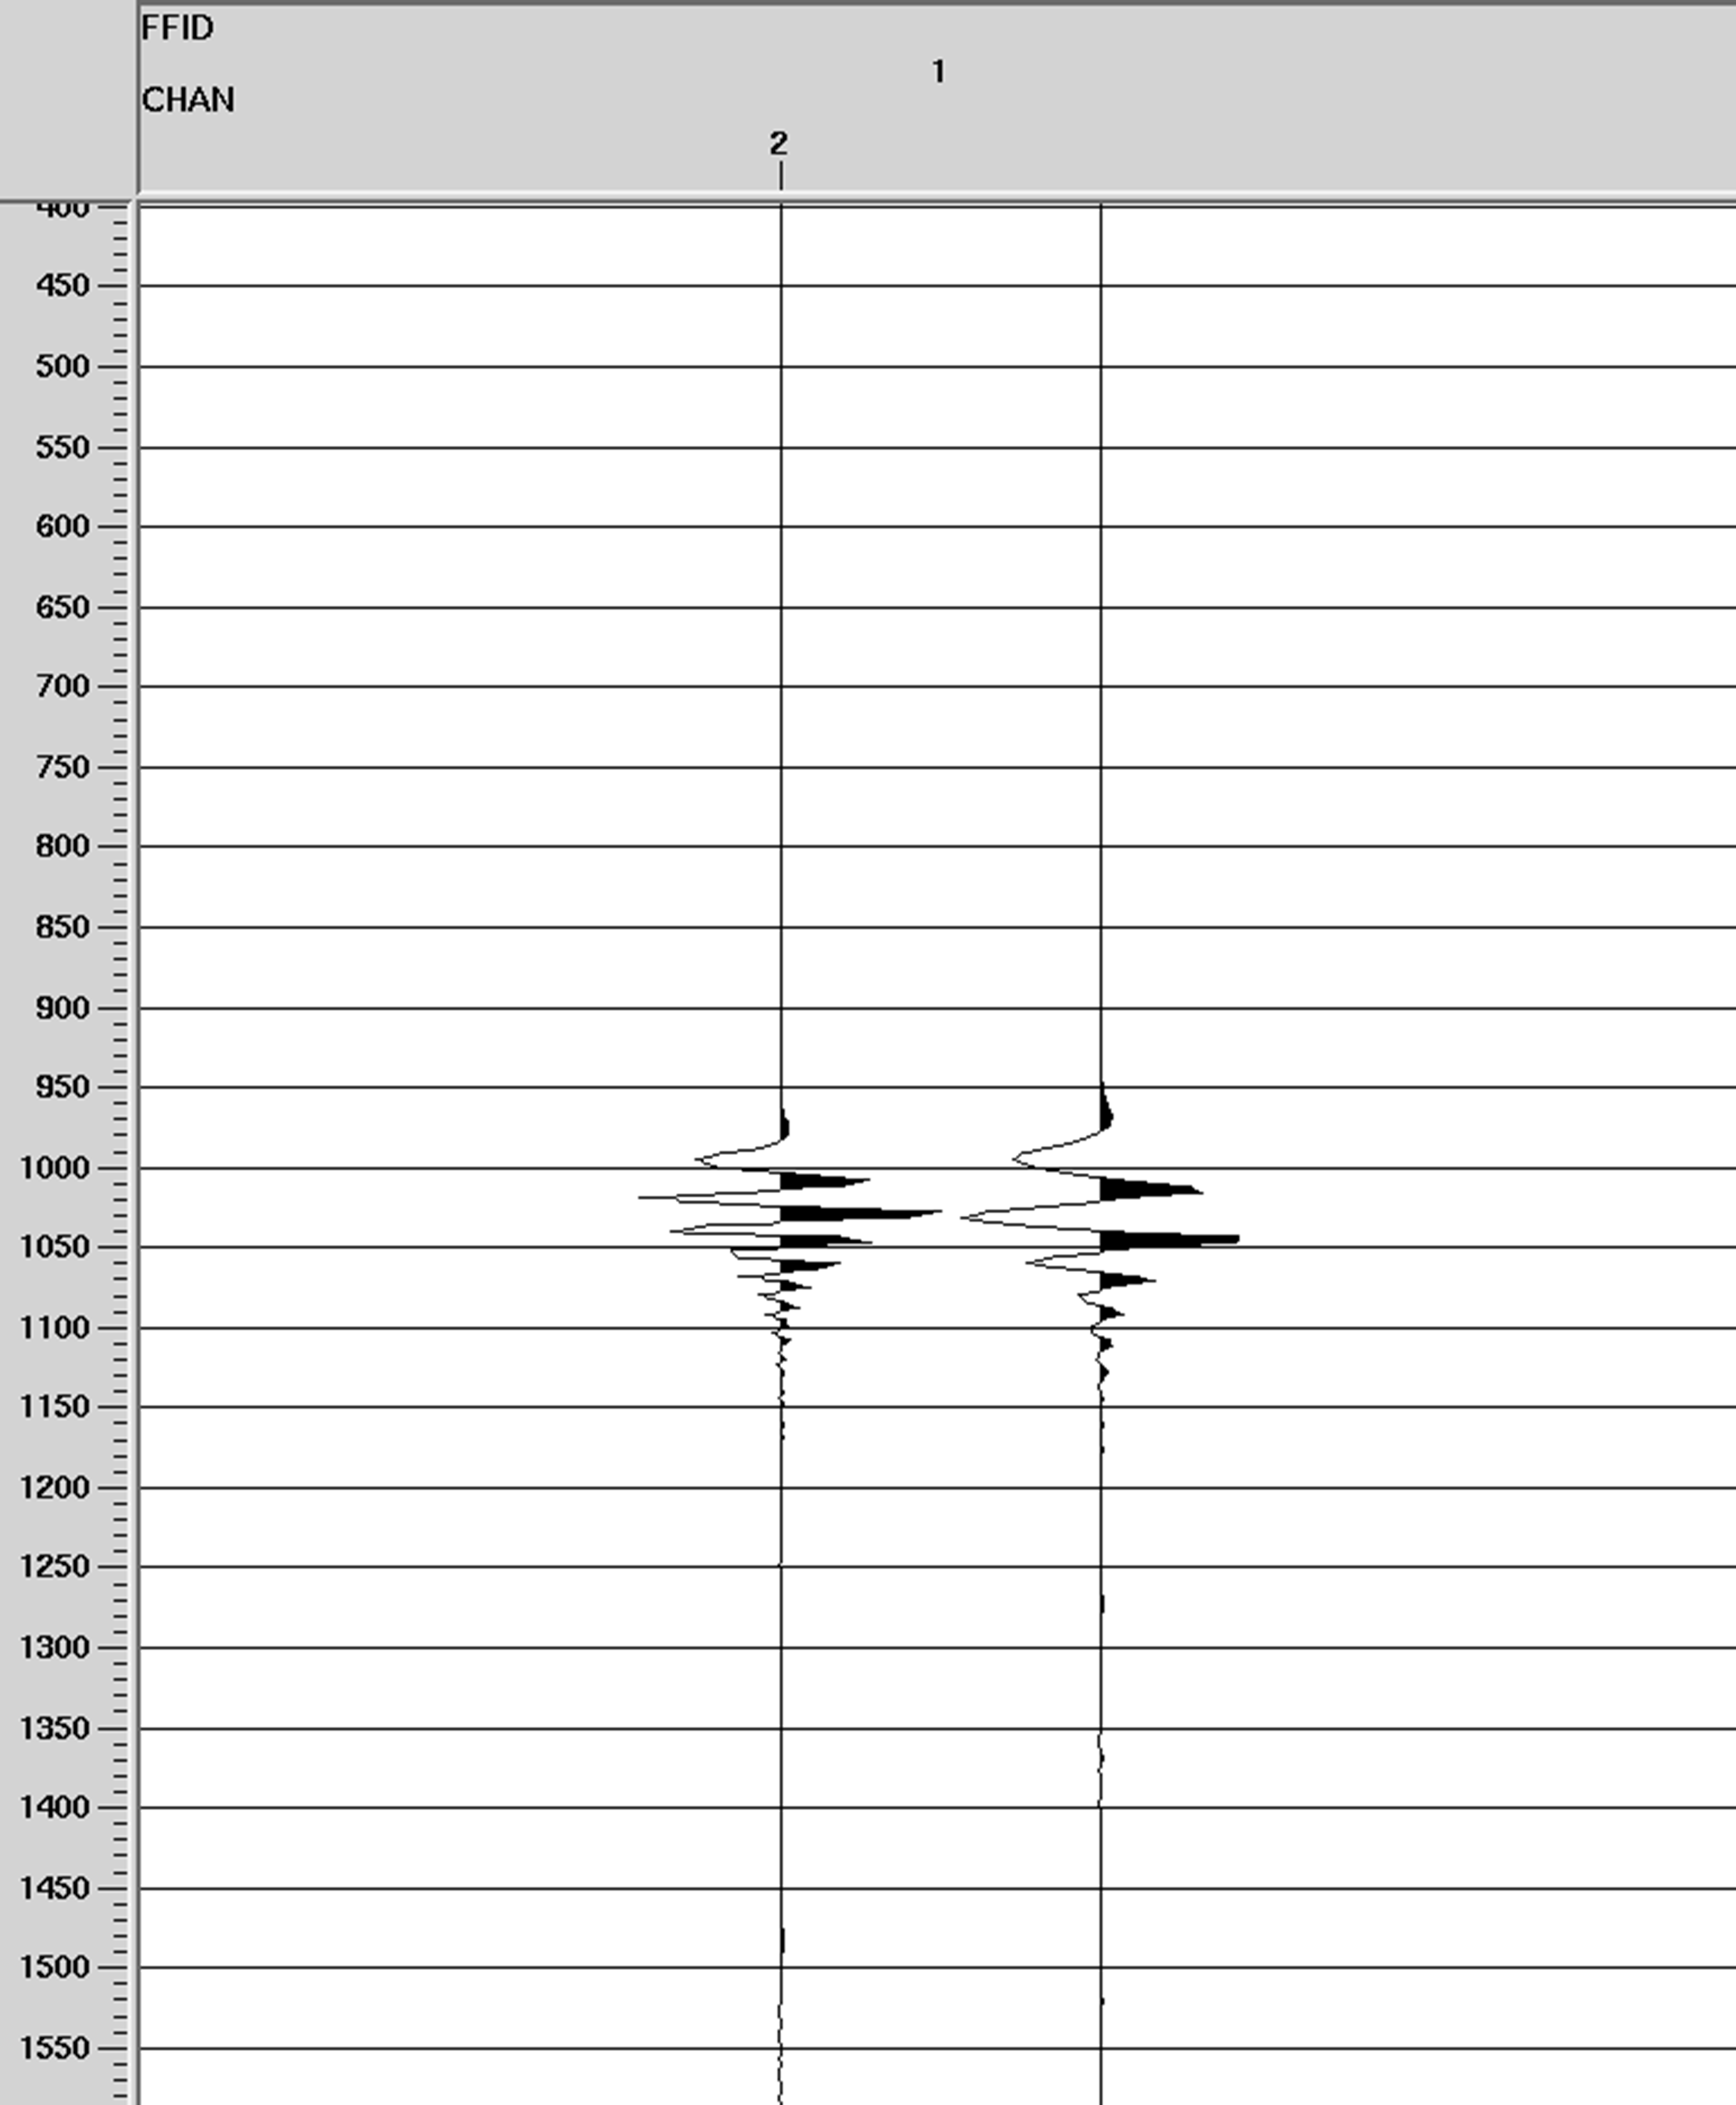
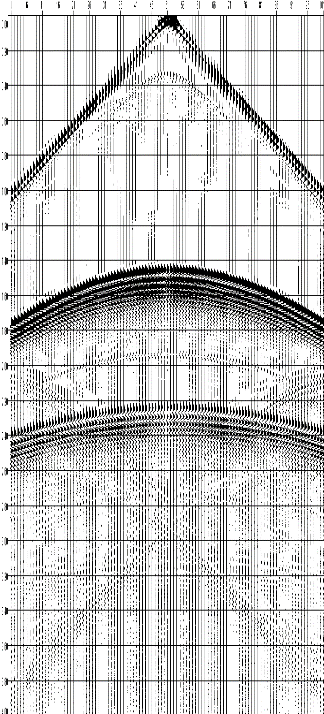
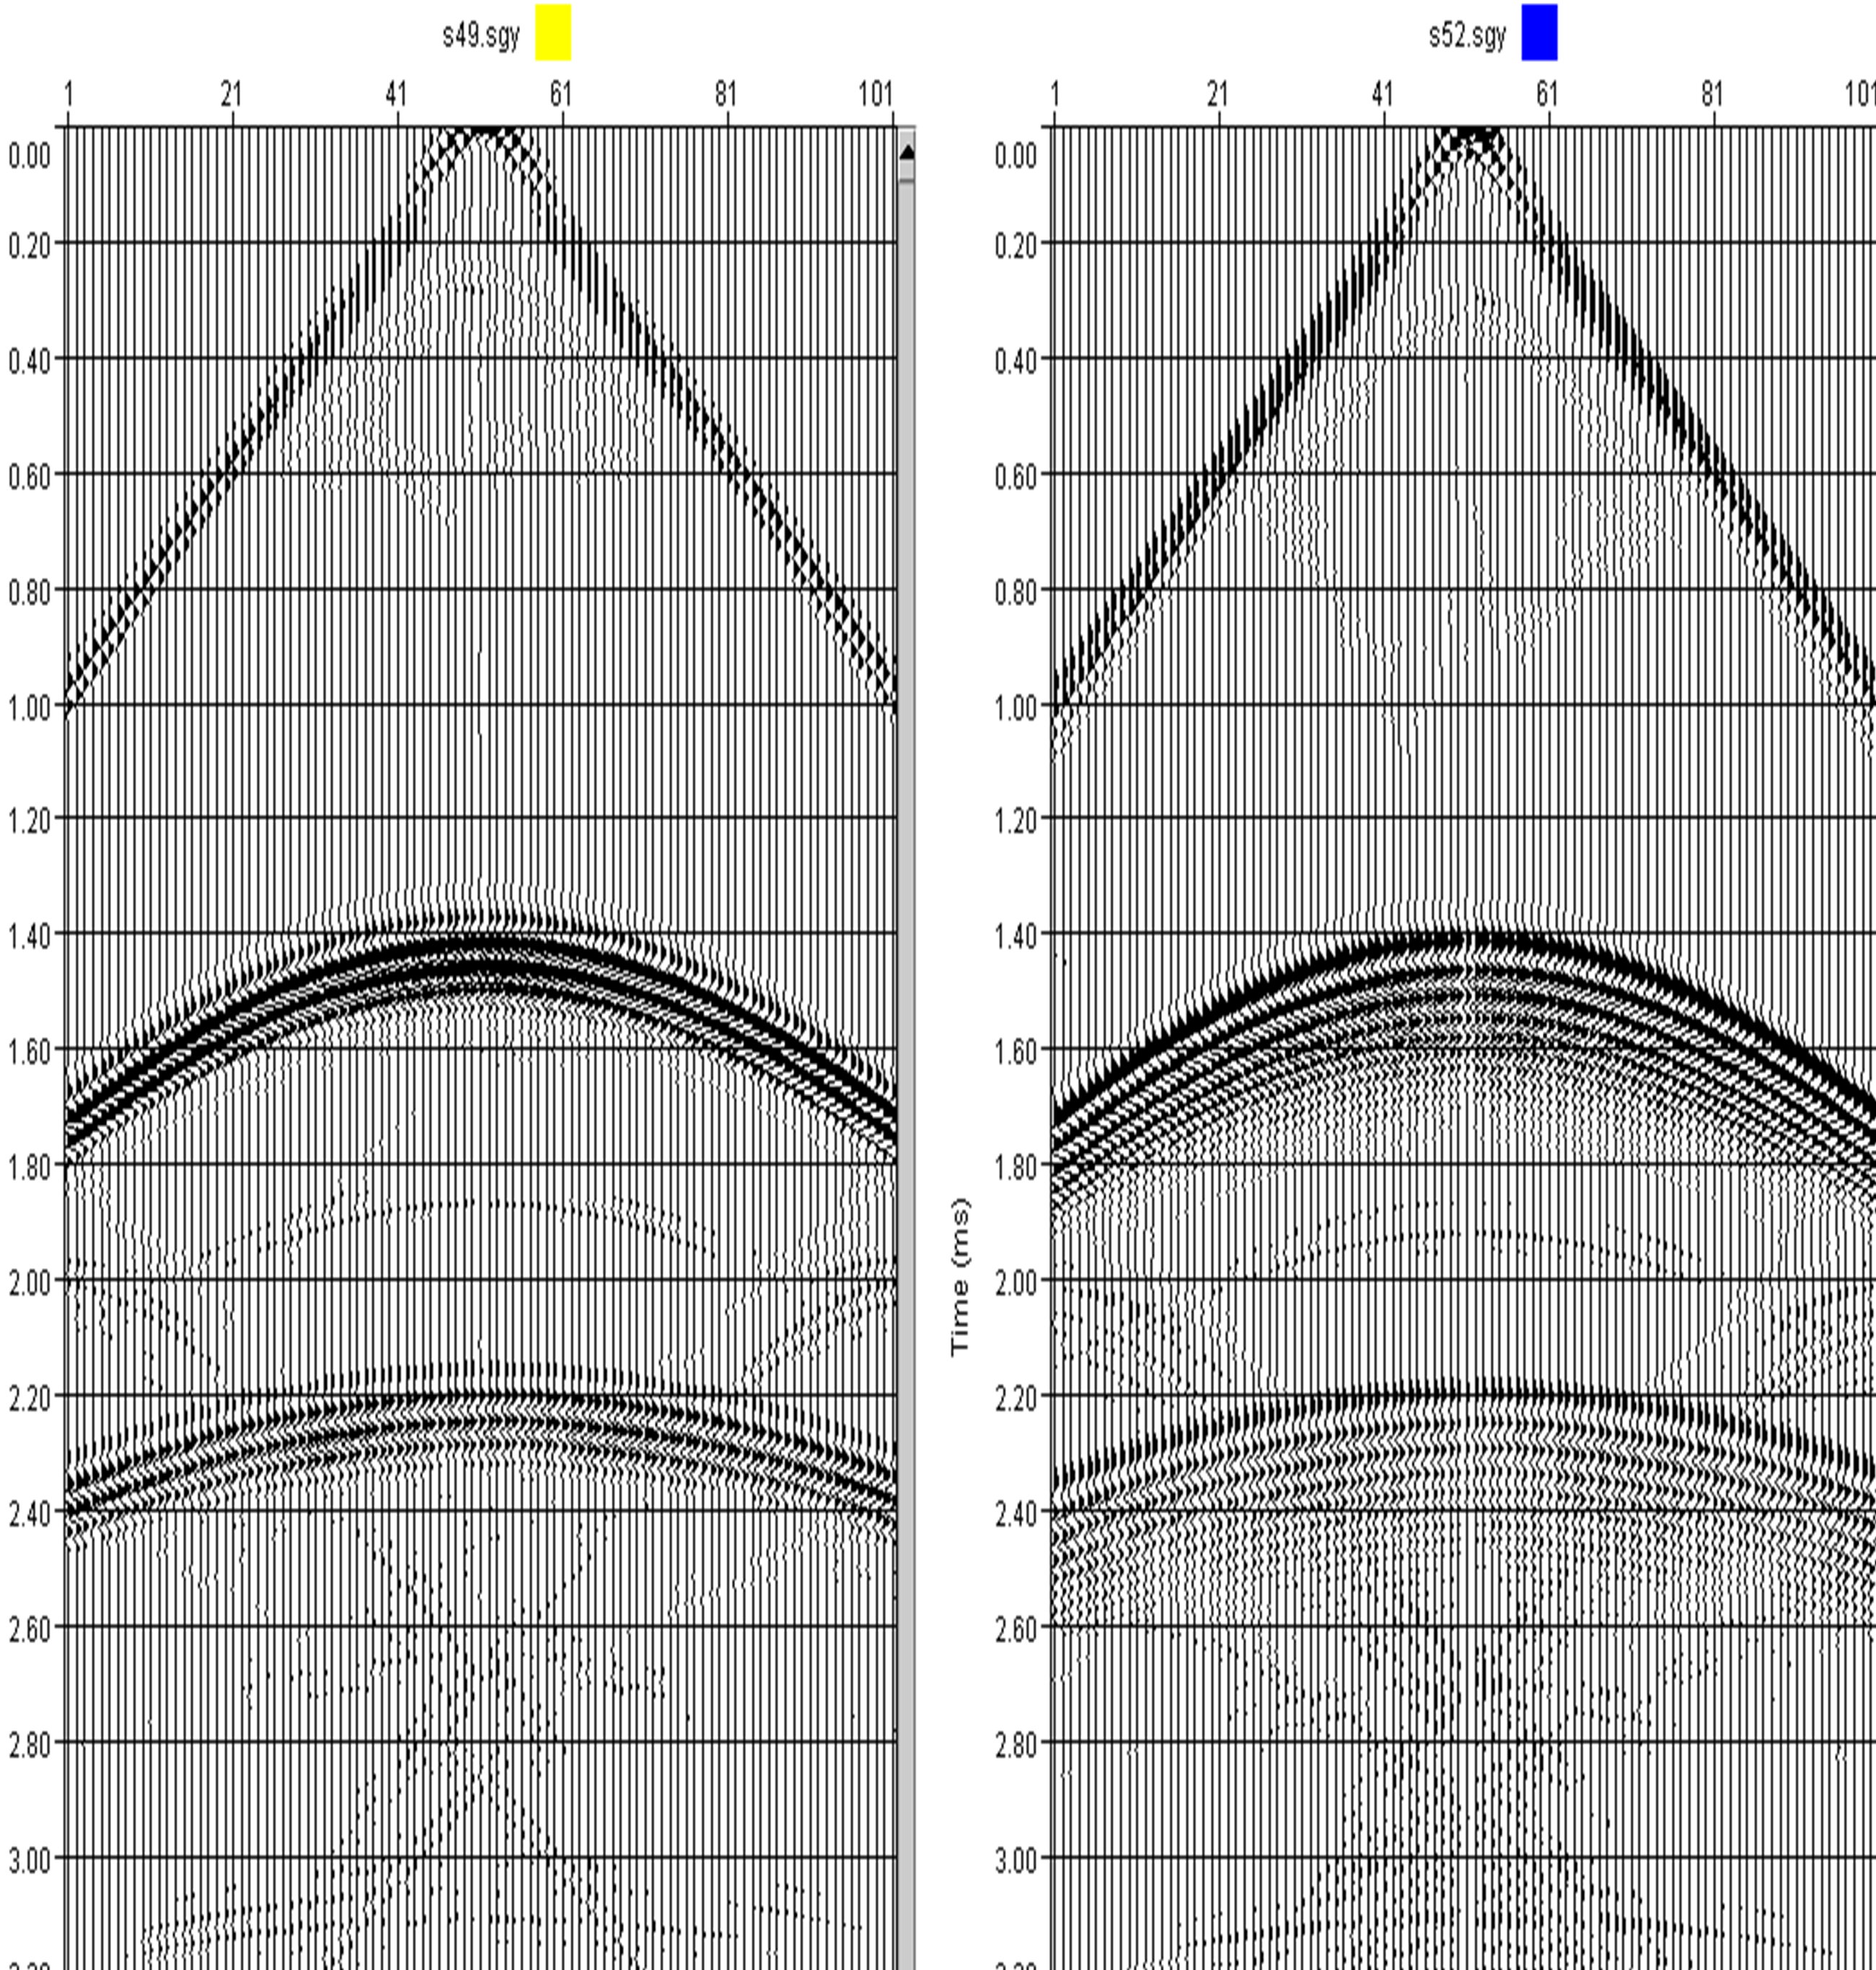
a.scanning signal b.mother record c.Correlation using signal 2 d. Correlation using signal 1
Figure 2. Theoretical simulation analysis.
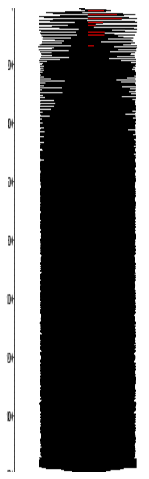
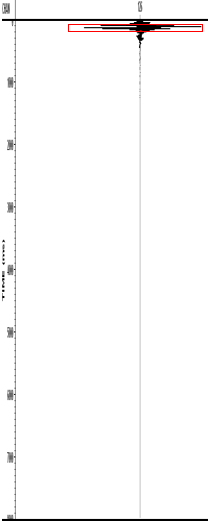
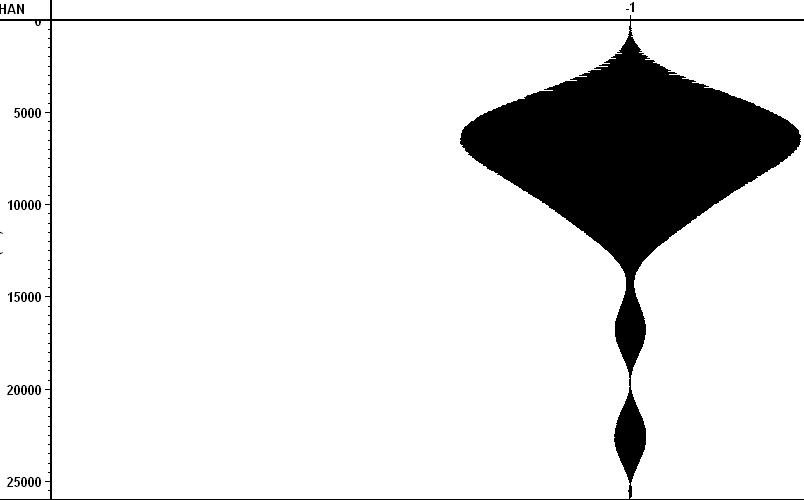
In practical applications, due to mechanical factors related to the vibrator, the vibration signal output from the vibrating plate may vary slightly from the input reference signal. Hence, a proposed method of acquiring the force signal (the true vibration signal output from the actual vibrating plate) is necessary for accurate measurements. Using the force signal as S(t) to correlate with W(t) could, in theory, result in better single shot recordings, prompting a theoretical simulation test. Figures 3 (a-b) and 4 (a-b) show that while the force signal differs from the reference signal and more accurately reflects the output vibration signal of the vibroseis, there is no significant difference between the single shot recordings acquired through the correlation of the two signals and the original recording. It is evident that the implementation of force signals does not provide a significant enhancement in the quality of related recordings. Currently, force signals predominantly serve to examine the suppression of harmonic interference.
a. reference signal b. force signal c. geophone record signal
Figure 3. Schematic diagram of the signal.
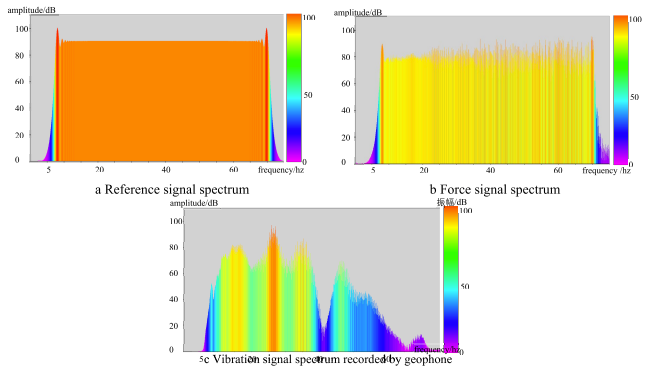
Figure 4. Signal frequency spectrum.
Therefore, the author poses a question: Does the vibration signal received by the surface match that of the vibrating plate, despite the reference signal being different due to mechanical transformation of the source? The answer is negative. The vibrating plate and the ground are not fully connected, and their coupling is a process that reduces the vibration signal's frequency (Fig.4). This process is defined by the following formula:
F(t) * A(t) = D(t) (2)
In the equation, F(t) represents the force signal, A(t) denotes the coupling relationship between the vibrating plate and the ground surface, D(t) is the actual vibration signal produced by the ground surface, and * symbolizes the convolution operation.
Based on the analysis, it is evident that the quality of a single-shot recording obtained by correlating the actual vibration signal produced by the surface with the reference recording is superior to that obtained by correlating the reference signal, force signal, and reference recording.
2.Trial calculation of actual data
In this study, the vibration signal on the surface recorded by the geophone in proximity to the vibroseis (15m) (Fig. 3c) is deemed to be the representation of the actual surface signal. To guarantee a conducive coupling relationship with the surface, the embedding of the geophone must be secure and uniform.
As the geophone and vibroseis have a specific distance separating them, the recorded length by the geophone tends to exceed the scanning signal length of the vibroseis. Thus, to ensure accurate correlation, it is crucial to rectify the geophone's recorded signal before proceeding with the correlation. This is followed by correcting the recorded signal of the geophone according to the calculated time difference. Firstly, a time difference is calculated by employing the surface velocity and distance between the vibroseis and geophone. Secondly, the detector's recorded signal is intercepted for an equal duration as the reference signal.
Although the detector's vibration signal scanning length and initial arrival time are the same as the reference signal after the above correction, the signal components are more complicated and unsuitable for direct correlation. Based on the analysis of the simulation test, when the seismic wave generated by the source vibration reaches the detector, the vibration signal is transmitted underground. As the signal approaches a shallow wave impedance boundary, such as the position transmitted at 1 second, it reflects and is received by the detector. The signal received by the detector therefore contains both the surface vibration signal and the reflection information from the subsurface (Fig. 5). Extracting the true surface vibration signal from the complex signal received by the geophone is a fundamental problem that needs to be solved. To solve this problem, the reference signal is correlated with the signal received by the detector (Fig. 5c) to produce Figure 5d, which allows the true surface vibration signal to be determined.
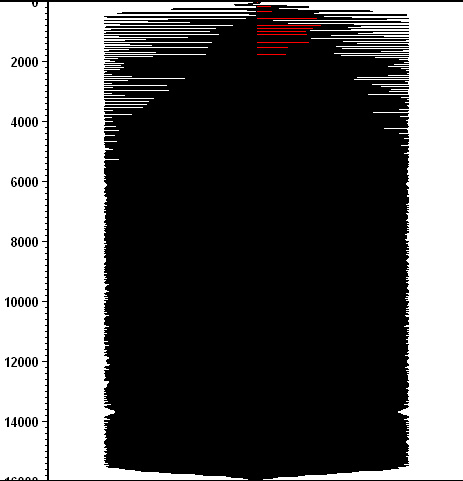

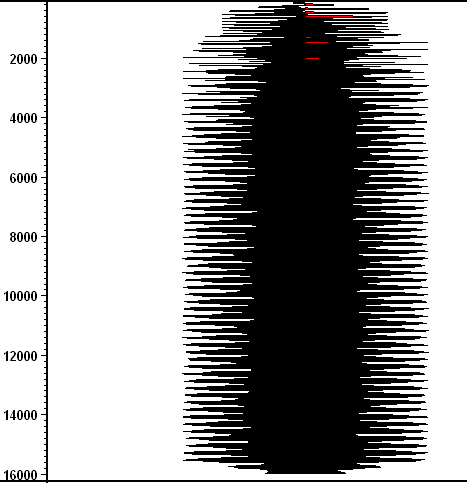
a.ground vibration signal b.reflected signal c.geophone signal d.related records e.extracted surface vibration signals
Figure 5. The process of extracting surface vibration signals.
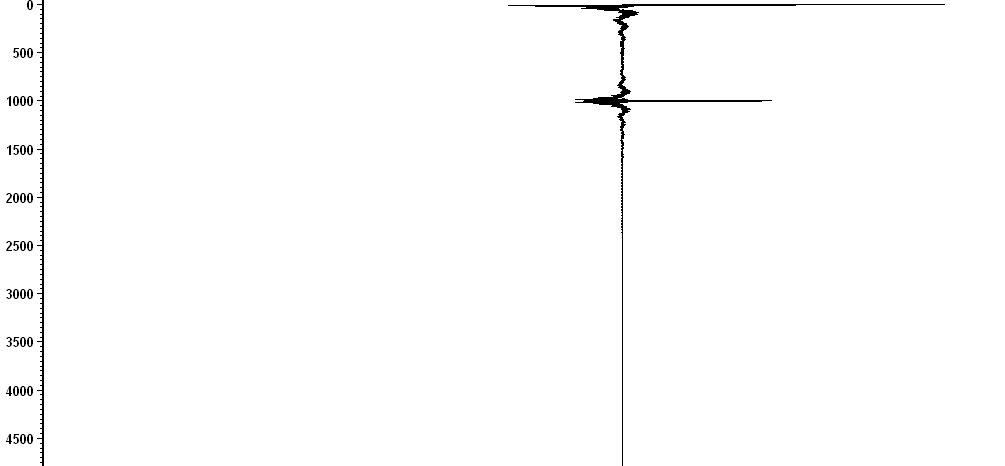
This method is used to check the actual data. The geophone signal is related to the reference signal, only the first arrival part is selected and the rest is discarded, and the first arrival wave is inversely transformed back to the 'longer' surface vibration signal (Fig.6). The extracted real surface vibration signal is correlated with the mother record to obtain a single shot.
a. related records b. extracted surface vibration signals
Figure 6. Extraction of actual data.
The experimental calculation shows that the surface vibration signal recorded by the geophone is correlated with the mother record, and the signal-to-noise ratio and resolution of the single shot record are significantly higher than those obtained using the reference signal and the force signal. Firstly, the first arrival is clearer. The interference wave at point A of the single shot recording (Fig.7a) associated with the mother recording using the reference signal is no longer present in the associated single shot recording (Fig.7c) obtained using the surface vibration signal recorded by the geophone. Secondly, the energy and signal-to-noise ratio of the target layer are significantly improved and the target layer is clearer. Considering the fact that the single shot recording (Fig.7b) obtained by using the force signal to correlate with the parent recording is similar to the single shot recording (Fig.7a) obtained by using the reference signal to correlate with the parent recording, there is no significant difference. Therefore, in the following comparative analysis, only the reference signal, the geophone recording signal and the mother recording are compared and analysed.
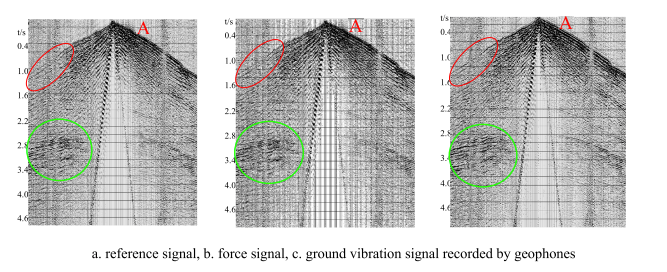
Figure 7. Single shot recordings related to the parent recording using different signals.
It can be seen from the enlarged display of the automatic gain section (Fig.8) that the single shot record obtained by using the reference signal to correlate with the mother record has more noise and reduces the signal-to-noise ratio of the single shot, while the single shot record obtained by using the geophone record to correlate with the mother record has a higher signal-to-noise ratio and less correlation noise.
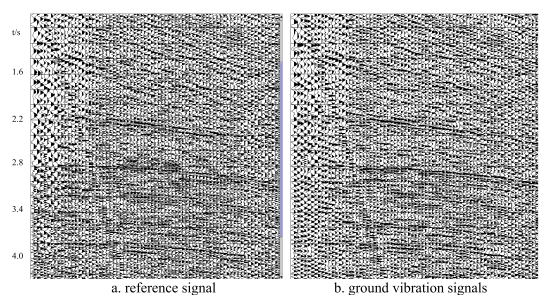
Figure 8. AGC display of single shot records in relation to the parent record using different signals.
It can also be seen from the multi-frequency scan (Fig. 9) that the single shot record obtained by correlating the surface vibration signal recorded by the geophone with the mother record is significantly better than the single shot record obtained by correlating the reference signal in different frequency bands.
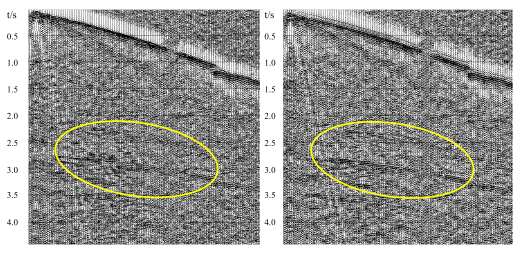
Figure 9. Two types of records (30-60Hz) filter display.
From the quantitative analysis of the signal-to-noise ratio of the two methods (Fig.10), it can be seen that the single shot correlation using the geophone to record the surface vibration signal is higher than the single shot correlation using the reference signal.
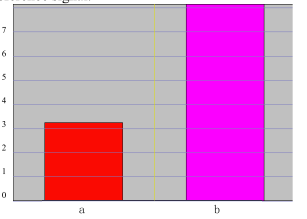
Figure 10. Quantitative analysis of signal-to-noise ratio.
From the comparison and analysis of the profiles obtained by the two methods (Fig. 11), the profiles obtained by using the geophone to record the surface vibration signal, the reflection of each layer is clearer and more continuous, and the signal-to-noise ratio is obviously improved.
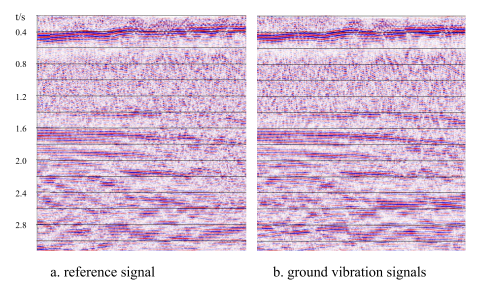
Figure 11. Sectional comparison of two methods.
3.Conclusion
The closer the correlation signal is to the wavelet in the mother dataset, the better the quality of the correlation single shot, the higher the signal-to-noise ratio and the higher the resolution.
Compared to the reference signal and the force signal, it is closer to the wavelet in the mother data set. It can improve the signal-to-noise ratio and resolution of the corresponding single shot, improving the quality of the single shot and helping to improve the imaging effect of seismic data. Using the geophone recording signal near the vibroseis to approximate the actual vibration signal generated by the surface, compared with the reference signal and the force signal, it is closer to the wavelet in the mother record.
References
[1]. Cao Wuxiang, To suppress harmonic interference by force signal of vibroseis,geophysical prospection for petroleum,2011,50(1):89-92
[2]. Ni Yudong, Vibroseismic exploration acquisition technology[M]. Beijing. Petroleum Industry Press,2014,52-94.
[3]. Peng Renyan. Quality Control Method for Vibroseismic Source Data Acquisition [J]. Inner Mongolia Petrochemical Industry,2015,37(21):27-29.
[4]. Cui Hongliang, Wang Ruizhen, Cheng Zhanzhan, Huang Miao, Zheng Xuexian. The Influence of Distortion of Vibroseismic Force Signal on Data Quality. Proceedings of the 2022 China Petroleum Geophysical Exploration Academic Annual Conference (Volume 1), 2022, 27-30.
[5]. Zhu Di, Cao Yuning and Zhang Dalong. Discussion on the Influence of Vibroseismic Performance on Data Quality. Proceedings of the 2022 China Petroleum Geophysical Exploration Academic Annual Conference (Volume 1), 2022, 217-220.
Cite this article
Zhang,L. (2023). The quality improvement method of vibroseis records. Advances in Engineering Innovation,3,9-16.
Data availability
The datasets used and/or analyzed during the current study will be available from the authors upon reasonable request.
Disclaimer/Publisher's Note
The statements, opinions and data contained in all publications are solely those of the individual author(s) and contributor(s) and not of EWA Publishing and/or the editor(s). EWA Publishing and/or the editor(s) disclaim responsibility for any injury to people or property resulting from any ideas, methods, instructions or products referred to in the content.
About volume
Journal:Advances in Engineering Innovation
© 2024 by the author(s). Licensee EWA Publishing, Oxford, UK. This article is an open access article distributed under the terms and
conditions of the Creative Commons Attribution (CC BY) license. Authors who
publish this series agree to the following terms:
1. Authors retain copyright and grant the series right of first publication with the work simultaneously licensed under a Creative Commons
Attribution License that allows others to share the work with an acknowledgment of the work's authorship and initial publication in this
series.
2. Authors are able to enter into separate, additional contractual arrangements for the non-exclusive distribution of the series's published
version of the work (e.g., post it to an institutional repository or publish it in a book), with an acknowledgment of its initial
publication in this series.
3. Authors are permitted and encouraged to post their work online (e.g., in institutional repositories or on their website) prior to and
during the submission process, as it can lead to productive exchanges, as well as earlier and greater citation of published work (See
Open access policy for details).
References
[1]. Cao Wuxiang, To suppress harmonic interference by force signal of vibroseis,geophysical prospection for petroleum,2011,50(1):89-92
[2]. Ni Yudong, Vibroseismic exploration acquisition technology[M]. Beijing. Petroleum Industry Press,2014,52-94.
[3]. Peng Renyan. Quality Control Method for Vibroseismic Source Data Acquisition [J]. Inner Mongolia Petrochemical Industry,2015,37(21):27-29.
[4]. Cui Hongliang, Wang Ruizhen, Cheng Zhanzhan, Huang Miao, Zheng Xuexian. The Influence of Distortion of Vibroseismic Force Signal on Data Quality. Proceedings of the 2022 China Petroleum Geophysical Exploration Academic Annual Conference (Volume 1), 2022, 27-30.
[5]. Zhu Di, Cao Yuning and Zhang Dalong. Discussion on the Influence of Vibroseismic Performance on Data Quality. Proceedings of the 2022 China Petroleum Geophysical Exploration Academic Annual Conference (Volume 1), 2022, 217-220.