


1 Introduction
Geographic Information Systems (GIS) are vital spatial data analysis tools used in many sectors across the globe, from urban planning and management to disaster management and geological surveying. However, current GIS technologies, largely based on 2D maps, are becoming increasingly incapable of successfully representing diverse, real-world spatial relationships, such as the height of buildings, topography of the terrain, or land-use patterns. This has prompted increasing interest in the integration of more advanced visualisation techniques, such as 3D modelling and Virtual Reality (VR). The shift to 3D GIS provides more dynamic, realistic, and interactive representations of spatial data that are crucial for understanding complex urban landscapes, natural ecosystems, and disaster-affected areas. By working in a fully immersive virtual environment, Virtual Reality (VR) also allows users to experience data through more interactive and lifelike ways. This combination of 3D GIS and VR offers substantial improvements in decision-making processes, by improving the communication of complex spatial data, and thus leading to informed, accurate, and timely decisions. For instance, in urban planning, 3D GIS allows stakeholders to assess the impact of planned changes to infrastructure with greater precision, while in disaster management, it allows for more detailed and accurate damage assessment and simulation of response strategies [1]. Similarly, VR could be crucial in environmental monitoring to visualise ecosystems in 3D and track changes more effectively. In this paper, we aim to explore the technical and practical implications of the integration of 3D modelling and VR in GIS systems.
2 Geographic information visualization in decision-making
It is important in decision-making as it provides an opportunity for decision-makers to translate complex spatial information into simpler, more intuitive and understandable formats that can enhance communication and decision-making. This section examines the importance of geographic information visualisation in decision making and how it can affect the decision-making process in different sectors.
2.1 Role of visualization in urban planning
3D GIS can offer insights to urban planning decisions that typical 2D GIS maps cannot. For instance, it is useful in making decisions about land use, infrastructure and environmental conservation. Spatial data on density, topography and other factors need to be analysed to make planning decisions. 2D GIS maps, such as cartographic representations, can provide some insight into density but do not offer much depth in terms of understanding complex spatial relationships such as building heights, density and topography. 3D modeling can help to understand the spatial arrangement of a cityscape and how buildings and infrastructure can fit together in a sustainable manner. Figure 1. 3D Modeling versus Satellite Imagery of a Cityscape. By mapping in 3D, urban planners can get a better perspective on the spatial arrangement of buildings and infrastructure. This will allow them to predict potential conflicts or synergies in development projects more accurately. When 3D GIS is combined with virtual reality (VR), stakeholders can explore virtual 3D environments to understand the real life impact of urban planning decisions [2]. With VR, stakeholders could walk through virtual urban environments and appreciate how changes to the built environment would affect urban dwellers. This would allow for more sustainable planning. Figure 1 illustrates the comparison between 3D modeling and satellite imagery of a cityscape. This image demonstrates how 3D GIS can improve spatial analysis in the planning of the built environment.
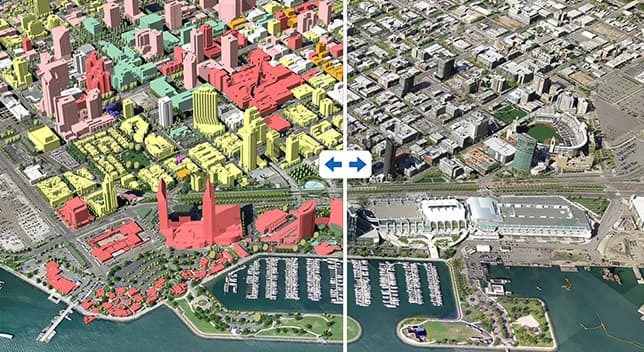
Figure 1. Application of 3D Modeling and Satellite Imagery Comparison in Urban Planning (Source:ResearchGate.com)
2.2 Enhancing environmental monitoring with 3D and VR
Environmental monitoring often monitors changes in land use, vegetation and water bodies, so precision in spatial data is critical. Traditional monitoring techniques such as satellite imagery or aerial photography only produce a flat representation of the environment, which can hide important details. 3D modelling applied to GIS data can produce a more realistic representation of key topographic features such as mountain ranges, rivers and forests, allowing for more nuanced insights regarding environmental changes. For instance, 3D-GIS could show how deforestation impacts adjacent ecosystems by observing real-time changes to terrain [3]. This information could be visualised through VR, immersing users in the environment and enabling them to witness how environmental processes such as erosion or flooding unfold in three dimensions. This experience could provide valuable insights for environmental scientists and policymakers seeking to understand the impact of environmental interventions by both analysing spatial data and simulating future scenarios in the field.
2.3 Application in disaster management
In disaster management, the visualisation of spatial data is also crucial to making accurate and timely decisions. Flat 2D maps used in disaster response can fall short of illustrating damage in the affected area if they’re not viewed from an aerial perspective, especially in a region hit by an earthquake, flood or hurricane. A 3D GIS can construct detailed digital models of buildings and infrastructure in the area hit by a natural disaster, as well as roads and surrounding landmarks. This allows for a more comprehensive understanding of the damage and efficient evacuation routes or resource allocations. In VR, a 3D SEM can be even more valuable to planners, as it will provide the versatility to simulate disaster scenarios and visualise the effectiveness of various response strategies [4]. For example, in real-time, how will dense fog or an earthquake affect decision-making and response actions on the ground? How many helpers would it take to safely rescue a victim in this specific area? In the diagram shown in Figure 2 below, an emergency responder observes a 3D simulation platform used for training disaster management.
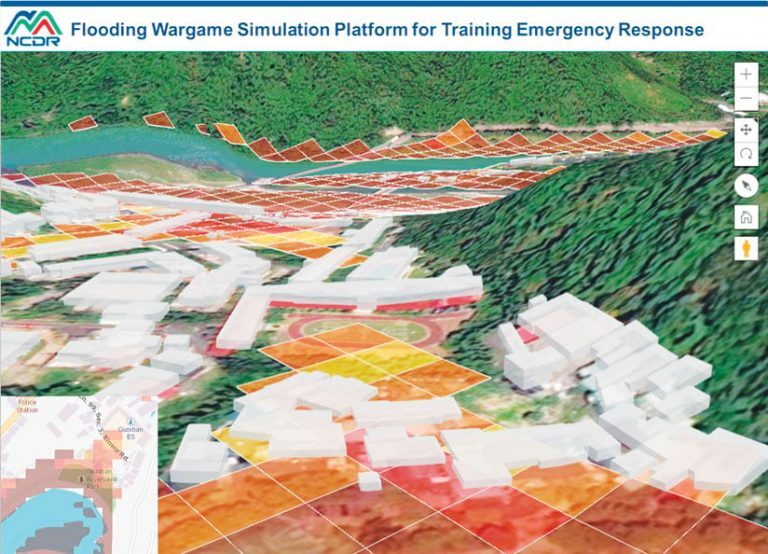
Figure 2. Flooding Wargame Simulation Platform for Emergency Response Training (Source:Esri.com)
3 Integration of 3D modeling and VR in GIS
The integration of 3D modeling and VR into GIS represents a significant leap forward in spatial data representation. While traditional GIS systems are limited to flat, 2D data, 3D GIS adds depth and realism, allowing for a more comprehensive understanding of spatial relationships. This section delves into the technical aspects of integrating these technologies and how they function within the GIS framework.
3.1 Technical requirements for 3D GIS
The computational demands of 3D GIS are significant – processing requires high performance because spatial data often comes with a large volume and a large level of detail. In 2D GIS, spatial data is typically handled as flat objects on a surface, often in a two-dimensional coordinate system composed only of x and y axes. By contrast, with 3D GIS comes an additional dimension, the z-dimension, to account for elevation and depth [5]. This means that all the extra data has to be stored and processed. High-per, especially for the processing of real-time visualisation and interaction with 3D models. GPUs are essential for quick and precise rendering. For example, in 3D urban planning or environmental-monitoring applications, we might need to manipulate data in real time, which means support for interactive renderings is a must – something that requires high GPU performance. To create a fully interactive and immersive experience, VR headsets or other immersive displays are necessary. In terms of software platforms, commercial and popular tools such as ArcGIS and QGIS are traditionally 2D software. While many of them have developed 3D visualisation support like QGIS’ sometimes-clunky 3D Viewer, they often require additional plugins or software such as ArcGIS 3D Analyst extension or QGIS3D to enable VR support [6].
3.2 Data sources and processing
Successful use of these 3D GIS and VR applications is dependent on the quality and richness of the spatial data sources used to construct the models. Conventional GIS can use a host of both designed and naturally derived data sources, such as satellite imagery, airborne photogrammetry, geographic field surveys and many others. But to facilitate 3D GIS and VR applications, these data sources must be much richer in their representation of elevation and depth, and can take many forms, including LiDAR (Light Detection and Ranging) scans. For example, dense LiDAR scans can be used to derive detailed, high-resolution models of landscapes and urban areas, with fine-grained detail that includes the shape of building facades, tree canopies and topographic elevation data [7]. Once the data is collected, it must undergo significant and often complex steps of processing to transform raw datasets into usable 3D models, often requiring the application of specialised algorithms for interpolation and data refinement, particularly when gaps and noise are present in the data. In addition, models must be processed quickly, with a high degree of robustness against voluminous data and simultaneously provide real-time updates, which will be important for the utilisation of dynamic modelling applications in areas such as disaster management, where environmental conditions can rapidly evolve and change. On the other hand, even more responsive and demanding are VR applications, where users desire to interact with that data in real-time and through their senses, and is why data processing workflows need to be optimised for speed and accuracy [8].
3.3 User interaction and interface design
Successful implementation of 3D GIS and VR systems relies heavily on effective user interaction. Both 3D models and VR environments are highly complex and immersive, so impressive results can be diminished by a lack of accessible user interfaces (UI). Making these systems intuitive, particularly for GIS novices, is a key challenge. For 3D GIS and VR to be successful, users need to be able to access, navigate and interact with the vast amounts of computer data provided by the system without extensive training. UI for 3D GIS and VR environments often consists of gesture-based or ‘natural user interfaces’ (NUIs) – systems that can be controlled through natural hand movements. In the case of 3D objects, for example, users can manipulate the object by grabbing and moving it. This is one practical way of interacting with complex 3D forms. Another useful feature is voice commands, which can have immense value, for example, when users are wearing a headset and need to operate the system with hands-free control [9]. In VR environments, voice commands can be a handy alternative to traditional input devices for moving around in a 3D space. Finally, real-time feedback is a vital feature – this allows users to get an instant sense of the effects of their actions on the environment. For example, a user can change the height of a building or rotate a 3D model and see the results immediately. If these key elements of UI are successfully implemented, the resulting 3D GIS and VR systems will be powerful yet user-friendly, enabling a wider group of stakeholders to take advantage of innovative visualisation tools..
4 Practical applications of 3D and VR in GIS
The integration of 3D and VR technologies into GIS is not just a theoretical concept but is already being applied across various industries. This section examines specific case studies where 3D and VR-enhanced GIS has been implemented and discusses the outcomes of these applications.
4.1 Urban planning case studies
City planners can now directly manipulate and explore spatial data in a 3D environment, leaving behind the confines of flat 2D maps. Singapore and New York are pioneers in utilising 3D city models in their urban development projects. Singapore’s Smart Nation initiative is built on a detailed 3D model of the entire city, which is used to simulate urban development, traffic flow and planning. Planners can visualise the effects of urban growth and infrastructure development in a 3D space, allowing them to determine how new developments will fit into a city’s existing landscape. This information can be used to avoid conflicts in land use, such as obstructing significant views and creating traffic bottlenecks. 3D GIS can also be used to calculate building shadows and viewshed, an important concern when planning new neighbourhoods. Detailed 3D models can ensure that developments do not block critical views or generate long shadows that can cause discomfort for neighbours. Virtual reality (VR) takes the urban-planning game to another level, allowing planners and other stakeholders to ‘walk’ through a virtual city. For instance, developers and citizens in New York City donned VR headsets to explore proposed urban development projects [10]. This enables them to experience the scale and feel of the development, which would greatly help to communicate and convey the effects of the project in an intuitive and impactful way. The use of 3D GIS and VR can help to close the gap between planners and the public, increasing the acceptance of urban-development plans among citizens. This, in turn, improves the engagement of communities affected by urban developments and allows planners to incorporate feedback better from a wider range of stakeholders, such as citizens and local businesses.
4.2 Environmental conservation projects
3D GIS and VR technologies have been leveraged for conservation purposes particularly in areas that are experiencing significant ecological challenges. An example comes from one of the most biodiverse regions on our planet: the Amazon rainforest. Conservationists in Brazil have begun using 3D GIS models to track deforestation in the Amazon. Using satellite imagery and LiDAR data, 3D models of the forest have been created and can be viewed over time to capture changes in tree cover and terrain as deforestation occurs. By having this information, policymakers and conservationists can track progress, identify areas of concern, and prioritise conservation efforts where they are needed most. In addition to 3D modelling, VR has been used to create what are called ‘telepresence’ experiences, where users can essentially ‘step into’ an Amazonian rainforest. Donning a VR headset, policymakers, researchers and the public can explore areas that have been deforested to get a sense of how biodiversity has been affected and the extent of environmental degradation. This telepresence experience has been effective in creating greater awareness of environmental issues by immersing users in a digitally reconstructed scene. Virtual tours of the Amazon have been used in educational settings and conservation campaigns to garner public support for reforestation and sustainable land-use practices.
4.3 Disaster response and simulation
Another is disaster management, where 3D GIS and VR technologies are used to prepare for and respond to natural disasters such as earthquakes, tsunamis, floods and hurricanes in areas that are more affected than others. After the 2011 earthquake and tsunami in Japan, the emergency services had to assess the damage to the full landscape and coordinate relief efforts. Traditional 2D maps were useful but offered a limited understanding of the extent of the damage or the complexity of the terrain. 3D GIS models were used by the Japanese authorities to map out what was damaged, the roads and buildings, so that relief teams could plan evacuation routes and target their resources more effectively. The 3D models helped them prioritise areas for rescue, knowing where resources were most needed. This approach has since been replicated in other disaster-prone areas where 3D GIS is now standard for planning and response.
5 Conclusion
The 3D modelling and the VR environments will intensify the power of GIS by making it possible to create richer, more interactive representations of the environment, and by allowing multiple stakeholders to interact with and understand spatial data in new ways. This will have a multiplier effect on the real-world consequences of GIS applications, from urban planning, to the management of disasters, and the monitoring of our natural environments. Stakeholders will be able to ‘walk’ through and interact with geographic information in ways that were not previously possible. Users can now be immersed in realistic virtual worlds, with real-time and interactive access to data, which will result in faster, more accurate and better-informed decision making. Technically, it is still quite challenging to process large datasets in real time with powerful and user-friendly interfaces, but the future looks bright, with steady improvements to hardware and software making the technologies more accessible. The future of GIS will increasingly feature 3D and VR environments. In turn, this will translate to more sustainable, efficient and informed decision making.
Authors’ Contribution
Han Cao and Peiqi Chen have made equally significant contributions to the work and share equal responsibility and accountability for it
References
[1]. Ukoba, M. O., et al. (2023). Geographic information systems (GIS) approach for assessing the biomass energy potential and identification of appropriate biomass conversion technologies in Nigeria. Biomass and Bioenergy, 170, 106726.
[2]. Rahmat, A., et al. (2023). Development Model for Virtual Reality (VR) Tourism in Rural Areas: A GIS-Based Approach. Planning Malaysia, 21.
[3]. Di Grazia, S., & Tina, G. M. (2024). Optimal site selection for floating photovoltaic systems based on Geographic Information Systems (GIS) and Multi-Criteria Decision Analysis (MCDA): a case study. International Journal of Sustainable Energy, 43(1), 2167999.
[4]. Murodilov, Kh. T. (2023). Use of geo-information systems for monitoring and development of the basis of web-maps. Galaxy International Interdisciplinary Research Journal, 11(4), 685–689.
[5]. Kumar, S. M. S., Pandey, M., & Shukla, A. K. (2024). Spatio-temporal analysis of riverbank changes using remote sensing and geographic information system. Physics and Chemistry of the Earth, Parts A/B/C, 136, 103692.
[6]. Ukoba, M. O., et al. (2023). Optimal sites for agricultural and forest residues energy conversion plant using geographic information system. Heliyon, 9(9).
[7]. Kumar, M., et al. (2023). Introduction of Geographic Information System. In Geographic Information Systems in Urban Planning and Management (pp. 3–24). Singapore: Springer Nature Singapore.
[8]. Verykokou, S., & Ioannidis, C. (2023). An overview on image-based and scanner-based 3D modeling technologies. Sensors, 23(2), 596.
[9]. Deitke, M., et al. (2023). Objaverse: A universe of annotated 3d objects. In Proceedings of the IEEE/CVF Conference on Computer Vision and Pattern Recognition.
[10]. Reichert, M., et al. (2023). Magnetorotational supernovae: a nucleosynthetic analysis of sophisticated 3D models. Monthly Notices of the Royal Astronomical Society, 518(1), 1557–1583.
Cite this article
Cao,H.;Chen,P. (2024). Enhancing decision-making through geographic information visualization: Integrating 3D modeling and virtual reality for intuitive spatial data representation. Advances in Engineering Innovation,12,36-40.
Data availability
The datasets used and/or analyzed during the current study will be available from the authors upon reasonable request.
Disclaimer/Publisher's Note
The statements, opinions and data contained in all publications are solely those of the individual author(s) and contributor(s) and not of EWA Publishing and/or the editor(s). EWA Publishing and/or the editor(s) disclaim responsibility for any injury to people or property resulting from any ideas, methods, instructions or products referred to in the content.
About volume
Journal:Advances in Engineering Innovation
© 2024 by the author(s). Licensee EWA Publishing, Oxford, UK. This article is an open access article distributed under the terms and
conditions of the Creative Commons Attribution (CC BY) license. Authors who
publish this series agree to the following terms:
1. Authors retain copyright and grant the series right of first publication with the work simultaneously licensed under a Creative Commons
Attribution License that allows others to share the work with an acknowledgment of the work's authorship and initial publication in this
series.
2. Authors are able to enter into separate, additional contractual arrangements for the non-exclusive distribution of the series's published
version of the work (e.g., post it to an institutional repository or publish it in a book), with an acknowledgment of its initial
publication in this series.
3. Authors are permitted and encouraged to post their work online (e.g., in institutional repositories or on their website) prior to and
during the submission process, as it can lead to productive exchanges, as well as earlier and greater citation of published work (See
Open access policy for details).
References
[1]. Ukoba, M. O., et al. (2023). Geographic information systems (GIS) approach for assessing the biomass energy potential and identification of appropriate biomass conversion technologies in Nigeria. Biomass and Bioenergy, 170, 106726.
[2]. Rahmat, A., et al. (2023). Development Model for Virtual Reality (VR) Tourism in Rural Areas: A GIS-Based Approach. Planning Malaysia, 21.
[3]. Di Grazia, S., & Tina, G. M. (2024). Optimal site selection for floating photovoltaic systems based on Geographic Information Systems (GIS) and Multi-Criteria Decision Analysis (MCDA): a case study. International Journal of Sustainable Energy, 43(1), 2167999.
[4]. Murodilov, Kh. T. (2023). Use of geo-information systems for monitoring and development of the basis of web-maps. Galaxy International Interdisciplinary Research Journal, 11(4), 685–689.
[5]. Kumar, S. M. S., Pandey, M., & Shukla, A. K. (2024). Spatio-temporal analysis of riverbank changes using remote sensing and geographic information system. Physics and Chemistry of the Earth, Parts A/B/C, 136, 103692.
[6]. Ukoba, M. O., et al. (2023). Optimal sites for agricultural and forest residues energy conversion plant using geographic information system. Heliyon, 9(9).
[7]. Kumar, M., et al. (2023). Introduction of Geographic Information System. In Geographic Information Systems in Urban Planning and Management (pp. 3–24). Singapore: Springer Nature Singapore.
[8]. Verykokou, S., & Ioannidis, C. (2023). An overview on image-based and scanner-based 3D modeling technologies. Sensors, 23(2), 596.
[9]. Deitke, M., et al. (2023). Objaverse: A universe of annotated 3d objects. In Proceedings of the IEEE/CVF Conference on Computer Vision and Pattern Recognition.
[10]. Reichert, M., et al. (2023). Magnetorotational supernovae: a nucleosynthetic analysis of sophisticated 3D models. Monthly Notices of the Royal Astronomical Society, 518(1), 1557–1583.