


1. Introduction
"Can we achieve a situation where essentially every material can be recycled and reused?" was listed as one of the world's top 125 cutting-edge scientific questions by the journal Science. This highlights the recycling and transformation of waste materials into valuable products as a focal point of modern scientific research. Biomass pyrolysis technology has emerged as a promising solution for the treatment of agricultural waste, which is a vast and underutilized resource all around the world [1]. It not only addresses waste management challenges but also converts biomass into valuable products such as biochar, wood vinegar (WV), and pyrolysis gas. Among the products derived from biomass pyrolysis, WV has garnered significant attention due to its wide range of applications in agriculture, medicine, and environmental protection [2]. Its strong bioactivity and biocompatibility contribute significantly to its natural antioxidant and antimicrobial properties [3].
WV is an acidic liquid ranging from light brown to tea brown in color, characterized by a distinct smoky aroma. Comprising over 200 organic components including acids, alcohols, phenols, aldehydes, ketones, and more, its organic content typically ranges from 7% to 15% [4]. However, the relatively low concentration of organic compounds in crude WV poses considerable challenges for downstream product development and commercialization. Its marketing faces daunting hurdles, and its utilization poses potential risks of environmental and groundwater contamination. The key to enhancing its commercial viability and sustainability lies in purifying and concentrating crude WV, elevating its organic content. Techniques like distillation [5], and membrane separation [6] are being investigated to obtain concentrated and purified forms of WV, unlocking its full potential for numerous beneficial uses. However, the traditional methods of concentration or purifying crude WV are still hindered by severe technical drawbacks in practical application. For example, evaporation concentration might lead to changes in the active components within WV during the heating process, compromising the natural state of substances and adversely affecting downstream product utilization. Additionally, membrane separation technologies such as ultrafiltration (UF) and reverse osmosis (RO) are not suitable for concentrating acetic acid in WV, which has a relatively small molecular weight.
Among the various concentration methods available, freeze concentration has shown its competence in concentrating juices, wines, apple vinegar, coffee extracts, milk, and other thermosensitive materials [7], along with its applications in seawater desalination [8] and wastewater treatment [9]. Because the heat of fusion of water is one-seventh that of vaporization, compared to the evaporation concentration process, freeze concentration has lower energy consumption and produces less CO2 emissions [10]. Although numerous research studies have confirmed the extensive prospects of freeze concentration as a separation technique aligned with sustainable development principle, some common issues still restrict its widespread industrial application.
Firstly, the industrial crystallization process of freeze concentration commonly occurs in stirred-tank crystallizers. Although this method is straightforward to operate, the mechanical agitation in stirred-tank crystallizers results in significant crystal breakage and high secondary nucleation rates. Consequently, this leads to substantial mother liquor entrainment, elevated material loss in concentrated substances. In this regard, fluidization technology was introduced to the crystallization process, allowing crystal particles to grow in suspension within the fluidized bed [11]. This helps to avoid the breakage of crystals by stirring blades, reduce the secondary nucleation rate of the system, and decrease the entrapment in the crystals [12]. Nevertheless, prior research has been limited to conventional fluidization processes characterized by vigorous turbulence and strong inter-particle collisions within the bed, and consequently, concentration effect still remains relatively low. At the same time, the low separation efficiency caused by the entrapment of solutes by ice crystals during the crystallization process is a common issue in freeze concentration. The essence of the impurity entrapment phenomenon is the competitive deposition of solutes and crystallization target substances on the solidification micro-interface. During the solute redistribution in the freeze crystallization process, the concentration polarization of impurities on the liquid side of the crystallization micro-interface is the primary cause of solute adsorption onto the lattice or surface of growing ice crystals, thereby forming the impurity entrapment phenomenon. Therefore, enhancing the mass transfer process at the liquid-solid micro-interface through specific means and alleviating the concentration polarization of solutes on the liquid side is the fundamental approach to suppressing the entrapment of solutes by ice crystals. Enhancing mass and heat transfer processes through mechanical action is one of the important directions in the development of chemical process equipment. For example, the three-dimensional swirling flow field in a hydrocyclone can impart high-speed self-rotation to microbubbles, microdroplets, and microsolid particles, thereby inducing alternating centrifugal forces and causing periodic deforming of their micro-interfaces. This has been proven to be beneficial for the enhancement of mass transfer, heat transfer, and chemical reactions on the micro-interface. The application of hydrocyclone separators is no longer limited to traditional non-homogeneous separation but has been widely extended to various fields of chemical process intensification, such as activated sludge activation [13], spent catalyst treatment [14], soil remediation [15], and carbon dioxide absorption [16].
Meanwhile, solute partition during the crystallization process of freeze concentration involves intricate phenomena such as ice crystal micro-interfaces, interfacial mass transfer, and heat transfer, making it challenging to quantitatively describe using classical crystallization theories. The turbulence of the solution, the refrigerant temperature, the quantity of seed crystals, and several other factors intricately influence the heat and mass transfer during the nucleation and maturation of crystal nuclei and the partition behavior of solute. Consequently, they exert direct influence on the performance of freeze concentration. Therefore, ice crystal growth and solute partition in freeze concentration are highly complex processes influenced by multiple factors, making it difficult to accurately describe crystallization kinetics with a simple linear equation. In conventional crystallization kinetics, parameters like growth rates are frequently entirely empirical, demanding analysis and regression of extensive experimental data. Regressing these purely empirical models can yield substantial errors, occasionally failing to converge. Hence, employing these empirically derived crystallization kinetics to forecast and manage crystal growth and nucleation rates may result in notable deviations. On the other hand, Artificial neural networks (ANNs), a machine learning technique that mimics the biological neural procedures constituting animal brains, demonstrate highly nonlinear and comprehensive effects [17]. Rather than simply adding up the effects of these factors, ANNs facilitate a nonlinear mapping from input to output states, and vividly depict the interplay and mutual constraints among various influencing factors. Specifically, the backpropagation neural network (BPNN) refines the model by adjusting weights and thresholds through error backpropagation, continuously improving its accuracy [18]. Using this approach to delineate the complex interrelationships between influencing factors in the growth kinetics of ice crystals would yield a more reasoned and precise framework.
In this study, the challenges associated with the concentration of WV are addressed through the application of innovative freeze concentration technique. Given the limitations of traditional methods, such as evaporation and membrane separation, the potential of freeze concentration enhanced by fluidization technology and hydrocyclone-induced swirling flow fields is explored to improve mass transfer and reduce solute entrapment. Additionally, the complex crystallization kinetics of freeze concentration are investigated using ANNs to better understand and predict the behavior of ice crystal growth and solute partition. By integrating these advanced approaches, the commercial viability and sustainability of WV are enhanced, contributing to the broader goal of recycling and transforming waste materials into valuable products.
2. Material and methods
2.1. Swirling fluidized crystallizer
The hydrocyclone separator is a general-purpose device that achieves heterogeneous separation by utilizing the difference in centrifugal forces experienced by two-phase or multiphase substances in a swirling flow field. Previous research has confirmed that when microbubbles, microdroplets, and microsolid particles in the three-dimensional swirling flow field inside a hydrocyclone separator, not only undergo a revolution around the central axis of the cyclone driven by the rotating fluid, but also experience a high-speed self-rotation around their own axis due to the influence of the fluid’s non-equilibrium torque [19]. The direction of this self-rotation is opposite to that of the revolution, and the self-rotation speed is significantly greater than the revolution speed. In a hydrocyclone with a cylinder diameter of 75 mm, the self-rotation speed of the particles can reach up to 2000~6000 rad/s [19]. Hence, microparticles within a swirling flow field are subjected to the combined effects of rotational centrifugal force and orbital centrifugal force. The magnitude and direction of the coupled centrifugal forces vary depending on the particle's position within the swirling flow field. Under the continuously changing coupled centrifugal forces, the micro-interfaces between deformable microparticles and the continuous phase fluid will undergo regular deformation.
Based on the phenomenon where microparticles in a swirling flow field undergo micro-interface deformation induced by periodically varying coupled centrifugal forces, the three-dimensional swirling flow field of a hydrocyclone separator was introduced into the fluidized crystallization process and turned it into a swirling fluidized crystallizer. This allows ice crystals to grow while undergoing spiral motion in the swirling flow field, as illustrated in Figure 1.
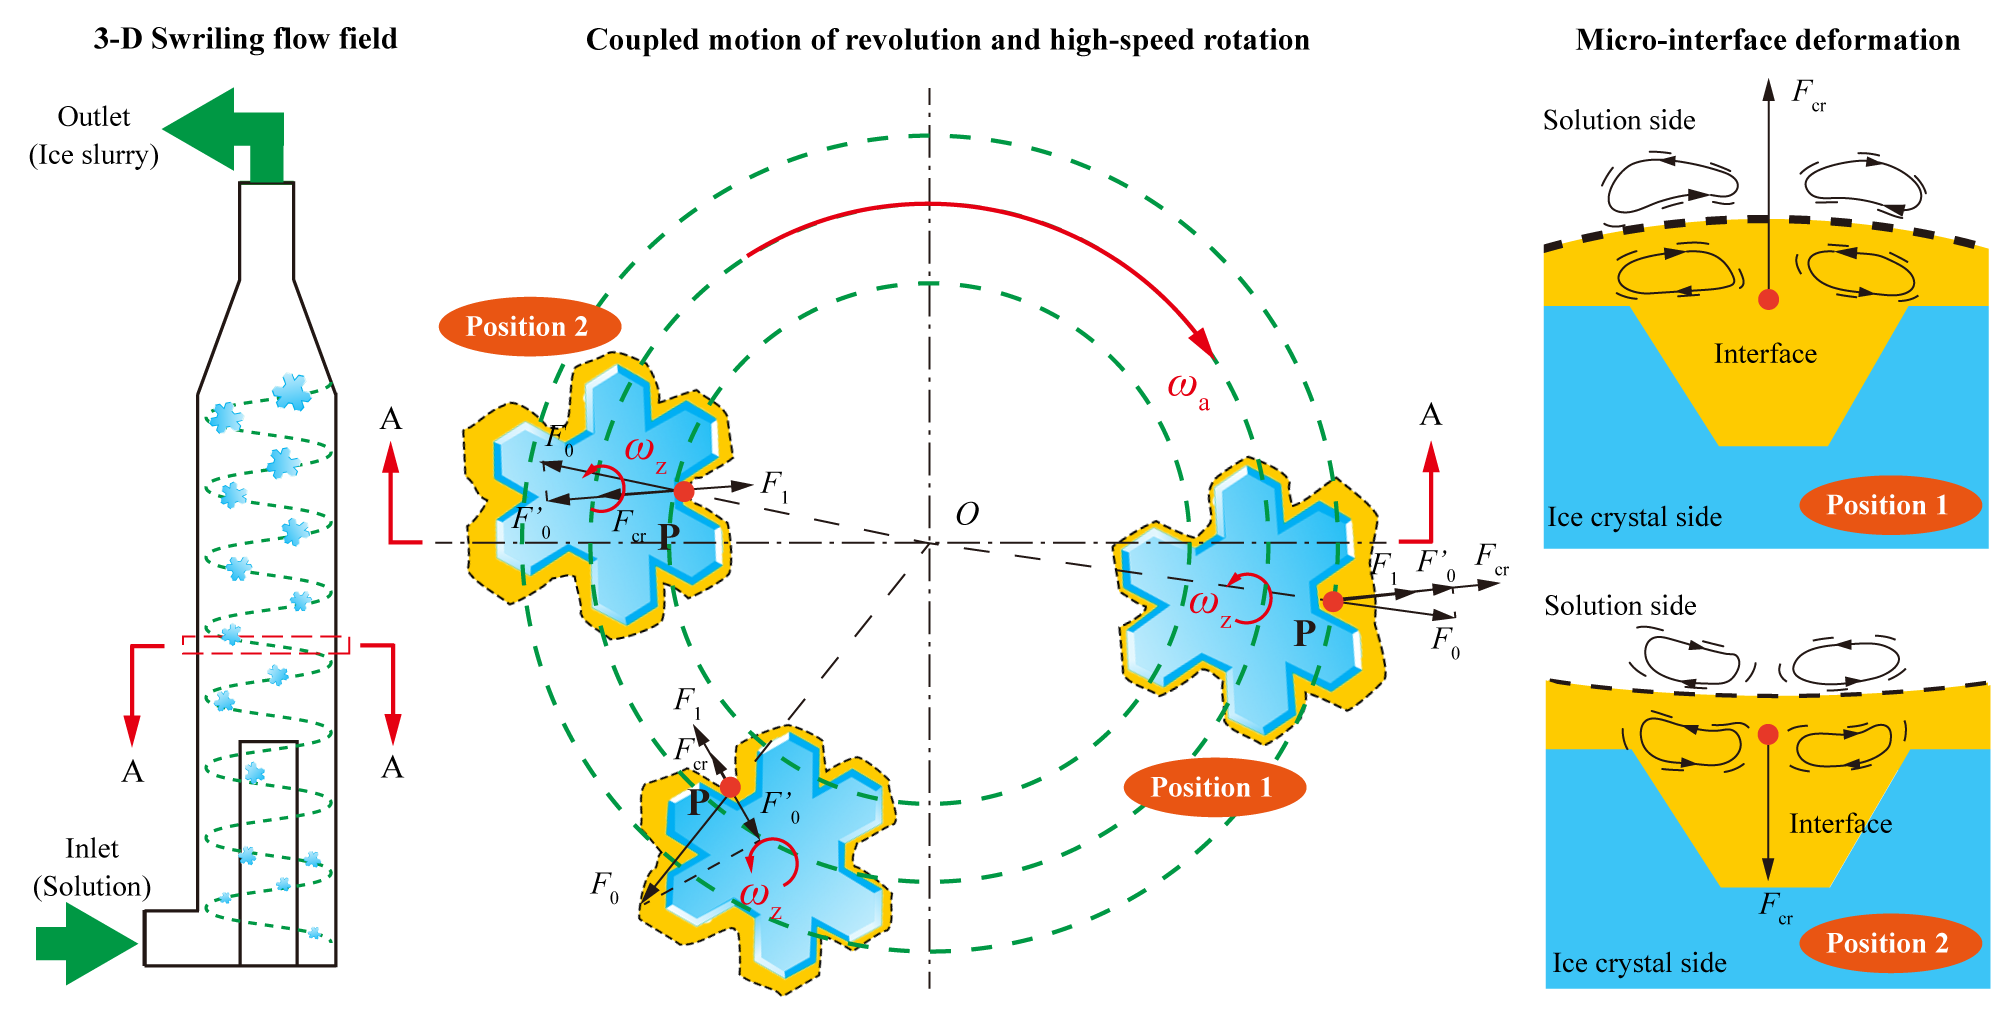
Figure 1. Principle of freeze concentration in a swirling fluidized crystallizer
In the swirling flow field, ice crystal particles revolve around the free vortex center (point O) of the swirling fluidized crystallizer with an angular velocity ωa, while simultaneously, under the influence of the velocity gradient in the swirling flow field, the ice crystal particles rotate around their own axis with an angular velocity ωz. When an ice crystal particle is at position 1, point P on the solid-liquid micro-interface of the ice crystal, facing the outer side of the orbital path, is simultaneously subjected to the orbital centrifugal force F1 and the rotational centrifugal force F0 caused by the ice crystal's revolution and self-rotation. The radial component of the combined centrifugal forces, resulting from both rotation and revolution, is Fcr. As the ice crystal particle moves from position 1 to position 2 due to its revolution, point P shifts to the inner side of the orbital path as a result of the ice crystal's rotation, causing the direction of the radial component of the combined centrifugal force Fcr acting on point P to change accordingly. Ice crystal particles in the swirling flow field continuously alternate between positions 1 and 2, meaning the freezing micro-interface is subject to a periodically changing combined force Fcr in both direction and magnitude. The coupled self-rotation and revolution of the ice crystal particle cause changes in the direction of the forces acting on the solid-liquid micro-interface. In response, the interface deforms to minimize surface energy, adjusting to the changing forces. This deformation induces disturbances in the boundary layer of the fluid, promoting interface renewal, reducing the localized concentration increases typically seen during the crystallization process, and facilitating mass and heat transfer.
2.2. Experimental setup and process
The swirling fluidized crystallizer used in this study was adapted from a hydrocyclone usually used as a liquid-solid separator, and the structure and dimensions are presented in Figure 2. The modifications included changes to the cone segment, cone angle, overflow tube, and related components. The extension of column part and overflow tube, along with the transformation of the overflow tube into a solid core column structure, aimed to enhance the residence time of the crystalline within the crystallizer. The hydrocyclone was placed upside down to achieve this objective as well. Furthermore, a horizontal tangent feed inlet was introduced at the bottom of the crystallizer, featuring a singular top outlet. An external refrigeration jacket was also added to the crystallizer.
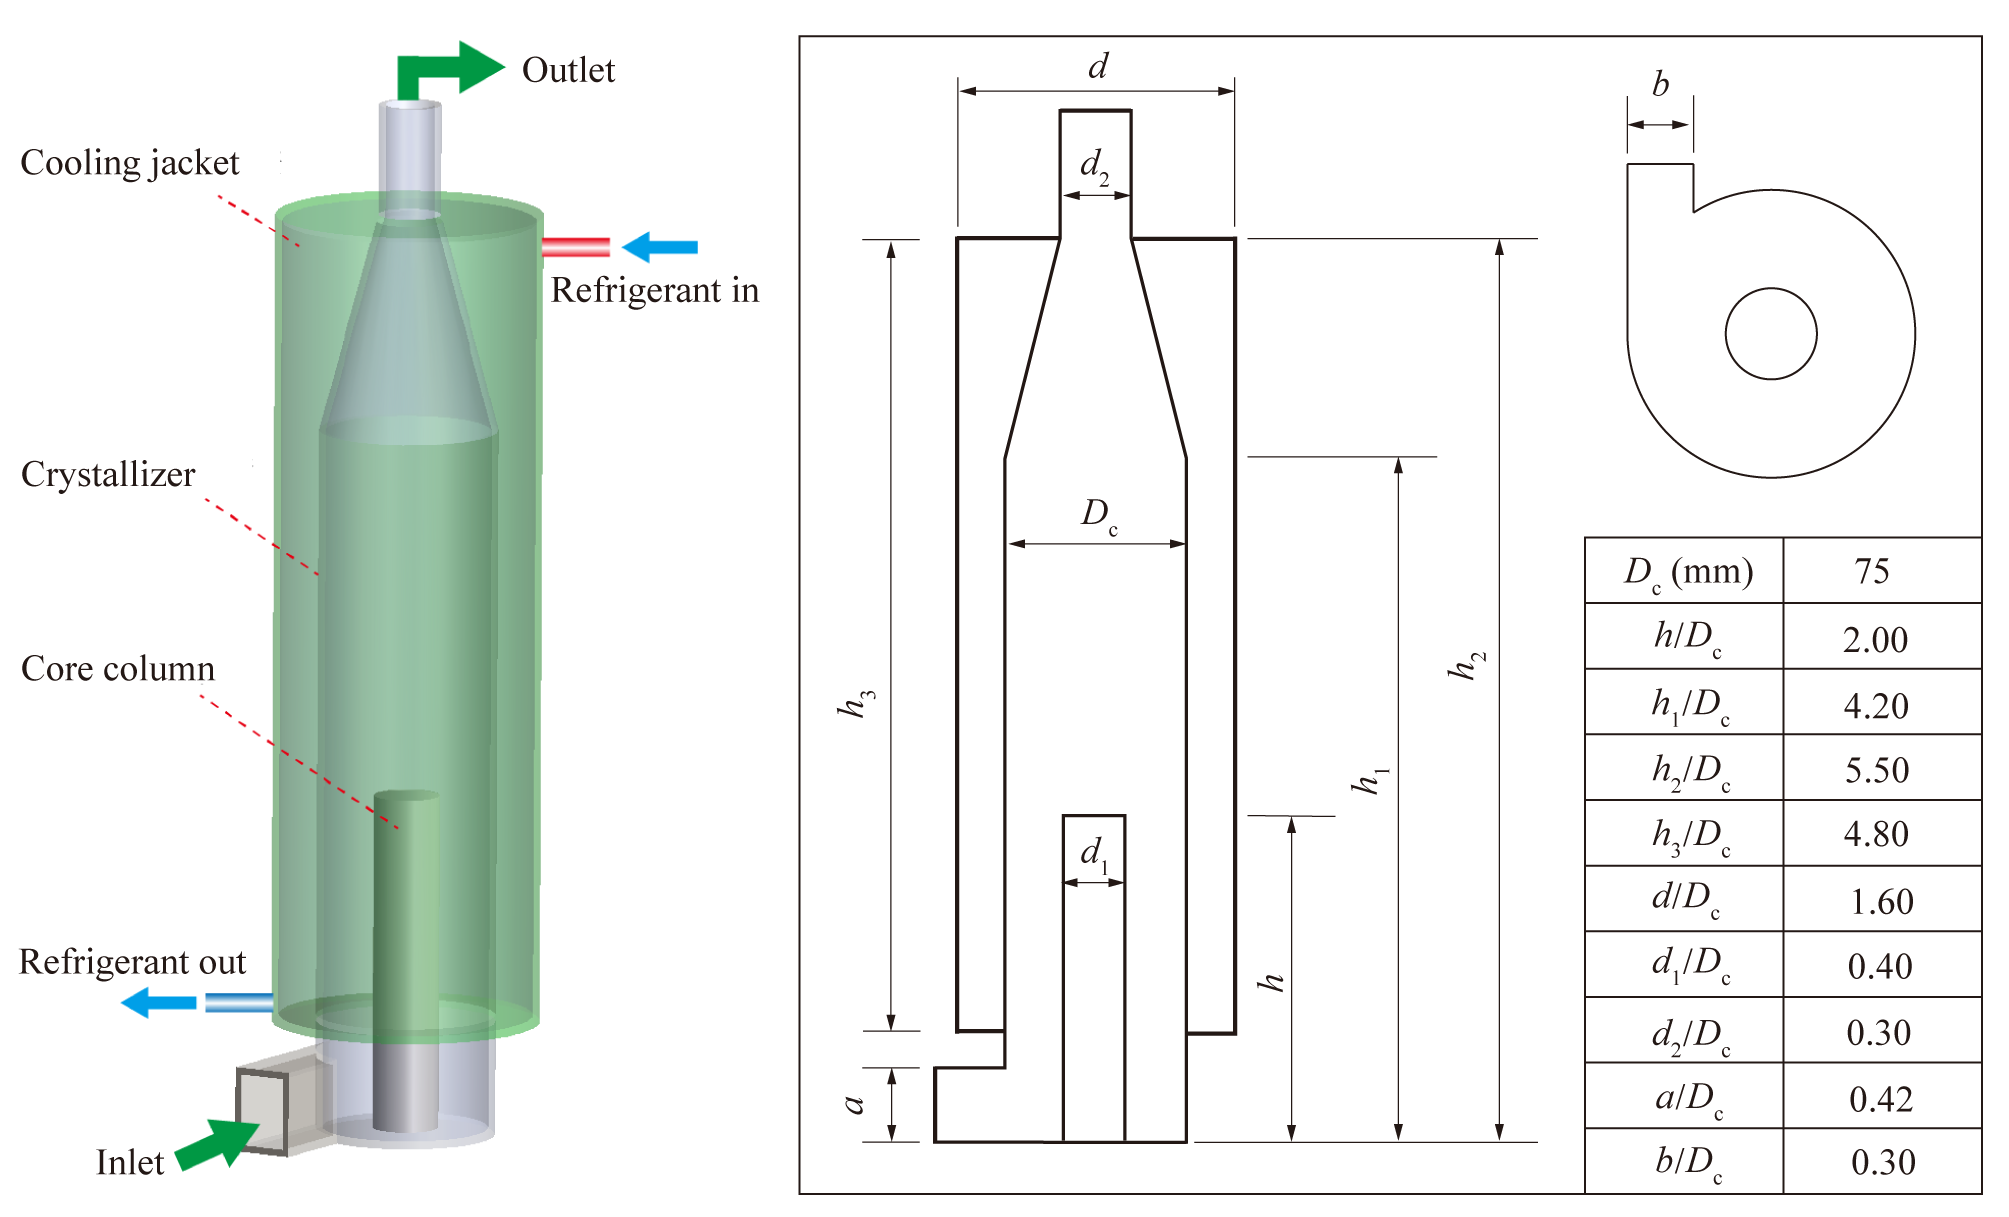
Figure 2. Structure and dimensions of swirling fluidized crystallizer
As shown in Figure 3, the device used to carry out WV freeze concentration is a cryogenic apparatus, which mainly includes a cooling unit, a swirling fluidized crystallizer, and a buffer vessel. During the experiment, the cooling unit first cools the refrigerant (99% ethanol). WV sample is extracted from the buffer tank using a circulation pump and enters the crystallizer through the feed inlet at the bottom at a controlled flow rate. Inside the crystallizer, the liquid flows upward in a rotating motion and returns to the buffer tank after exiting from the top of the crystallizer. In this process, the refrigerant cools the WV through a cooling jacket surrounding the crystallizer. Once the WV temperature reaches the set point, a certain amount of seed ice crystals are added to the solution to induce nucleation and allow the crystals to gradually grow. When the ice crystals grow to a certain size, a metal mesh and filter cloth placed in the buffer tank are used to filter the ice crystals from the solution, preventing them from re-entering the circulation loop and thereby achieving the initial separation of the ice crystals and the concentrated liquid. A centrifuge, placed in a temperature-controlled refrigerator, is then used to further separate the remaining liquid from the ice crystals. Samples of the melted ice water and concentrated solution are taken, and the concentration of organic acids (calculated as acetic acid) is determined by titration.
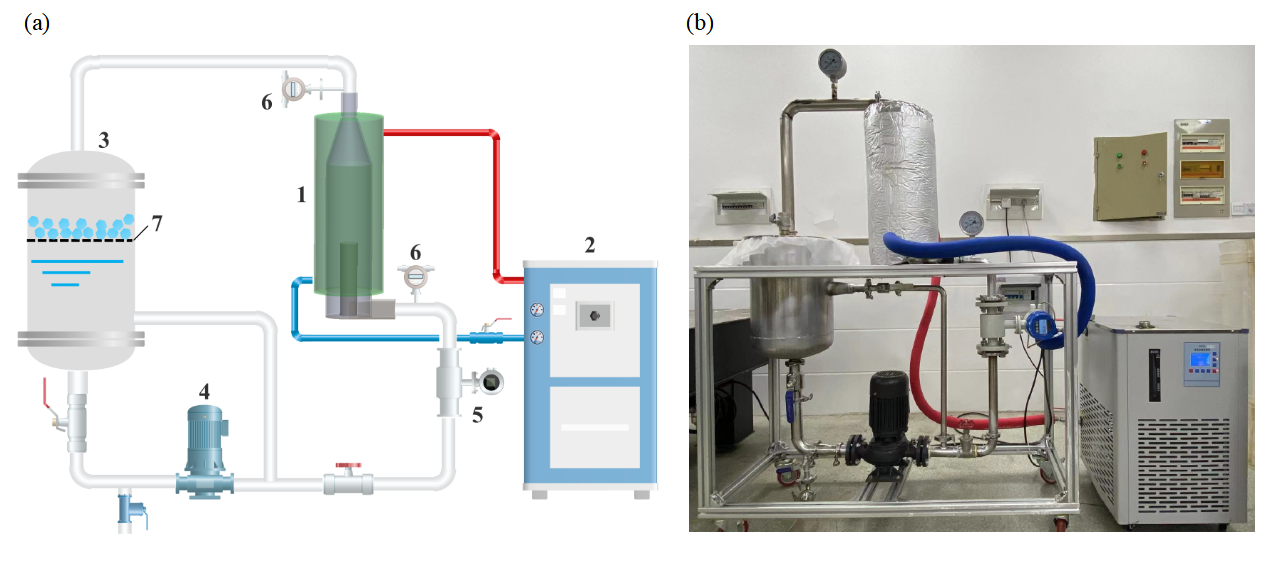
Figure 3. Experimental setup: (a) schematic representation of experimental flow; (b) device photo in the laboratory (1-swirling fluidized crystallizer; 2-refrigerator; 3-buffer vessel; 4-circulating pump; 5-flowmeter; 6-digital thermometer; 7-metal mesh and filter cloth)
2.3. Experimental materials
Crude WV was collected from a pilot-scale biomass pyrolysis and hydrodeoxygenation unit (Puyang, Henan Province, China), in which corn straw and stalk was pyrolyzed and liquefied in an oxygen-depleted reactor. In the process of pyrolysis, biomass is rapidly heated and vaporizes in the absence of air, and quickly condense to liquid product. The collected liquid product is considered as the mixture of bio-oil and crude wood vinegar. The liquid product was stood for several hours until a distinct boundary between the aqueous and oil phases appeared. The aqueous phase was separated and then mixed with charcoal powders with a charcoal-liquid ratio of 5% (w/w). The mixtures were stirred for 10 min and then stood for 24 h to ensure the removal of the bio-oil residues. The upper clear liquid was decanted carefully and the remaining liquid was filtrated to remove solids. Then the wood vinegar sample was obtained and stored at 4 °C until further used in the experiments. The analysis of the organic matters contained in the WV samples were carried out using gas chromatography and mass spectrometry (GC-MS, Agilent 7890A-5975C, America). The relative content of the main organic compounds contained in the crude WV sample are listed in Table 1.
Table 1. Main organic components contained in the WV sample
Organic compounds | Relative content % |
Acids | 22.51 |
Phenols | 18.75 |
Ketones | 16.45 |
Alcohols | 4.53 |
Aldehydes | 9.68 |
Esters | 6.74 |
2.4. Evaluation method
The effective partition coefficient (K) is the most important parameter to evaluate the freeze concentration process. The value of K changes between 0 and 1, where K=0 means that solutes in the solution is completely concentrated as there is no substance in the melted ice water, while K=1 means the freeze crystallization has no effect on WV concentration, since the solute concentrations in the ice and liquid phases are the same. Therefore, performance of concentration by freeze crystallization can be evaluated by the value of K in terms of organic acid (calculated as acetic acid). For the smaller value of K, the greater is the effectiveness of concentration thus purer water separated from WV. The value of K can be calculated by Eq. (1):
\( K=1-\frac{log{\frac{{C_{i}}}{{C_{L}}}}}{log{\frac{{V_{L}}}{{V_{i}}}}} \) (1)
where Vi and Ci, respectively, are the volume and the organic acid content of the WV sample before freeze concentration, and VL and CL, respectively, are the volume and the acetic acid content of the concentrated WV sample.
2.5. Experiment design based on Box-Behnken
According to the literature, the performance of freeze concentration is influenced by multiple factors. The partition behavior of soluble solutes between the solid and liquid phases during crystallization is affected by coolant temperature, turbulence of the solution, and freezing time among others. The coolant temperature directly impacts the crystallization process, with lower temperatures accelerating crystallization but potentially compromising crystal quality due to rapid growth. The turbulence of the solution, which can be influenced by the flow velocity in the crystallizer, affects the distribution of solutes and the formation of crystal nuclei. While a faster flow velocity can prevent crystal nuclei from depositing on the wall of crystallizer and maintain the heat transfer rate, higher flow velocities can dislodge particles from growing crystals, increasing the secondary nucleation rate and affecting concentration efficiency. The freezing time is critical, as insufficient time may result in incomplete crystallization, whereas excessive time can lead to severe solute deposit and entrapment. Additionally, the number and quality of seed crystals significantly influence the crystallization process, with an appropriate amount enhancing efficiency, while an excessive number may lead to smaller crystal sizes, negatively impacting solute partitioning process.
Given that freeze concentration is a complex process influenced by multiple factors, in the present study, response surface methodology (RSM) was adopted for the experimental design. Freezing temperature, flow velocity, freezing time and ice crystal seeds amount were considered as the independent variables while effective partition coefficient was the dependent variable, and the three levels of independent variables are presented in Table 2 based on Box-Behnken experiment design.
Table 2. Code and range of experimental variables based on Box-Behnken design
Independent Variables | Code and Range | ||
-1 | 0 | 1 | |
Freezing temperature, T (°C) | -20 | -25 | -30 |
Flow velocity, v (m/s) | 0.5 | 1.0 | 1.5 |
Freezing time, t (min) | 60 | 90 | 120 |
Seed ice amount, m (g) | 10 | 20 | 30 |
2.6. BPNN model
Artificial neural networks (ANNs) are computational models designed to emulate the structure and function of biological neural networks found within animal brains. As depicted in Figure 4, the architecture of an ANN is composed of an input layer, followed by one or more hidden layers, culminating in an output layer. These hidden layers are instrumental in enabling ANNs to discern complex relationships between input and target variables without presupposing any specific knowledge of the underlying mechanisms of the problem at hand. Each stratum of the network is populated with interconnected processing units, known as neurons, which facilitate the computation and learning processes. Backpropagation neural network (BPNN) was employed for this study, which has been widely used to investigate various problems in engineering. BPNNs are characterized by their ability to learn complex mappings between inputs and outputs through backpropagation of errors and they are particularly adept at capturing non-linear relationships within data.
In the BPNN model, W represents the connection weights of the network, and b represents the biases. The subscripts respectively denote the neurons in the input layer, hidden layer, and output layer. The influence of input variables on output variables can be assessed based on the connection weights between the network neurons. The effectiveness of the neural network model for the freeze concentration of WV in the swirling fluidized crystallizer can be evaluated based on the model's mean squared error (MSE) and correlation coefficient (R). The smaller the MSE value and the closer R is to 1, the better the reliability of the network model and the more accurate its predictive power.
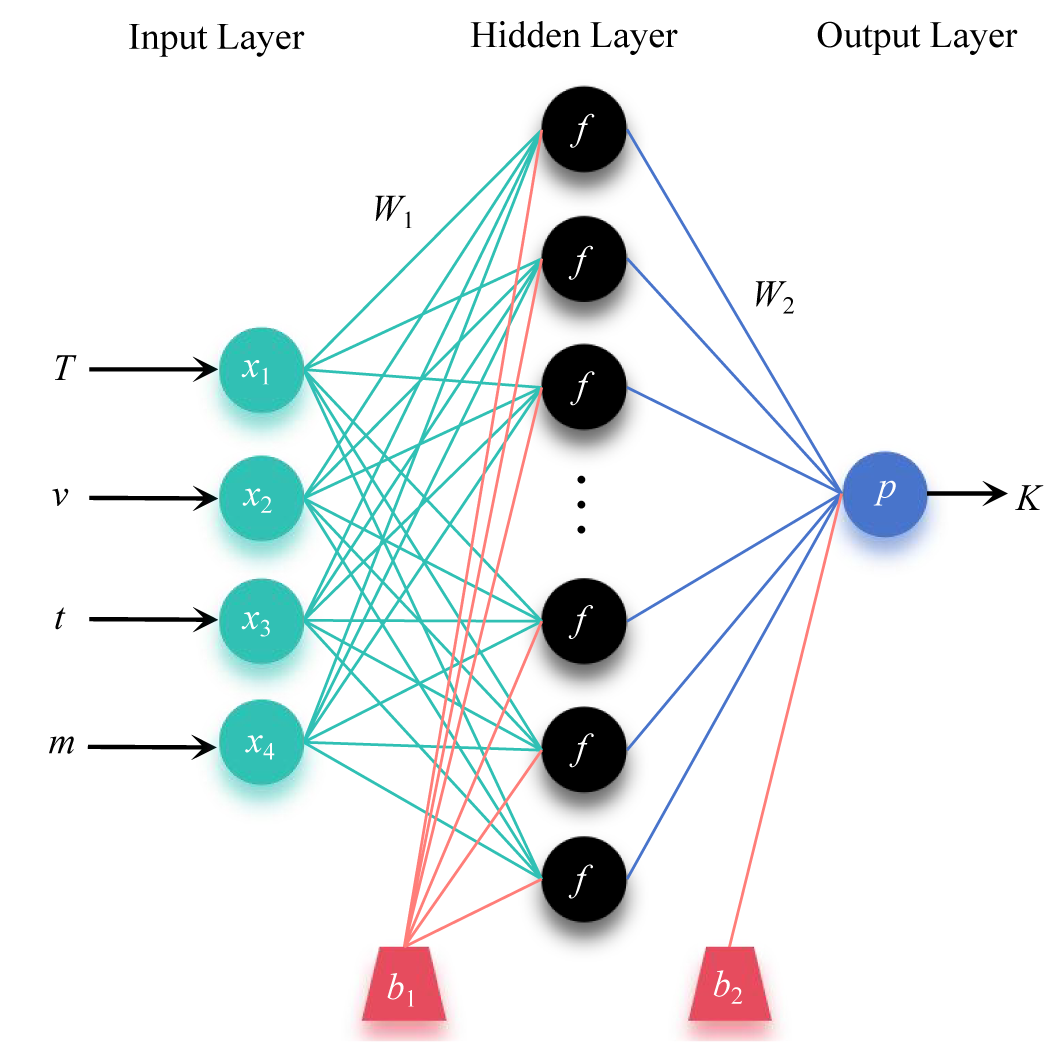
Figure 4. Topological structure of the BPNN model
Based on the Box-Behnken design experiment, a three-layer BPNN model is established, with freezing temperature, circulation flow rate, crystallization time, and seed ice amount as the four input parameters of the network, and the effective distribution coefficient K as the output target parameter. The sigmoid function is chosen as the inner propagation function. Through multiple training sessions, the number of neurons in the hidden layer, that is, the structure of the BPNN, as well as the optimal weights and biases, are determined when the error between the effective distribution coefficient K and the experimental values is sufficiently small.
3. Results and discussions
3.1. Centrifugal force model of particle in a swirling flow field
In order to demonstrate the continuously changing coupled centrifugal forces acting on the micro-interface of ice crystal particles in the swirling fluidized crystallizer, a theoretical force analysis of a non-inertial particle in a two-dimensional shear flow field was carried out.
Figure 5. Centrifugal force model of particle in a swirling flow field
As shown in Figure 5, an analytical model of the force conditions on particles in a two-dimensional rotating flow field is established, and double orthogonal coordinate systems (x, y) and (x1, y1) are set up with points O and O1, respectively. The coordinates of the particle's center O1 are set as (m, n). In the model, r represents the distance from any mass point inside the particle to point O; r0 represents the distance from the particle's center O1 to point O (i.e., the particle's orbital radius); r1 represents the distance from any mass point inside the particle to point O1; ωa represents the particle's orbital velocity; ωz represents the particle's spin velocity; F0 represents the centrifugal force experienced by the mass point due to orbital motion; F1 represents the centrifugal force experienced by the mass point due to rotation; Fc represents the coupled centrifugal force experienced by the mass point. Since the size of the free vortex in the hydrocyclone is much larger than the size of the particle, it is reasonable to assume that the direction of the centrifugal force due to orbital motion is consistent with the line connecting the particle's center O1 and the center of the free vortex O.
From the analytical model, it can be derived that the centrifugal acceleration of any mass point in the particle due to its orbital motion is:
\( {\vec{a}_{0}}=(m+{x_{1}})ω_{a}^{2}\vec{i}+(n+{y_{1}})ω_{a}^{2}\vec{j} \) (2)
The centrifugal acceleration of any mass point in the particle due to its rotation is:
\( {\vec{a}_{1}}={x_{1}}ω_{z}^{2}\vec{i}+{y_{1}}ω_{z}^{2}\vec{j} \) (3)
The coupled centrifugal acceleration is:
\( {\vec{a}_{c}}=[(m+{x_{1}})ω_{a}^{2}+{x_{1}}ω_{z}^{2}]\vec{i}+[(n+{y_{1}})ω_{a}^{2}+{y_{1}}ω_{z}^{2}]\vec{j} \) (4)
The coupled centrifugal force per unit mass of the particle is:
\( {\vec{F}_{c}}=ρ[(m+{x_{1}})ω_{a}^{2}+{x_{1}}ω_{z}^{2}]\vec{i}+ρ[(n+{y_{1}})ω_{a}^{2}+{y_{1}}ω_{z}^{2}]\vec{j} \) (5)
The tangential component of the coupled centrifugal force per mass volume of the particle is:
\( {F_{ct}}=-ρ[(m+{x_{1}})ω_{a}^{2}+{x_{1}}ω_{z}^{2}]sin{{θ_{1}}}+ρ[(n+{y_{1}})ω_{a}^{2}+{y_{1}}ω_{z}^{2}]cos{{θ_{1}}} \) (6)
The radial component of the coupled centrifugal force experienced is:
\( {F_{cr}}=ρ[(m+{x_{1}})ω_{a}^{2}+{x_{1}}ω_{z}^{2}]cos{{θ_{1}}}+ρ[(n+{y_{1}})ω_{a}^{2}+{y_{1}}ω_{z}^{2}]sin{{θ_{1}}} \) (7)
In cylindrical coordinates, the expressions for the tangential (Fct) and radial (Fcr) components of the coupled centrifugal force as functions of time are respectively:
\( {F_{ct}}=-ρ[({r_{0}}cos{({ω_{a}}t)}+{r_{1}}cos{({ω_{z}}t)})ω_{a}^{2}+{r_{1}}cos{({ω_{z}}t)}ω_{z}^{2}]sin{({ω_{z}}t)} \) \( +ρ[({r_{0}}sin{({ω_{a}}t)}+{r_{1}}sin{({ω_{z}}t)})ω_{a}^{2}+{r_{1}}sin{({ω_{z}}t)}ω_{z}^{2}]cos{({ω_{z}}t)} \) | (8) |
\( {F_{cr}}=ρ[({r_{0}}cos{({ω_{a}}t)}+{r_{1}}cos{({ω_{z}}t)})ω_{a}^{2}+{r_{1}}cos{({ω_{z}}t)}ω_{z}^{2}]cos{({ω_{z}}t)}+ \) \( ρ[({r_{0}}sin{({ω_{a}}t)}+{r_{1}}sin{({ω_{z}}t)})ω_{a}^{2}+{r_{1}}sin{({ω_{z}}t)}ω_{z}^{2}]sin{({ω_{z}}t)} \) | (9) |
A specific force analysis is conducted using the points P1 and P2 within the particle, where P1 is located at the interface between the particle and the continuous phase, P2 is a random point inside the particle. The radial component of the coupled centrifugal force acting on P1 and P2 varies with the position of the particle and time, as shown in Figure 6, where M stands for a constant.
Figure 6. Results of force analysis of the particle in the swirling flow field: (a) variation of the radial component of the coupling centrifugal force at different self-rotation angles and particle positions; (b) variation of the radial component of the coupling centrifugal force on P1 and P2 with time
From Figure 6(a), it can be seen that when the self-rotation angle θ1 of the particle varies, the magnitude and direction of the radial component of the coupled centrifugal force acting on the point are constantly changing, and they increase with the increase of the distance between the point and the center of the particle. From Figure 6(b), it can be observed that the radial component of the coupled centrifugal force acting on the particle exhibits a periodic variation over time, with a period of 2π/ωz. When the direction of Fcr is positive, that is, pointing radially outward towards the particle, the point is in a state of being stretched. When the direction of Fcr is negative, that is, pointing radially inward towards the center of the particle, the point is in a state of being compressed. It can be considered that in order to balance the forces and achieve a state of minimum surface energy for the particle, the micro-interface will undergo certain deformations to adapt to the changes in the forces acting upon it. Since the direction of the forces is periodically changing, the deformation of the micro-interface will also be periodic.
In summary, within the swirling flow field, microparticles experience both rotational and orbital motions. As a result, they are simultaneously subjected to the effects of rotational centrifugal force and orbital centrifugal force. The magnitude and direction of the coupled centrifugal force vary periodically with the position of the microparticles within the rotating flow field, with a period of 2π/ωz. The periodic variation in the magnitude and direction of the coupled centrifugal force causes the micro-interface between the microparticles and the continuous phase to undergo periodic deformation. In terms of the ice crystallization in freeze concentration, this interaction between the self-rotation and revolution of ice crystal particles could leads to fluctuations in the direction of forces exerted on the solid-liquid micro-interface. Consequently, the interface undergoes deformation to minimize the surface energy, adapting to these directional changes in forces. This adaptive deformation generates perturbations within the fluid boundary layer, which enhances interface renewal. It also mitigates the concentration polarization that commonly occur during crystallization, thereby improving mass and heat transfer efficiency during freeze concentration, thus improving the concentration effect.
3.2. Development and optimization of BPNN model
Based on the one-factor-at-a-time experiments, the experimental design for WV freeze concentration in the swirling fluidized crystallizer was carried out using the Box-Behnken design in Design Expert 13.0. Experiments were conducted according to the experimental design scheme. The effective partition coefficient K of WV freeze concentration using the swirling fluidized crystallizer is listed in Table 3, and the data will be used for modeling and analysis of BPNN.
Table 3. Experimental design matrix and response based on Box-Behnken design
Run | Independent variables | Response | |||
| Freezing temperature (°C) | Flow velocity (m/s) | Freezing time (min) | Seed ice amount (g) | K |
1 | -30 | 1.0 | 60 | 20 | 0.2477 |
2 | -25 | 0.5 | 60 | 20 | 0.2450 |
3 | -30 | 1.5 | 90 | 20 | 0.2496 |
4 | -25 | 1.0 | 90 | 20 | 0.1872 |
5 | -25 | 1.5 | 90 | 10 | 0.3216 |
6 | -25 | 1.0 | 90 | 20 | 0.1974 |
7 | -25 | 1.5 | 120 | 20 | 0.2466 |
8 | -30 | 0.5 | 90 | 20 | 0.2874 |
9 | -25 | 1.0 | 120 | 30 | 0.3488 |
10 | -25 | 0.5 | 120 | 20 | 0.3043 |
11 | -20 | 1.5 | 90 | 20 | 0.3307 |
12 | -25 | 1.5 | 90 | 30 | 0.3765 |
13 | -25 | 0.5 | 90 | 30 | 0.3816 |
14 | -25 | 1.0 | 120 | 10 | 0.2788 |
15 | -20 | 1.0 | 60 | 20 | 0.2901 |
16 | -20 | 1.0 | 90 | 30 | 0.4146 |
17 | -30 | 1.0 | 120 | 20 | 0.2658 |
18 | -25 | 1.5 | 60 | 20 | 0.2382 |
19 | -25 | 1.0 | 60 | 30 | 0.2983 |
20 | -25 | 0.5 | 90 | 10 | 0.3056 |
21 | -25 | 1.0 | 90 | 20 | 0.2092 |
22 | -20 | 1.0 | 120 | 20 | 0.3793 |
23 | -30 | 1.0 | 90 | 30 | 0.2074 |
24 | -30 | 1.0 | 90 | 10 | 0.3986 |
25 | -20 | 0.5 | 90 | 20 | 0.3218 |
26 | -25 | 1.0 | 90 | 20 | 0.1988 |
27 | -25 | 1.0 | 60 | 10 | 0.2845 |
28 | -20 | 1.0 | 90 | 10 | 0.2726 |
29 | -25 | 1.0 | 90 | 20 | 0.1852 |
30 | -25 | 1.0 | 90 | 20 | 0.1891 |
The BPNN model was constructed using the data obtained from the Box-Behnken experimental design and responses (Table 3). By editing the BPNN code, the 30 sets of data were divided into three parts: 15 sets of data were used for network training, 8 sets of data were used for network testing, and the remaining 7 sets were used for network validation. Properly choosing and fine-tuning the number of neurons in the hidden layer and the learning rate are crucial for effectively training a BPNN. BPNN models are highly sensitive to the number of neurons in the hidden layer; an excessive number of neurons can lead to overfitting, while an insufficient number may result in underfitting. When applying such a neural network to a new dataset, it is prone to producing inaccurate output results, as the new dataset may have different random noise characteristics compared to the dataset used for development. Additionally, a significant consideration in the neural network training process is the selection of the learning rate, which dictates the step size at each iteration as the network moves toward minimizing a loss function. If the learning rate is set too high, the learning process may overshoot the minima; conversely, if it is set too low, the network may either take an excessively long time to converge or become trapped in an undesirable local minimum. In the present study, number of neurons in the hidden layer and learning rate were constantly adjusted by trial-and-error method with MSE and R. The test with the lowest MSE and highest R determines the optimal topology of the BPNN. The model with best performance was selected when the number of hidden layer neurons and learning rate were set as 16 and 0.1, respectively. The MSE and R of the model is shown is Table 4.
During the multiple training processes of the BPNN, the error between the network output value and the experimental result decreases stably. As can be seen from Table 4: (1) The small MSE values of the BPNN model (training, testing, and validation) indicate that the optimized model is relatively stable; (2) The correlation coefficient value of the model is close to 1, which shows that the BPNN is effective in predicting the performance of swirling fluidized crystallizer for WV freeze concentration.
Table 4. MSE and R of the BPNN model
| MSE | R |
Training | 2.401e-5 | 0.9971 |
Testing | 4.580e-4 | 0.9617 |
Validation | 6.350e-4 | 0.9575 |
After simulating and training the WV freeze concentration process using a BPNN, simulation analysis was conducted. The output results from the network simulation were then regressed against the effective partition coefficients obtained from experiments, yielding an R value of 0.9575. As shown in Figure 7, the network output results were found to be very close to the experimental results, indicating that the established BPNN model can be used to describe the process of swirling fluidized crystallizer for WV freeze concentration.
Figure 7. Comparison of experimental and BPNN predicted K
Based on the connection weights of the established BPNN model, the contribution rates of freezing temperature, flow velocity, freezing time, and seed ice amount to the output results of WV concentration can be quantitatively calculated. The results presented in Table 5 reveal that the influence of various factors on the effective partition coefficient during the freeze concentration process is ranked in the following order: freezing time > seed ice amount > freezing temperature > flow velocity. This ranking indicates that freezing time has the most significant impact on the effective partition coefficient, suggesting that longer freezing times allow for more extensive solute concentration, thereby enhancing the partition coefficient. The seed ice amount follows closely, as a higher quantity of seed ice provides more nucleation sites for ice crystal growth, facilitating the concentration process. Freezing temperature, while less influential than the first two factors, still plays a crucial role by accelerating ice crystal formation and growth. However, it is important to maintain an optimal temperature to ensure proper solute distribution between ice and solution. Flow velocity, having the least impact, primarily affects the mixing and heat transfer efficiency of the solution, indirectly influencing the concentration process. Therefore, in practical applications, optimizing freezing time and seed ice amount should be prioritized to improve the efficiency and effectiveness of the freeze concentration process. Additionally, carefully controlling freezing temperature and flow velocity is essential for ensuring process stability and efficiency, ultimately leading to a higher effective partition coefficient and better concentration outcomes.
Table 5. Measurement of the relative importance of independent variables on the WV freeze concentration
Independent variables | Relative importance |
Freezing temperature | 28.92% |
Flow velocity | 12.30% |
Freezing time | 29.66% |
Seed ice amount | 29.12% |
Through the optimization process using the BPNN, the optimal conditions for WV freeze concentration are obtained as follows: freezing temperature, flow velocity, freezing time, and seed ice amount are -25.3°C, 1.00m/s, 76.6min, 14.6g, respectively. Under these conditions, the lowest effective partition coefficient obtained is 0.1886. The prediction result of the model under the optimized conditions was experimentally verified, yielding an effective partition coefficient of 0.1903. The experimental result was found to be close to the predicted value, indicating that the established BPNN model is relatively reliable in simulating the freeze concentration of WV in the swirling fluidized crystallizer.
3.3. Characterization and analysis of concentrated WV
The impact of freeze concentration on the quality of WV can be evaluated by comparing and analyzing the changes in the main organic components of WV samples before and after freeze concentration. The original WV sample, concentrated sample, and melted ice water obtained under optimal conditions were subjected to GC-MS comparison analysis of organic components. The results are shown in Figure 8.
As shown in Figure 8, the GC-MS analysis revealed distinct differences in the organic composition of the WV samples before and after freeze concentration. In the original WV sample, a wide range of organic compounds were detected, including various alcohols, acids, esters and phenols, which are known to contribute to the unique biological activity of WV. After freeze concentration, the organic compounds in the concentrated sample are essentially the same as those in the original sample. Meanwhile, the intensity of some key organic components increased significantly in the concentrated WV. For instance, the levels of certain acids and phenols were found to be higher in the concentrated samples compared to the original WV. This finding highlights the efficiency of the freeze concentration in preserving the original chemical profile of the WV while achieving higher concentrations of its active constituents.
In terms of the melted ice water, it was found to contain only trace amounts of organic components. This indicates that the majority of the organic substances were retained in the concentrated WV fraction during the freeze concentration process. The melted ice water essentially represents the portion of the WV that was separated out as ice, and its low organic content confirms the efficiency of the freeze concentration in swirling fluidized crystallizer in separating and concentrating the desired organic components.
Figure 8. GC-MS results of the WV samples (1-methyl alcohol, 2-acetone, 3-acetic acid, 4-butyl acetate, 5-propanoic acid, 6-phenol, 7,8,9-methylphenols)
The concentration of main organic compounds in the original WV sample, concentrated sample, and melted ice water were calculated based on the standard sample curves and regression equations, as shown in Figure 9. It can be seen that after freeze concentration, the concentrations of these compounds in the concentrated sample were significantly increased compared to those in the original sample. For example, the concentration of organic acids increased from 8.965 g/L in the original sample to 13.558 g/L in the concentrated sample, while the concentration of phenols rose from 7.468 g/L to 11.201 g/L. Meanwhile, the melted ice water contained only trace amounts of these organic compounds, with acids and phenols concentrations detected at 2.076 g/L and 1.867 g/L, respectively. Overall, the freeze concentration process achieved an average effective partition coefficient of 0.1903 for organic acids and 0.2063 for phenols, demonstrating its effectiveness in concentrating these compounds. In contrast, the minimal concentrations detected in the melted ice water underscore the high efficiency of the freeze concentration process in separating organic compounds from the crude WV.

Figure 9. The concentration of the main organic compounds in WV samples (1-concentrated WV; 2-original WV; 3-melted ice water)
3.4. Comparison of swirling fluidized crystallizer and stirred crystallizer
To verify the enhanced performance of the swirling fluidized crystallizer in freeze concentration, identical WV freeze concentration experiments were conducted using a stirred crystallizer under the same five sets of experimental conditions. The crystallizer and experimental procedure used in the stirred crystallization experiments were identical to those previously reported in the literature on freeze concentration experiments [20]. Four of these conditions were randomly selected from those listed in Table 3, while one set was the conditions that optimized by the BPNN model. In the experimental conditions, the flow velocity in the swirling fluidized crystallizer corresponded to the circumferential velocity of the stirrer in the stirred crystallizer, and seed ice amount was proportionally scaled according to the volume of WV being processed, with other conditions kept the same. The results are presented in Figure 10.
As shown in Figure 10, the effective partition coefficient of WV freeze concentration in the swirling fluidized crystallizer was lower than that in the stirred crystallizer under all five sets of experimental conditions. This indicates that the swirling fluidized crystallizer significantly improves the freeze concentration efficiency of WV under the same experimental conditions. Specifically, the unique fluid dynamic design of the swirling fluidized crystallizer enables more effective reduction of solute entrainment during the crystallization process, thereby enhancing concentration efficiency.
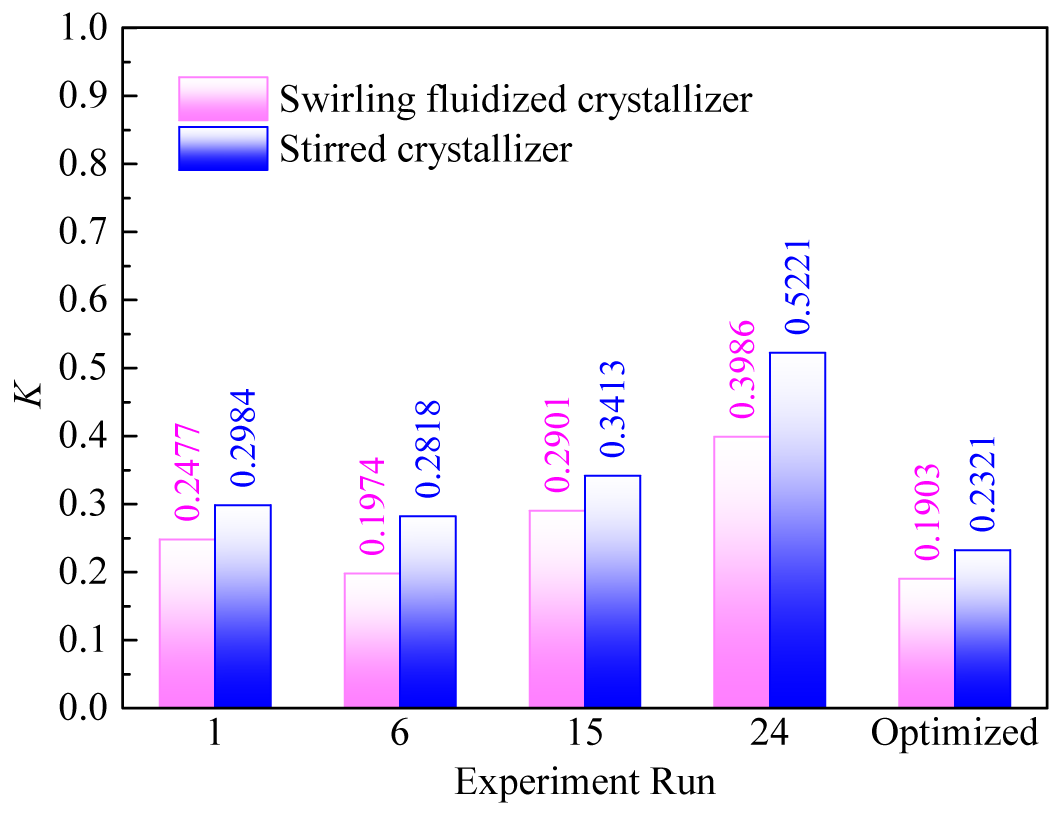
Figure 10. Comparison of WV freeze concentration between swirling fluidized crystallizer and stirred crystallizer
In the comparative analysis, the swirling fluidized crystallizer performed particularly well under the optimized experimental conditions. Its effective partition coefficient was lower than that of the other four randomly selected conditions, demonstrating that the optimized conditions could further leverage the advantages of the swirling fluidized crystallizer, achieving higher efficiency and better separation effects in the freeze concentration process.
In summary, the swirling fluidized crystallizer demonstrated higher efficiency and better performance in the WV freeze concentration process, especially under the experimental conditions optimized by BPNN model, where its advantages were more pronounced. These results provide strong experimental evidence for the application of the swirling fluidized crystallizer in the industrial field of freeze concentration.
4. Conclusions
In this study, an innovative freeze concentration technique in a swirling fluidized crystallizer was introduced to address the challenges of concentrating wood vinegar (WV). The key findings and contributions of this research are summarized as follows: A theoretical force model to analyze the coupled centrifugal forces acting on ice crystal particles in the swirling flow field of the crystallizer was developed. The model demonstrated that the periodic variation in the magnitude and direction of these forces induces deformation at the solid-liquid micro-interface, enhancing mass and heat transfer efficiency. The application of BPNN to model and optimize the complex crystallization kinetics involved in freeze concentration provided a robust framework for predicting and improving the performance of the process. The BPNN model, developed through Box-Behnken experiment design, demonstrated high accuracy and reliability, with an effective partition coefficient of 0.1886 under optimized conditions (-25.3°C freezing temperature, 1.00m/s flow velocity, 76.6min freezing time, and 14.6g seed ice amount). GC-MS analysis confirmed that the concentrated WV retained the chemical profile of the original sample, with significantly enhanced concentrations of key organic components. The freeze concentration process achieved an average effective partition coefficient of 0.1903 for organic acids and 0.2063 for phenols, indicating effective separation and concentration of these compounds. The swirling fluidized crystallizer exhibited superior efficiency in the WV freeze concentration process compared to the stirred crystallizer. This study provides a new technological approach for the efficient concentration and sustainable utilization of WV, contributing to the broader goal of recycling and transforming waste materials into valuable products. The low energy consumption and reduced CO₂ emissions associated with freeze concentration make it an environmentally friendly alternative to traditional concentration methods, offering insights for the high-value utilization of other thermosensitive organic liquid products.
Acknowledgments
This work was supported by the sponsorship of National Natural Science Foundation of China (52400095).
References
[1]. Jahirul, M. I., Rasul, M. G., Chowdhury, A. A., & Ashwath, N. (2012). Biofuels Production through Biomass Pyrolysis —A Technological Review. Energies, 5(12), 4952-5001. https://doi.org/10.3390/en5124952
[2]. Zhang, F., Yang, H., Guo, D., Zhang, S., Chen, H., & Shao, J. (2019). Effects of biomass pyrolysis derived wood vinegar (WVG) on extracellular polymeric substances and performances of activated sludge. Bioresour Technol, 274, 25-32. https://doi.org/10.1016/j.biortech.2018.11.064
[3]. He, L., Geng, K., Li, B., Li, S., Gustave, W., Wang, J., Jeyakumar, P., Zhang, X., & Wang, H. (2025). Enhancement of nutrient use efficiency with biochar and wood vinegar: A promising strategy for improving soil productivity. Journal of the Science of Food and Agriculture, 105(1), 465-472. https://doi.org/10.1002/jsfa.13844
[4]. Wu, Q., Zhang, S., Hou, B., Zheng, H., Deng, W., Liu, D., & Tang, W. (2015). Study on the preparation of wood vinegar from biomass residues by carbonization process. Bioresource Technology, 179, 98-103. https://doi.org/10.1016/j.biortech.2014.12.026
[5]. Feng, T.-H., Xue, R., Zhu, L., & Zhu, Y.-H. (2023). Comparison of antioxidant and antibacterial effects of the Eucommia wood vinegar under the refining methods of atmospheric distillation and vacuum distillation. Industrial Crops and Products, 192, 116013. https://doi.org/10.1016/j.indcrop.2022.116013
[6]. Bikbulatova, G. M., Grachev, A. N., Valiullina, A. I., Valeeva, A. R., Zabelkin, S. A., Dryakhlov, V. O., & Khaziakhmedova, R. M. (2023). Treatment of wastewater generated during the fast pyrolysis of wood waste. Biomass Conversion and Biorefinery, 13(15), 13707-13714. https://doi.org/10.1007/s13399-023-03931-5
[7]. Miyawaki, O., & Inakuma, T. (2020). Development of Progressive Freeze Concentration and Its Application: a Review. Food and Bioprocess Technology. https://doi.org/10.1007/s11947-020-02517-7
[8]. Chang, J., Zuo, J., Lu, K.-J., & Chung, T.-S. (2016). Freeze desalination of seawater using LNG cold energy. Water Research, 102, 282-293. https://doi.org/10.1016/j.watres.2016.06.046
[9]. Lu, H., Wang, J., Wang, T., Wang, N., Bao, Y., & Hao, H. (2017). Crystallization techniques in wastewater treatment: An overview of applications. Chemosphere, 173, 474-484. https://doi.org/10.1016/j.chemosphere.2017.01.070
[10]. Randall, D. G., & Nathoo, J. (2015). A succinct review of the treatment of Reverse Osmosis brines using Freeze Crystallization. Journal of Water Process Engineering, 8, 186-194. https://doi.org/10.1016/j.jwpe.2015.10.005
[11]. Binev, D., Seidel-Morgenstern, A., & Lorenz, H. (2015). Study of crystal size distributions in a fluidized bed crystallizer. Chemical Engineering Science, 133, 116-124. https://doi.org/10.1016/j.ces.2014.12.041
[12]. Habib, B., & Farid, M. (2007). Freeze concentration of milk and saline solutions in a liquid–solid fluidized bed - Experimental. Chemical Engineering and Processing: Process Intensification, 46(12), 1400-1411. https://doi.org/10.1016/j.cep.2006.11.008
[13]. Xu, Y., Fang, Y., Wang, Z., Guo, D., Liu, Y., Huang, Y., Fu, P., Jin, J., Wei, C., Wang, H., & Zeng, T. (2018). In−situ sludge reduction and carbon reuse in an anoxic/oxic process coupled with hydrocyclone breakage. Water Research, 141, 135-144. https://doi.org/10.1016/j.watres.2018.05.010
[14]. Huang, Y., Li, J.-p., Zhang, Y.-h., & Wang, H.-l. (2017). High-speed particle rotation for coating oil removal by hydrocyclone. Separation and Purification Technology, 177, 263-271. https://doi.org/10.1016/j.seppur.2016.12.001
[15]. Williford, C. W., Bricka, R. M., & Foster, C. C. (2002). Reduction of suspended solids following hydroclassification of metal-contaminated soils. Journal of Hazardous Materials, 92(1), 63-75. https://doi.org/10.1016/S0304-3894(01)00374-0
[16]. Khalifa, O., Alkhatib, I. I. I., Bahamon, D., Alhajaj, A., Abu-Zahra, M. R. M., & Vega, L. F. (2022). Modifying absorption process configurations to improve their performance for Post-Combustion CO2 capture – What have we learned and what is still Missing? Chemical Engineering Journal, 430, 133096. https://doi.org/10.1016/j.cej.2021.133096
[17]. I.A Basheer, & Hajmeer, M. (2000). Artificial neural networks: fundamentals, computing, design, and application. Journal of Microbiological Methods, 43(1), 3-31. https://doi.org/10.1016/S0167-7012(00)00201-3
[18]. Li, L., Rong, S., Wang, R., & Yu, S. (2021). Recent advances in artificial intelligence and machine learning for nonlinear relationship analysis and process control in drinking water treatment: A review. Chemical Engineering Journal, 405. https://doi.org/10.1016/j.cej.2020.126673
[19]. Huang, Y., Wang, H.l., Tian, J., Li, J., Fu, P., & He, F. (2020). Theoretical study on centrifugal coupling characteristics of self-rotation and revolution of particles in hydrocyclones. Separation and Purification Technology, 244. https://doi.org/10.1016/j.seppur.2020.116552
[20]. Yuan, W., Zhang, L., Liu, Y., Fu, P., Huang, Y., Wang, L., Ma, H., & Wang, H. (2020). Sulfide removal and water recovery from ethylene plant spent caustic by suspension crystallization and its optimization via response surface methodology. Journal of Cleaner Production, 242. https://doi.org/10.1016/j.jclepro.2019.118439
Cite this article
Yuan,W.;He,L.;Guo,Y.;Zheng,L.;Ma,H. (2025). Modeling and optimization of freeze concentration of Wood Vinegar in a swirling fluidized crystallizer. Advances in Engineering Innovation,16(4),119-132.
Data availability
The datasets used and/or analyzed during the current study will be available from the authors upon reasonable request.
Disclaimer/Publisher's Note
The statements, opinions and data contained in all publications are solely those of the individual author(s) and contributor(s) and not of EWA Publishing and/or the editor(s). EWA Publishing and/or the editor(s) disclaim responsibility for any injury to people or property resulting from any ideas, methods, instructions or products referred to in the content.
About volume
Journal:Advances in Engineering Innovation
© 2024 by the author(s). Licensee EWA Publishing, Oxford, UK. This article is an open access article distributed under the terms and
conditions of the Creative Commons Attribution (CC BY) license. Authors who
publish this series agree to the following terms:
1. Authors retain copyright and grant the series right of first publication with the work simultaneously licensed under a Creative Commons
Attribution License that allows others to share the work with an acknowledgment of the work's authorship and initial publication in this
series.
2. Authors are able to enter into separate, additional contractual arrangements for the non-exclusive distribution of the series's published
version of the work (e.g., post it to an institutional repository or publish it in a book), with an acknowledgment of its initial
publication in this series.
3. Authors are permitted and encouraged to post their work online (e.g., in institutional repositories or on their website) prior to and
during the submission process, as it can lead to productive exchanges, as well as earlier and greater citation of published work (See
Open access policy for details).
References
[1]. Jahirul, M. I., Rasul, M. G., Chowdhury, A. A., & Ashwath, N. (2012). Biofuels Production through Biomass Pyrolysis —A Technological Review. Energies, 5(12), 4952-5001. https://doi.org/10.3390/en5124952
[2]. Zhang, F., Yang, H., Guo, D., Zhang, S., Chen, H., & Shao, J. (2019). Effects of biomass pyrolysis derived wood vinegar (WVG) on extracellular polymeric substances and performances of activated sludge. Bioresour Technol, 274, 25-32. https://doi.org/10.1016/j.biortech.2018.11.064
[3]. He, L., Geng, K., Li, B., Li, S., Gustave, W., Wang, J., Jeyakumar, P., Zhang, X., & Wang, H. (2025). Enhancement of nutrient use efficiency with biochar and wood vinegar: A promising strategy for improving soil productivity. Journal of the Science of Food and Agriculture, 105(1), 465-472. https://doi.org/10.1002/jsfa.13844
[4]. Wu, Q., Zhang, S., Hou, B., Zheng, H., Deng, W., Liu, D., & Tang, W. (2015). Study on the preparation of wood vinegar from biomass residues by carbonization process. Bioresource Technology, 179, 98-103. https://doi.org/10.1016/j.biortech.2014.12.026
[5]. Feng, T.-H., Xue, R., Zhu, L., & Zhu, Y.-H. (2023). Comparison of antioxidant and antibacterial effects of the Eucommia wood vinegar under the refining methods of atmospheric distillation and vacuum distillation. Industrial Crops and Products, 192, 116013. https://doi.org/10.1016/j.indcrop.2022.116013
[6]. Bikbulatova, G. M., Grachev, A. N., Valiullina, A. I., Valeeva, A. R., Zabelkin, S. A., Dryakhlov, V. O., & Khaziakhmedova, R. M. (2023). Treatment of wastewater generated during the fast pyrolysis of wood waste. Biomass Conversion and Biorefinery, 13(15), 13707-13714. https://doi.org/10.1007/s13399-023-03931-5
[7]. Miyawaki, O., & Inakuma, T. (2020). Development of Progressive Freeze Concentration and Its Application: a Review. Food and Bioprocess Technology. https://doi.org/10.1007/s11947-020-02517-7
[8]. Chang, J., Zuo, J., Lu, K.-J., & Chung, T.-S. (2016). Freeze desalination of seawater using LNG cold energy. Water Research, 102, 282-293. https://doi.org/10.1016/j.watres.2016.06.046
[9]. Lu, H., Wang, J., Wang, T., Wang, N., Bao, Y., & Hao, H. (2017). Crystallization techniques in wastewater treatment: An overview of applications. Chemosphere, 173, 474-484. https://doi.org/10.1016/j.chemosphere.2017.01.070
[10]. Randall, D. G., & Nathoo, J. (2015). A succinct review of the treatment of Reverse Osmosis brines using Freeze Crystallization. Journal of Water Process Engineering, 8, 186-194. https://doi.org/10.1016/j.jwpe.2015.10.005
[11]. Binev, D., Seidel-Morgenstern, A., & Lorenz, H. (2015). Study of crystal size distributions in a fluidized bed crystallizer. Chemical Engineering Science, 133, 116-124. https://doi.org/10.1016/j.ces.2014.12.041
[12]. Habib, B., & Farid, M. (2007). Freeze concentration of milk and saline solutions in a liquid–solid fluidized bed - Experimental. Chemical Engineering and Processing: Process Intensification, 46(12), 1400-1411. https://doi.org/10.1016/j.cep.2006.11.008
[13]. Xu, Y., Fang, Y., Wang, Z., Guo, D., Liu, Y., Huang, Y., Fu, P., Jin, J., Wei, C., Wang, H., & Zeng, T. (2018). In−situ sludge reduction and carbon reuse in an anoxic/oxic process coupled with hydrocyclone breakage. Water Research, 141, 135-144. https://doi.org/10.1016/j.watres.2018.05.010
[14]. Huang, Y., Li, J.-p., Zhang, Y.-h., & Wang, H.-l. (2017). High-speed particle rotation for coating oil removal by hydrocyclone. Separation and Purification Technology, 177, 263-271. https://doi.org/10.1016/j.seppur.2016.12.001
[15]. Williford, C. W., Bricka, R. M., & Foster, C. C. (2002). Reduction of suspended solids following hydroclassification of metal-contaminated soils. Journal of Hazardous Materials, 92(1), 63-75. https://doi.org/10.1016/S0304-3894(01)00374-0
[16]. Khalifa, O., Alkhatib, I. I. I., Bahamon, D., Alhajaj, A., Abu-Zahra, M. R. M., & Vega, L. F. (2022). Modifying absorption process configurations to improve their performance for Post-Combustion CO2 capture – What have we learned and what is still Missing? Chemical Engineering Journal, 430, 133096. https://doi.org/10.1016/j.cej.2021.133096
[17]. I.A Basheer, & Hajmeer, M. (2000). Artificial neural networks: fundamentals, computing, design, and application. Journal of Microbiological Methods, 43(1), 3-31. https://doi.org/10.1016/S0167-7012(00)00201-3
[18]. Li, L., Rong, S., Wang, R., & Yu, S. (2021). Recent advances in artificial intelligence and machine learning for nonlinear relationship analysis and process control in drinking water treatment: A review. Chemical Engineering Journal, 405. https://doi.org/10.1016/j.cej.2020.126673
[19]. Huang, Y., Wang, H.l., Tian, J., Li, J., Fu, P., & He, F. (2020). Theoretical study on centrifugal coupling characteristics of self-rotation and revolution of particles in hydrocyclones. Separation and Purification Technology, 244. https://doi.org/10.1016/j.seppur.2020.116552
[20]. Yuan, W., Zhang, L., Liu, Y., Fu, P., Huang, Y., Wang, L., Ma, H., & Wang, H. (2020). Sulfide removal and water recovery from ethylene plant spent caustic by suspension crystallization and its optimization via response surface methodology. Journal of Cleaner Production, 242. https://doi.org/10.1016/j.jclepro.2019.118439