


1. Introduction
Water conservancy hubs play a vital role in regulating water flow, generating electricity, flood control, irrigation, and improving navigation. Through scientific planning and management, these hubs enable the integrated use of water resources and promote the sustainable development of the economy and society. However, the construction and operation of such hubs inevitably affect the natural flow conditions, disrupt the original equilibrium, and bring about new changes in river-lake interactions. Taking the recently prioritized Poyang Lake Water Conservancy Project as an example, the lake’s hydrological regime has undergone significant changes in recent years. These changes are typified by an earlier onset of the dry season, persistently low water levels, and prolonged low hydrological conditions. This phenomenon is primarily driven by the combined effect of reduced inflow into the Poyang Lake basin and alterations in the hydrological rhythm of the Yangtze River basin, reflecting the sensitivity of hydrological connectivity in the basin system to complex environmental stressors [1-2]. Numerous scholars have conducted extensive research on the hydrological and ecological impacts of the Poyang Lake Water Conservancy Project. Lai [3] quantitatively analyzed the potential impact of typical annual water level regulation plans of the hub on the flow of the Yangtze mainstream using a two-dimensional hydrodynamic model. Yu [4] and others, by fully considering the interaction between Poyang Lake and the Yangtze River, employed a one- and two-dimensional coupled hydro-hydrodynamic model to analyze the hub’s influence on water levels and flow velocities during the lake’s dry season. Tan [5] used hydrological computation methods to estimate the effects of different design frequencies on the mainstream flow and concluded that the hub construction can have a compensatory effect on the mainstream flow. However, existing research largely focuses on the impact of regulation plans on mainstream flow, while studies on how these flow changes affect the hydraulic conditions in confluence reaches remain relatively scarce.
The downstream impacts of hub construction are primarily concentrated in the storage and initial regulation phases, with the most direct effect on the Zhangnan–Hukou waterway of the Yangtze River. This study uses a two-dimensional hydrodynamic model, combined with hub regulation schemes, and selects three scenarios with the most adverse flow changes during hub operation to quantitatively analyze the hub’s influence on hydraulic conditions in the river-lake confluence reach of the Yangtze River mainstream. This provides technical support for further studies on the impacts on navigation channels and navigability.
2. Research methods
The Jiangxi section of the Yangtze River mainstream spans 136 km, including 81 km upstream and 55 km downstream of Hukou. The proposed Poyang Lake Water Conservancy Project is located within the Poyang Lake area, with the dam site approximately 27 km from the confluence at Hukou. Hukou is located near the tail of Zhangjiazhou Shoal on the Yangtze River mainstream. According to the waterway division of the mainstream, the river entry point at Hukou lies within the Zhangjiazhou waterway, followed downstream by the Hukou waterway. A schematic diagram of the project’s geographic location and river-lake relationship is shown in Figure 1.
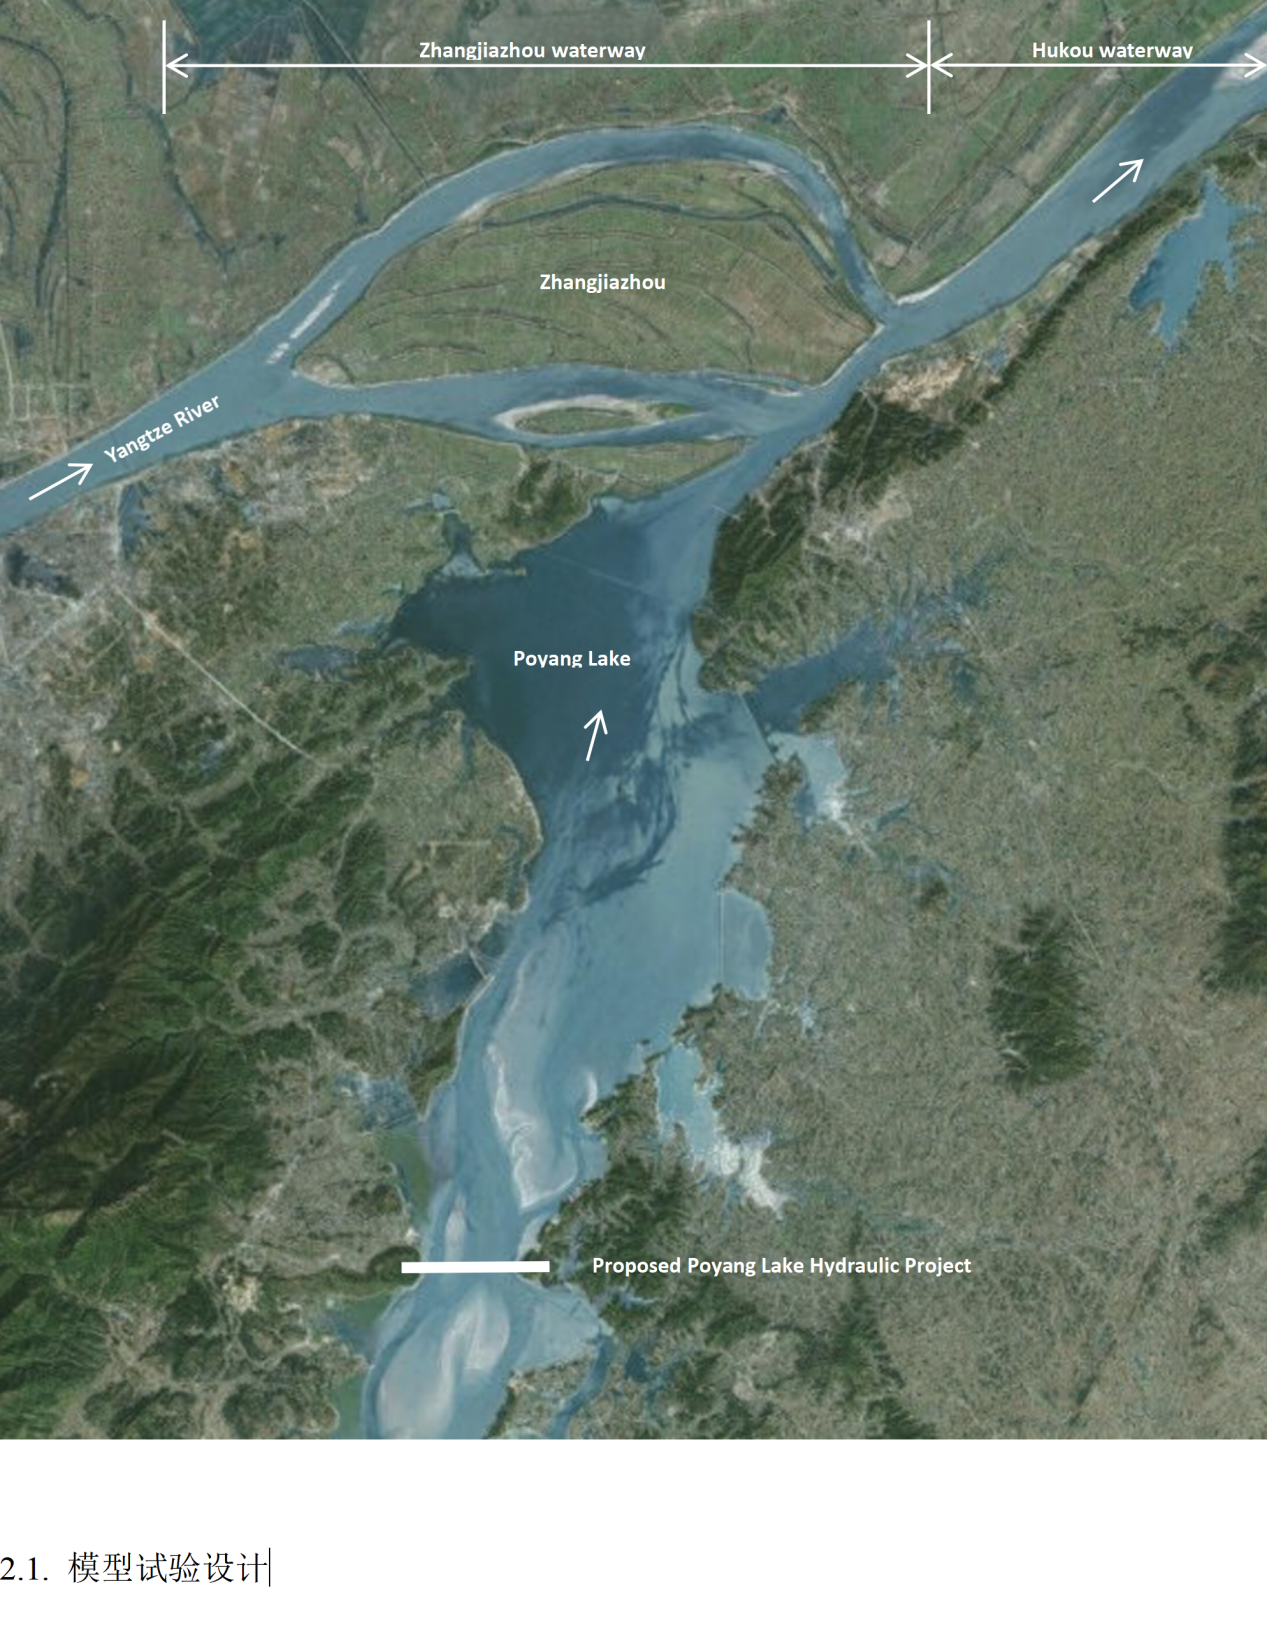
Figure 1. Schematic diagram of the proposed project location and river-lake relationship
2.1. Model experiment design
Given the spatial relationship between Poyang Lake and the Yangtze River, the Zhangjiazhou–Hukou waterway was selected as the focus of the study. A nested grid zoning technique was applied in the study area—based on the existing Wuxue–Datong numerical model, a refined sub-model was established for the research area with finer grid resolution. The grid scale in the confluence section ranged from 10 to 30 meters and gradually transitioned to approximately 200 meters downstream. To balance computational efficiency and the required grid precision for engineering analysis, coarse grids were used in gently sloped shoal areas, and dense grids were used at the Poyang Lake outlet area. The schematic of the Wuxue–Datong model is shown in Figure 2.
The model has three open boundaries: the Jiujiang section upstream of the Yangtze River, the Pengze section downstream, and the Hukou section. At the Jiujiang section, inflow from the upper Yangtze River is used as the input condition. At the Pengze section, actual measured water levels control the boundary, with adjustments made to account for the reduction in flow caused by the hub’s regulation, which leads to water level decreases downstream of Hukou. Adjustments at this boundary are based on the Pengze–Datong stage-discharge relationship. At the Hukou boundary, corrections are made based on discharge at the Hukou station, considering the hub’s regulatory influence.
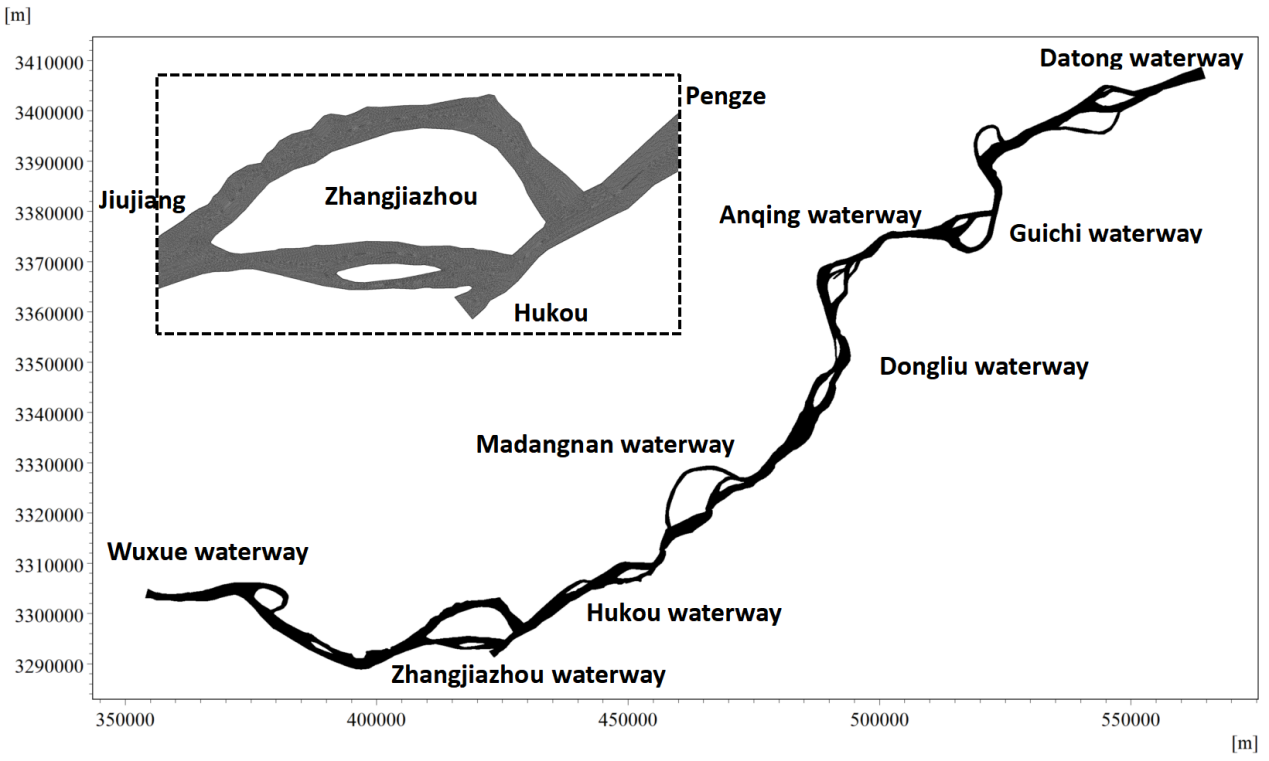
Figure 2. Schematic diagram of the Wuxue–Datong numerical model
2.2. Experimental scenarios
According to the hub’s “regulate low flow, not flood” principle: from April 1 to the end of August is the free-discharge period, during which the river resumes its natural state; from September 1 to the end of March of the following year is the controlled-discharge period, during which upstream water levels are appropriately raised. Based on the basic parameters of the Poyang Lake hub, the maximum and minimum regulatory water levels are 14.20 m and 6.6 m, respectively, with a total storage volume of 7.8 billion m³ between these levels.
The reduction in Datong discharge primarily occurs during the reservoir impoundment period (September 1–15), with a maximum decrease of 3,921 m³/s in a normal year, accounting for approximately 14% of Datong’s flow at the time. Even after the reduction, the discharge remains above the annual minimum of over 20,000 m³/s. In the subsequent water level regulation phase (September 16–March 31), the flow typically increases. The maximum increase is 3,504 m³/s, and the maximum reduction is 968 m³/s, resulting in a flow variation range of –4.2% to 12.59%.
Typical experimental scenarios were selected based on the largest flow fluctuations during different stages of regulation to analyze the effects of hub operation on the hydrodynamic conditions in the Poyang Lake river-lake confluence area.
Scenario 1: Maximum reduction in Datong discharge of approximately 3,921 m³/s during reservoir impoundment.
Scenario 2: Maximum increase in Datong discharge of 3,504 m³/s after September 15 during regulation.
Scenario 3: Flow reduction of 968 m³/s after September 15 during regulation.
Table 1. Simulated test scenarios
Scenario | Before/After Regulation | Poyang Lake Outflow | Jiujiang Flow | Datong Water Level (m) |
Scenario 1 | Before Regulation | 5,410 | 22,390 | 6.742 |
After Regulation | 1,489 | 22,390 | 5.905 | |
Scenario 2 | Before Regulation | -300 | 29,500 | 7.032 |
After Regulation | 3,204 | 29,500 | 7.735 | |
Scenario 3 | Before Regulation | 3,420 | 23,980 | 6.659 |
After Regulation | 2,452 | 23,980 | 6.455 |
Based on the above scenarios and hydrological data, boundary conditions were defined to drive a two-dimensional hydrodynamic model from Hankou to Datong and the Poyang Lake inflow channel downstream of the hub project. The model was used to simulate hydrodynamic fields under different conditions and analyze the effects of Poyang Lake hub operation on the flow distribution ratio, main channel zones, and localized flow patterns in the Yangtze River confluence reach.
3. Result analysis
3.1. Impact on the flow distribution ratio of the Yangtze River mainstream branch channels
The Zhangjiazhou waterway is located in the lower reaches of the Yangtze River, starting at Suojianglou in Jiujiang and ending at Bali River Mouth, with a total length of approximately 32 km. This waterway is of the bifurcated type. The left branch is called Beigang, which is winding and shaped like a bow; the right branch is called Nangang, which is straight and has historically served as the main channel for medium and high flows. The lower section of Nangang receives inflow from Poyang Lake via its right bank.
Before the late 1980s, due to inadequate depth in Nangang, it served only as the main channel during medium and high flows, while Beigang was the main navigation route during the dry season. Beigang had many shallow areas and a complex, unstable channel structure, making maintenance difficult. After 1989, with significant improvements in the navigation conditions of Nangang, it was designated as the main channel for year-round navigation. Within Nangang, secondary bifurcations developed, with Guanzhou’s right branch (Guanzhoujia) and Xinzhou’s left branch (Xinzhoujia) forming tributary channels. Additionally, the lower section of Nangang receives water from Poyang Lake on the right bank. Two shallow areas exist within Nangang. In response, multiple waterway regulation projects have been implemented.
With these regulation efforts, the shoal-trough pattern has generally stabilized. However, the inlet of the upper shallow area remains relatively wide, causing some main current shifting; the lower shallow area is significantly influenced by the backwater effect of Poyang Lake. Guanzhoujia remains in an active scouring phase, with a clear trend of deepening and signs of instability.
Stable discharge is the foundation for sufficient channel depth and navigability. An imbalanced flow split ratio can result in navigation disruptions in some tributaries. Observations of changes in the waterway conditions of Zhangjiazhou’s right branch over recent decades show that the flow split ratio of the right branch gradually decreased between the 1950s and 1970s, ranging from 55.5% to 42.4%. From the 1970s to the 1980s, it gradually increased, ranging from 43.3% to 50.1%. During 1990–2002, the ratio increased further from 48.2% in 1996 to 58.3%. Between 2002 and 2009, it rose steadily to about 64%. Since then, with continued regulation, the split ratio has remained relatively stable.
Table 2. Simulated flow split ratio of Zhangjiazhou channels under unfavorable regulation conditions of the Poyang Lake water control project
Scenario | Regulation Status | Flow Split Ratio (%) | |
Left Branch | Right Branch | ||
1 | Before Regulation | 36.8 | 63.2 |
After Regulation | 35.5 | 64.5 | |
2 | Before Regulation | 36.0 | 64.0 |
After Regulation | 37.0 | 63.0 | |
3 | Before Regulation | 36.5 | 63.5 |
After Regulation | 36.2 | 63.8 | |
This study considered the changes in the confluence flow from Poyang Lake into the Yangtze River mainstream caused by regulation from the Poyang Lake Water Control Project. The simulated changes in the flow split ratio at Zhangjiazhou before and after regulation are shown in Table 2. From Table 2, the following conclusions can be drawn:
(1) Regulation-induced changes in the flow entering the Yangtze from tributaries result in corresponding adjustments to the flow split ratio between the branches. The magnitude of adjustment is related to the scale of the discharge change, but overall, the variation remains small. For instance, a flow change of 3921 m³/s results in a split ratio adjustment of about 1.3%, a 3504 m³/s change corresponds to a 1% adjustment, and a 968 m³/s change results in a 0.3% shift.
(2) The trend in flow split ratio changes is closely related to the increase or decrease in discharge caused by regulation. A reduction in discharge results in an increase in the flow share of the right branch at Zhangjiazhou, while an increase in the outflow from Poyang Lake reduces the right branch’s share. For example, under Scenario 1, regulation led to a decrease in ecological base flow discharge by about 3921 m³/s, increasing the right branch split ratio from 63.2% to 64.5%. Conversely, in Scenario 2, the discharge increased by 3504 m³/s, resulting in a 1% decrease in the right branch split ratio.
3.2. Impact on the mainstream flow zone of the Yangtze River
3.2.1. Scenario 1
Figure 3 shows the isovel distribution of flow velocity changes before and after regulation under the unfavorable conditions of Scenario 1. According to the findings, under the scenario where the Datong discharge is reduced by a maximum of approximately 3921 m³/s during the reservoir impoundment period, the upstream flow velocity at Hukou on the Yangtze River increases by up to 0.25 m/s, while the downstream velocity decreases by up to 0.15 m/s. The regulation reduces the discharge by about 5000 m³/s, significantly affecting the flow velocity in sections near the river–lake junction, with a maximum decrease of about 0.6 m/s. After regulation, the water level drops by 1.05–1.07 m.
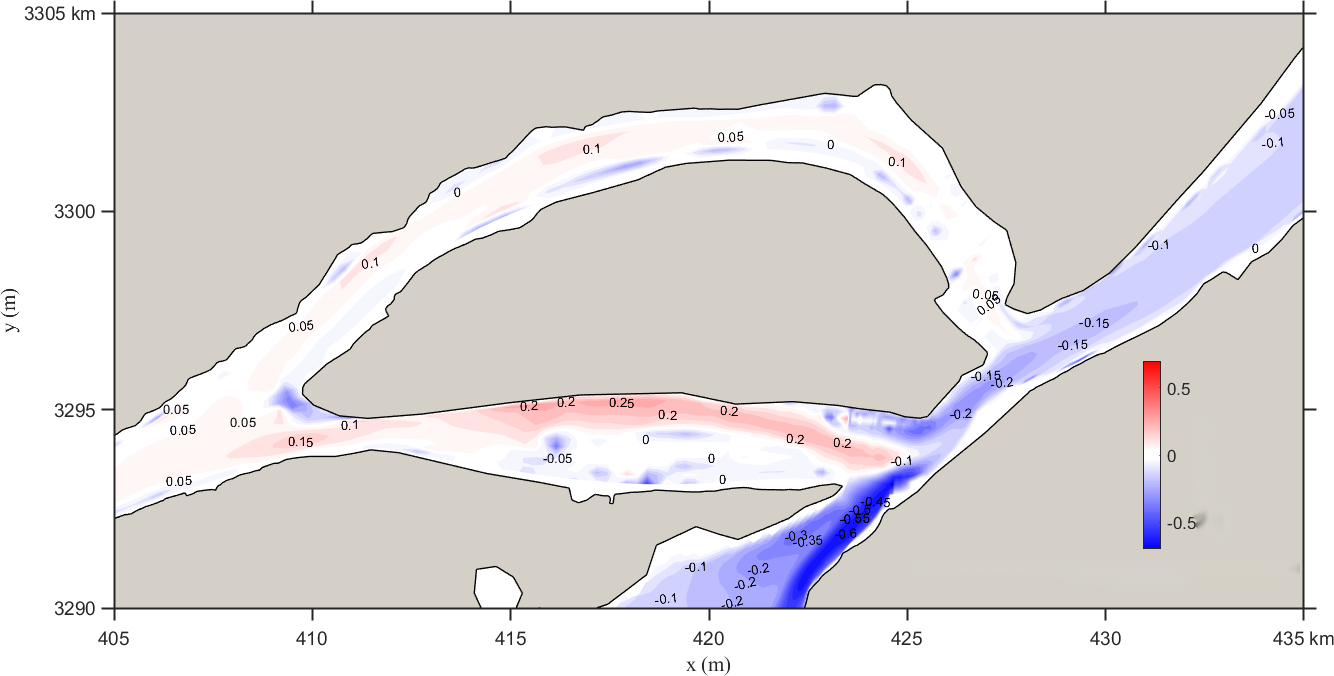
Figure 3. Flow velocity change isovels for scenario 1
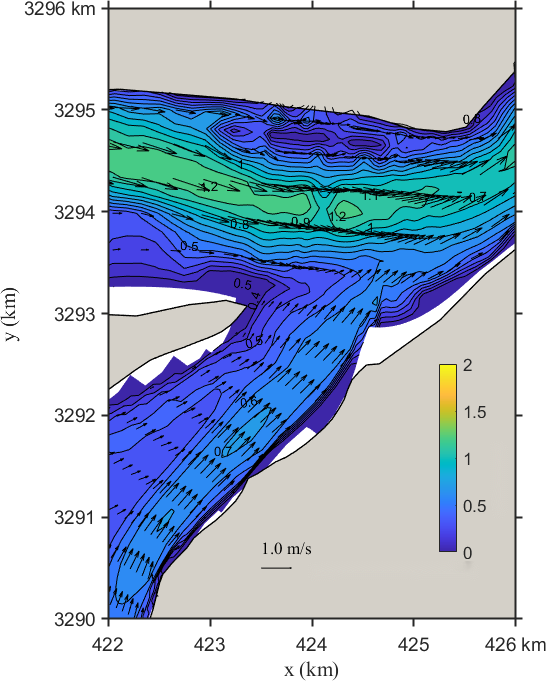
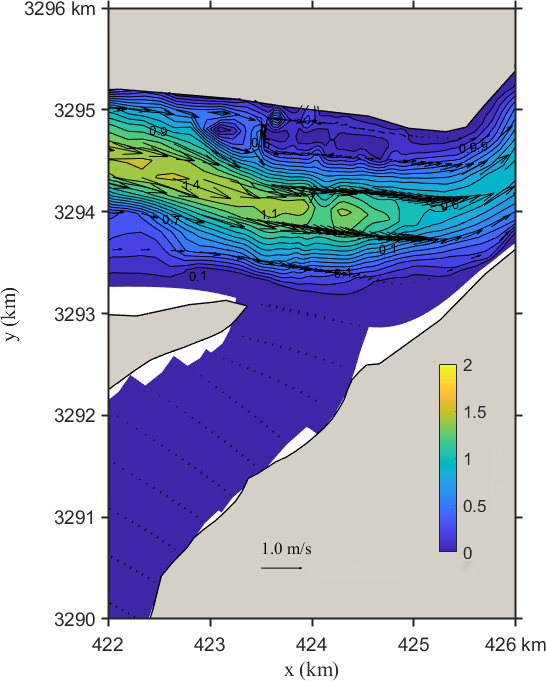
Figure 4. Flow field distribution of the Yangtze–Poyang confluence before (left) and after (right) regulation
Figure 4 displays the flow field distribution in the confluence area under Scenario 1. Key observations include:
(1) Before the project, a clear flow stream enters the Yangtze along the right bank, with a flow direction of 210–220º and velocities exceeding 0.60 m/s. After the project, the main flow zone becomes indistinct in the inflow section, with flow velocities generally below 0.10 m/s and minimal directional change.
(2) In the upper confluence section, before the project, the main stream lies south of Biandan Island, forming a primary current zone exceeding 1.00 m/s with a direction of 270–280º, and a central velocity peak of 1.20 m/s. After the project, the stream position remains mostly unchanged, but the velocity slightly increases, with most values exceeding 1.10 m/s and local peaks reaching 1.40 m/s, with no significant directional change.
(3) In the downstream confluence section, before the project, the main current flows through the middle of the river with a direction of 240–250º and velocities over 0.70 m/s. After regulation, the velocity in this region drops below 0.60 m/s, with little change in flow direction.
3.2.2. Scenario 2
Figure 5 shows the isovel distribution for flow velocity changes before and after regulation under Scenario 2. The study reveals that under the scenario where Datong discharge increases by 3504 m³/s after September 15, the upstream velocity at Hukou decreases by up to 0.25 m/s, while the downstream velocity increases by up to 0.1 m/s. Due to the increased discharge of 3504 m³/s, velocity in the inflow section near the lake mouth increases by up to 0.3 m/s. The water level rises by 1.03–1.04 m after regulation.
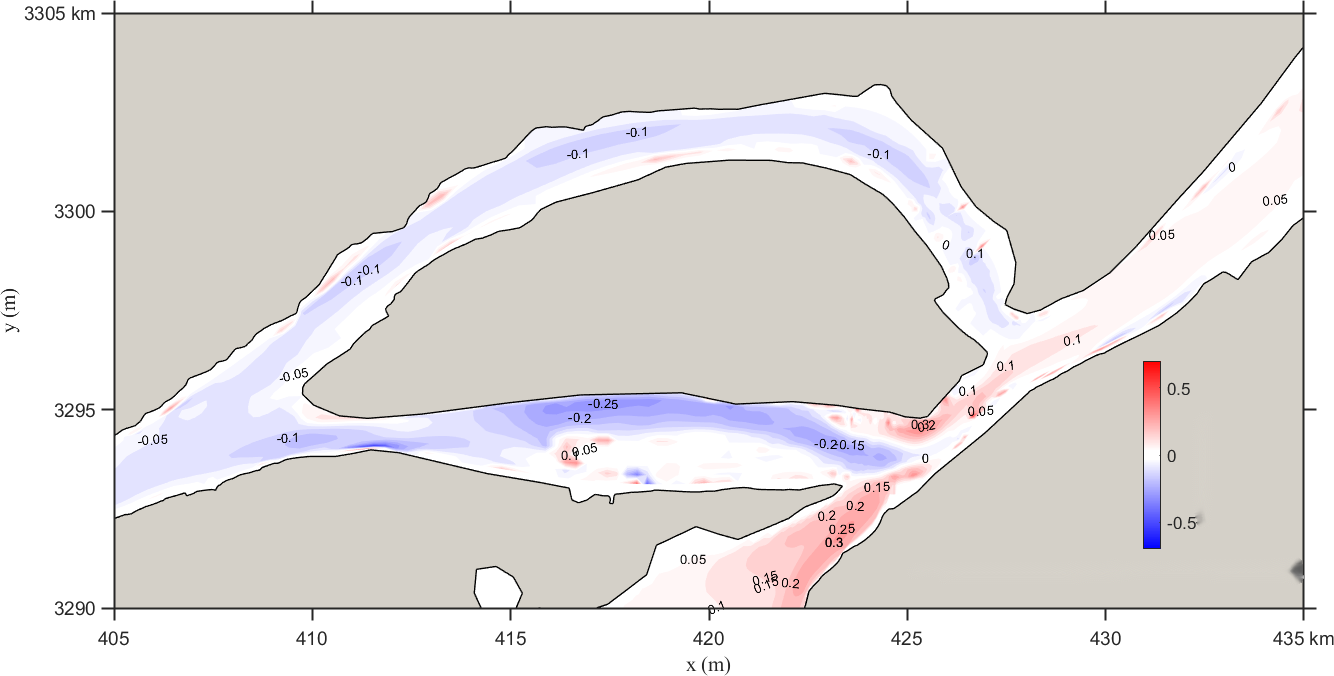
Figure 5. Flow velocity change isovels for scenario 2
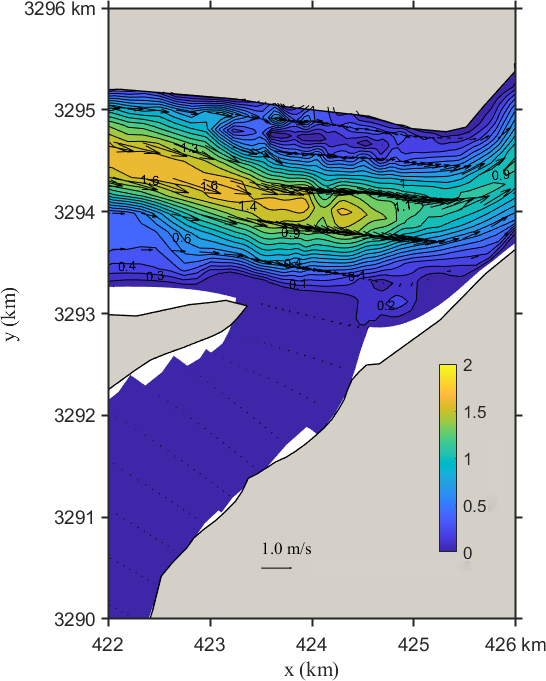
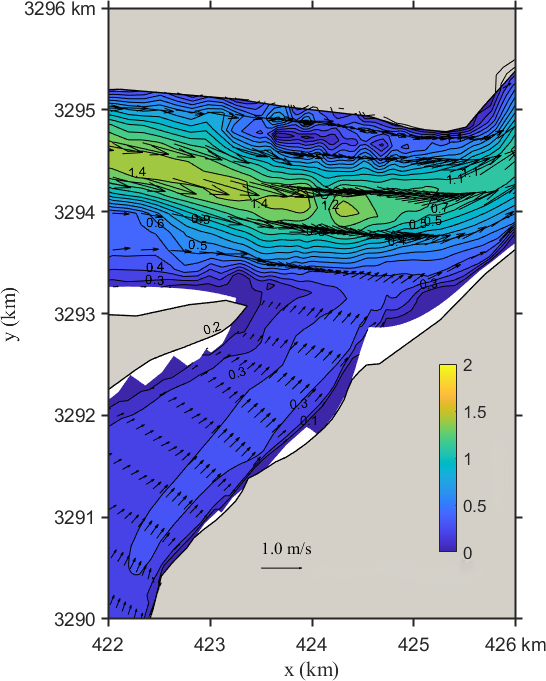
Figure 6. Flow field distribution of the Yangtze–Poyang confluence before (left) and after (right) regulation
Figure 6 illustrates the flow field changes under Scenario 2. Observations include:
(1) Before the project, water in the inflow channel backflows with low discharge and negligible velocity, flowing upstream into Poyang Lake. After the project, regulation shifts flow direction to 210–220º, with the main stream along the right bank and velocities exceeding 0.30 m/s.
(2) In the upper confluence section, the main stream lies south of Biandan Island, with flow direction of 270–280º and peak velocities over 1.60 m/s before the project. After regulation, the stream position remains unchanged, but the velocity slightly weakens, with most values under 1.10 m/s and local peaks of 1.40 m/s, and minimal directional variation.
(3) In the downstream confluence section, the main current flows through the middle of the river, with flow direction of 240–250º and velocities exceeding 0.80 m/s before the project. After regulation, velocity increases to over 1.10 m/s, with negligible change in direction.
3.2.3. Scenario 3
Figure 7 shows the contour distribution of flow velocity changes before and after the regulation of the hub under the adverse Scenario 3. According to the research findings, under the scenario where the flow at Datong is reduced by 968 m³/s after September 15 due to hub regulation, the flow velocity upstream of Hukou along the Yangtze River increases slightly, while the downstream velocity decreases slightly, with a variation within 0.04 m/s. Influenced by the reduced discharge from the hub, the flow velocity near the lake outlet in the river channel slightly decreases, with the maximum reduction within 0.12 m/s. After regulation, the water level drops by 0.28–0.22 m.
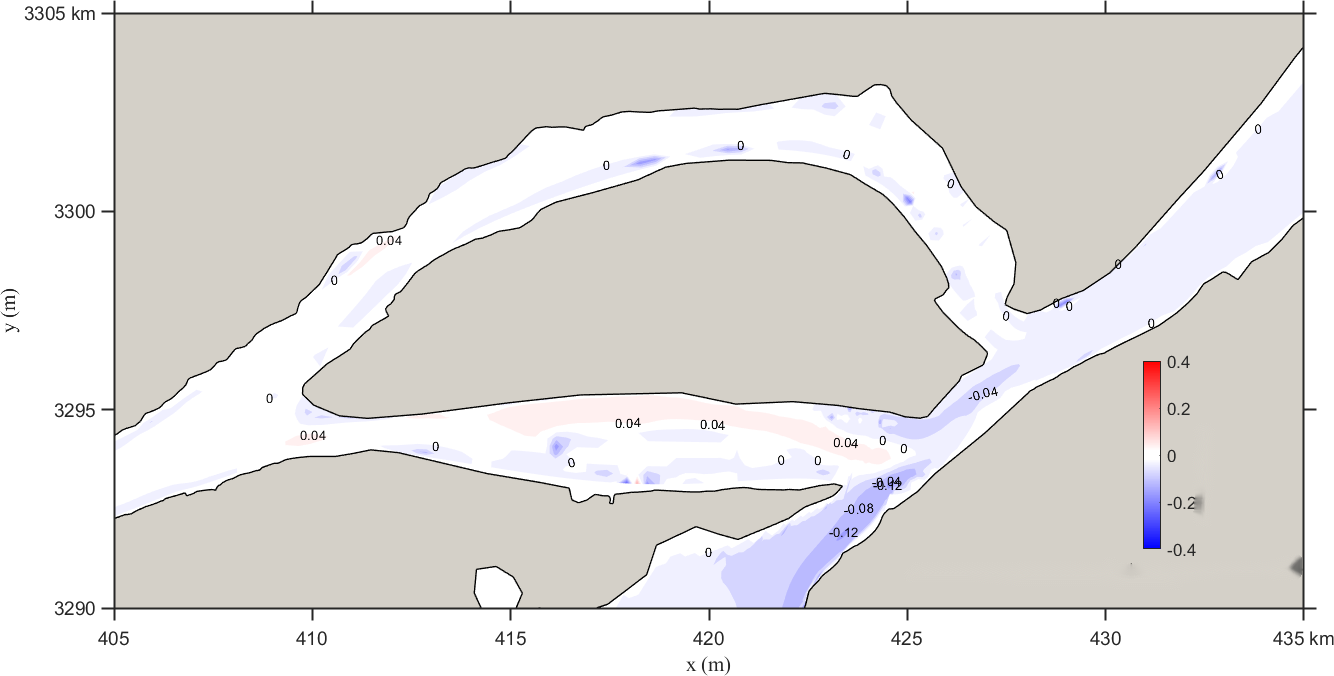
Figure 7. Contour distribution of flow velocity changes under scenario 3
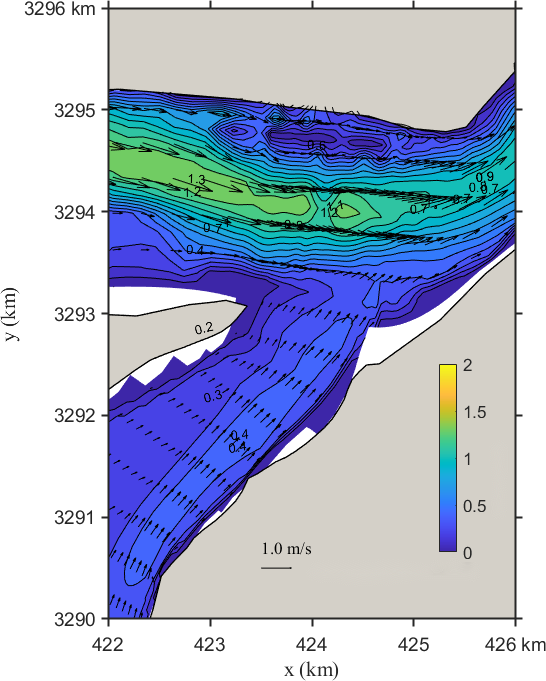
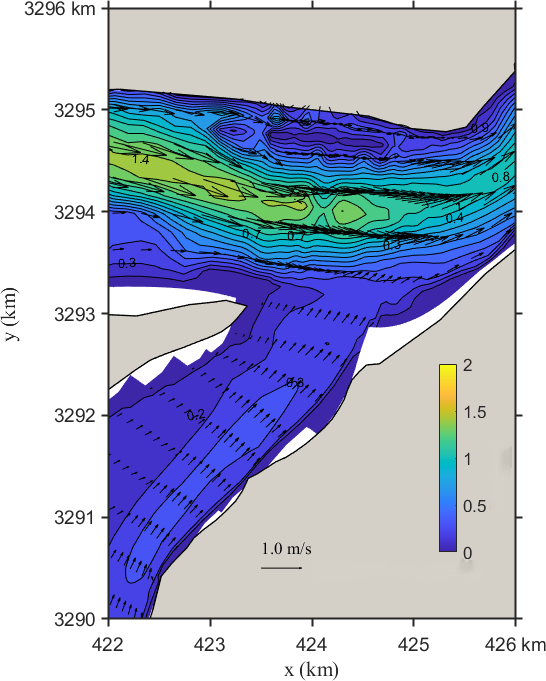
Figure 8. Flow velocity distribution of the Yangtze-Poyang Lake confluence section before (left) and after (right) hub regulation
Figure 8 illustrates the flow field distribution in the confluence section of the Yangtze River and Poyang Lake under Scenario 3 before and after project implementation. As shown in the figure:
(1) Before the project, the main flow in the river channel entering the lake is close to the right bank, forming a mainstream zone with a velocity greater than 0.40 m/s and a direction of 210–220º. After regulation, the position of the mainstream zone remains unchanged, and the flow direction changes only slightly, but the flow velocity weakens to 0.30 m/s.
(2) In the upper section of the confluence area, before the project, the mainstream zone lies south of Biandan Shoal, with a velocity exceeding 1.10 m/s and a direction of approximately 280–270º. The maximum central velocity reaches 1.30 m/s. After the project, the position remains essentially the same, but the flow velocity slightly increases, generally exceeding 1.20 m/s, with local maxima reaching 1.40 m/s. There is no significant change in flow direction.
(3) In the lower section of the confluence area, the mainstream zone is located in the middle of the river channel. Before regulation, it flows at 240–250º with a velocity greater than 0.90 m/s. After regulation, the velocity decreases to 0.80 m/s, with little change in flow direction.
3.3. Impact on the local flow field in the confluence section
3.3.1. Scenario 1
Figure 9 shows the changes in the local flow field in the confluence section of the Yangtze River and Poyang Lake under Scenario 1. It can be seen that after regulation, the flow velocity at the lake outlet in the confluence area decreases, with the reduction more pronounced near the right bank. The maximum decrease is approximately 0.40 m/s. There are radial and transverse variations in the confluence area of the Yangtze River: radially, upstream velocity increases while downstream velocity decreases; transversely, velocity decreases more near the banks, while the reduction trend toward the middle of the river weakens upstream.
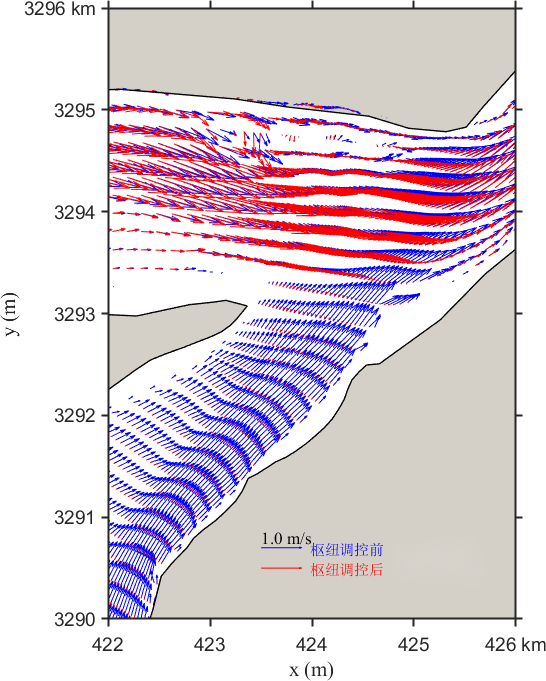
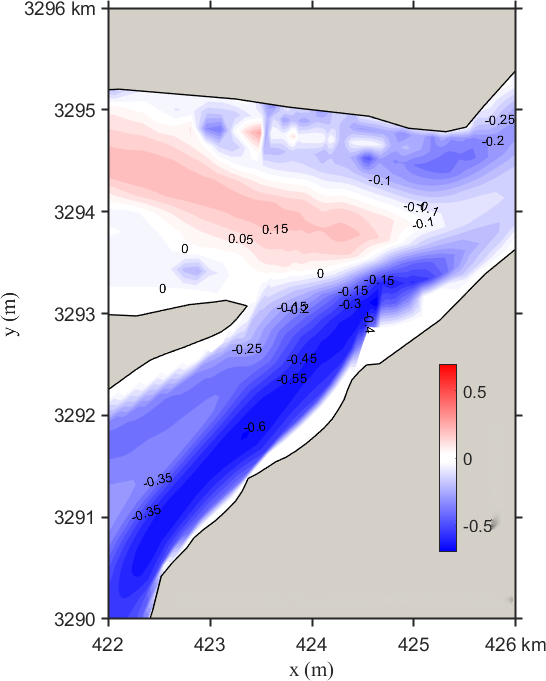
Figure 9. Contour distribution of flow velocity and velocity differences in the Yangtze-Poyang Lake confluence section before and after hub regulation
3.3.2. Scenario 2
Figure 10 presents the changes in the local flow field under Scenario 2. After regulation, the flow velocity at the lake outlet increases, especially in the central region, more than along both banks. The maximum reduction is about 0.20 m/s. There are radial and transverse variations in the confluence area: radially, upstream velocity decreases while downstream velocity increases; transversely, flow velocity increases near both banks. On the left bank, the velocity at the tail of Zhangjia Shoal increases up to 0.30 m/s, while the right bank sees a maximum increase of 0.20 m/s. The increasing trend in velocity weakens toward the center of the channel.
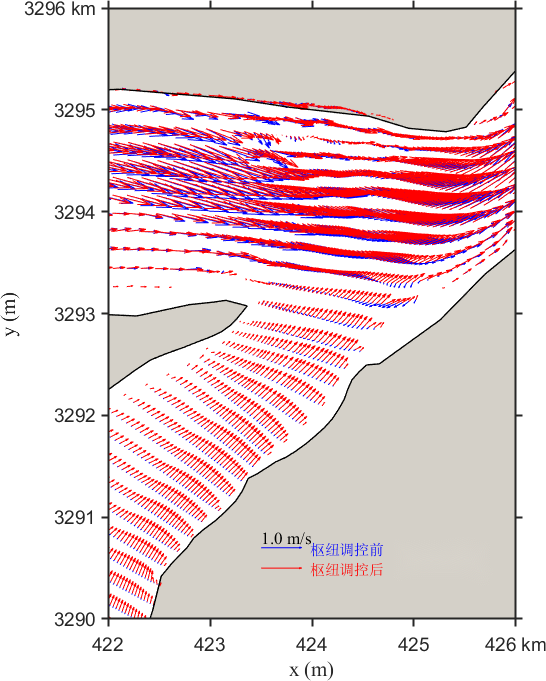
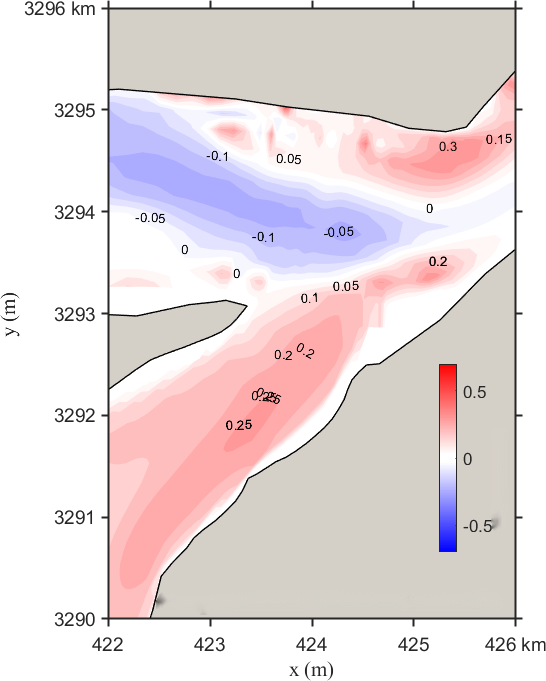
Figure 10. Contour distribution of flow velocity and velocity differences in the Yangtze-Poyang Lake confluence section before and after hub regulation
3.3.3. Scenario 3
Figure 11 illustrates the changes in the local flow field under Scenario 3. The post-regulation flow velocity trend at the lake outlet is similar to that of Scenario 1. The regulation reduces the discharge, resulting in decreased flow velocity at the outlet. The maximum reduction occurs in the middle of the cross-section and gradually lessens toward both banks. The velocity changes in the mainstream section exhibit a layered pattern: significant reduction near the banks and minimal reduction toward the center. In the upper confluence section, the trend reverses, with less velocity reduction near the banks.
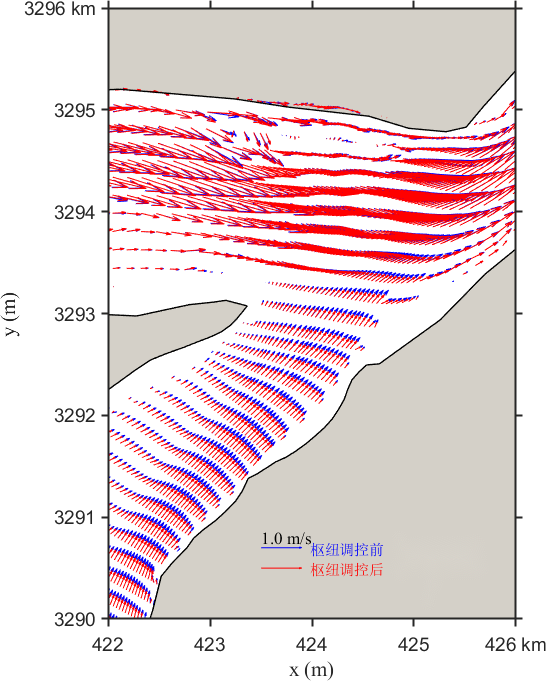
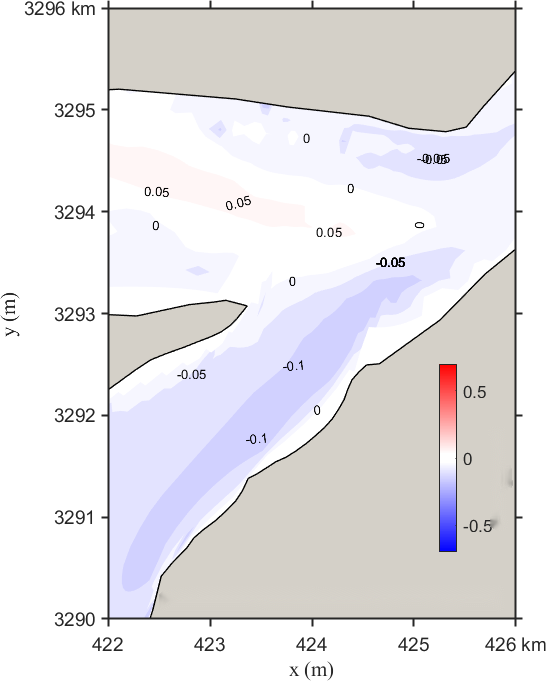
Figure 11. Contour distribution of flow velocity and velocity differences in the Yangtze-Poyang Lake confluence section before and after hub regulation
In summary, under all adverse test scenarios before and after the project, the flow velocity upstream of Hukou in the main stream of the Yangtze River varies within 0.3 m/s, and the downstream variation is within 0.2 m/s. The position of the mainstream does not change significantly. Therefore, the project will not have a notable impact on flow velocity or mainstream position. The influence of the project on flow conditions is acceptable and will not adversely affect navigation.
4. Conclusion
This paper, based on the hub regulation plan, selects three adverse scenarios and, through numerical simulation, explores the impact of the Poyang Lake hydraulic hub project on the local flow conditions of the confluence section of the Yangtze River. The preliminary conclusions are as follows:
(1) The Poyang Lake hub controls discharge from September 1 to the end of March the following year, and has no effect on the Yangtze River during other periods. During the impoundment period from September 1–15, the maximum flow reduction is approximately 3921 m³/s, accounting for about 14% of the flow at Datong. When the incoming flow of the Yangtze River is low, the reduction is more significant. The project mainly affects the Yangtze channel through changes in discharge and the resulting variations in flow conditions and water levels upstream and downstream during the regulation period.
(2) The change in discharge into the Yangtze River due to hub regulation leads to an adjustment in the diversion ratio between branches. The magnitude of adjustment correlates with the regulated discharge volume. However, the overall variation in diversion ratio is relatively small—less than 1.3% in all scenarios.
(3) The impact of the project on the flow velocity and direction in the confluence section is mainly reflected in minor adjustments to the mainstream velocity, with little effect on the position or direction of the mainstream zone. Under all test scenarios, the impact on flow velocity and mainstream position is negligible. The influence on flow conditions is acceptable and does not result in adverse flow conditions that would affect navigation.
(4) The findings provide technical support for further studies on the impact of the project on navigation channels and navigation conditions.
References
[1]. Yang, G., Xu, X., & Li, P. (2015). Research on the construction of a green ecological corridor in the Yangtze River Economic Belt. Progress in Geography, 34(11), 1356–1367.
[2]. Deng, Z., Zhang, X., & Xiao, Y. (2015). Analysis of the evolution of water levels in Poyang Lake and its influencing factors. Journal of Wuhan University (Engineering Edition), 48(5), 615–621.
[3]. Lai, G., Zhang, Z., & Wang, P. (2017). Simulation of the impact of the proposed Poyang Lake hydraulic hub project on the flow of the Yangtze River main stream. Journal of Lake Sciences, 29(3), 521–533.
[4]. Yu, Q., Ma, Q., & You, Z. (2013). Effects of regulation of the Poyang Lake hydraulic hub on water level and flow velocity during the dry season. Yangtze River, 44(17), 18–21, 59.
[5]. Tan, G., Guo, S., & Wang, J. (2013). Study on the evolution patterns of hydrology and water resources in the Poyang Lake eco-economic zone. China Water & Power Press, 05, 289.
Cite this article
Shi,H.;Xu,X.;Deng,L. (2025). Impact of the Poyang Lake Hydraulic Project on local hydrodynamic conditions at the confluence section of the Yangtze River mainstream. Advances in Engineering Innovation,16(5),5-15.
Data availability
The datasets used and/or analyzed during the current study will be available from the authors upon reasonable request.
Disclaimer/Publisher's Note
The statements, opinions and data contained in all publications are solely those of the individual author(s) and contributor(s) and not of EWA Publishing and/or the editor(s). EWA Publishing and/or the editor(s) disclaim responsibility for any injury to people or property resulting from any ideas, methods, instructions or products referred to in the content.
About volume
Journal:Advances in Engineering Innovation
© 2024 by the author(s). Licensee EWA Publishing, Oxford, UK. This article is an open access article distributed under the terms and
conditions of the Creative Commons Attribution (CC BY) license. Authors who
publish this series agree to the following terms:
1. Authors retain copyright and grant the series right of first publication with the work simultaneously licensed under a Creative Commons
Attribution License that allows others to share the work with an acknowledgment of the work's authorship and initial publication in this
series.
2. Authors are able to enter into separate, additional contractual arrangements for the non-exclusive distribution of the series's published
version of the work (e.g., post it to an institutional repository or publish it in a book), with an acknowledgment of its initial
publication in this series.
3. Authors are permitted and encouraged to post their work online (e.g., in institutional repositories or on their website) prior to and
during the submission process, as it can lead to productive exchanges, as well as earlier and greater citation of published work (See
Open access policy for details).
References
[1]. Yang, G., Xu, X., & Li, P. (2015). Research on the construction of a green ecological corridor in the Yangtze River Economic Belt. Progress in Geography, 34(11), 1356–1367.
[2]. Deng, Z., Zhang, X., & Xiao, Y. (2015). Analysis of the evolution of water levels in Poyang Lake and its influencing factors. Journal of Wuhan University (Engineering Edition), 48(5), 615–621.
[3]. Lai, G., Zhang, Z., & Wang, P. (2017). Simulation of the impact of the proposed Poyang Lake hydraulic hub project on the flow of the Yangtze River main stream. Journal of Lake Sciences, 29(3), 521–533.
[4]. Yu, Q., Ma, Q., & You, Z. (2013). Effects of regulation of the Poyang Lake hydraulic hub on water level and flow velocity during the dry season. Yangtze River, 44(17), 18–21, 59.
[5]. Tan, G., Guo, S., & Wang, J. (2013). Study on the evolution patterns of hydrology and water resources in the Poyang Lake eco-economic zone. China Water & Power Press, 05, 289.