


1. Introduction
Guangxi is located in the karst region of Southwest China, characterized by unique geological and hydrological features that make its aquatic ecosystems as fragile as those on the margins of deserts. Once polluted, these environments are difficult to remediate and suffer severe consequences. Water resources in karst areas are strongly influenced by fissures and groundwater systems, making water pollution issues especially prominent. In particular, intensive use of fertilizers and organic materials in agriculture introduces large quantities of nitrate into water bodies, severely degrading water quality [1]. Nitrate pollution is a common environmental issue in agricultural watersheds worldwide. Excessive nitrate loading not only leads to eutrophication and water quality deterioration but also poses risks to human health. In Southwest China’s karst agricultural watersheds, the problem is particularly severe due to frequent fertilizer application and special hydrogeological conditions. Although previous research has explored nitrate sources in water bodies to some extent [2], studies on source attribution and transport mechanisms in karst regions remain limited.
Stable isotope techniques, particularly those involving deuterium (δD), nitrogen (δ¹⁵N), and oxygen (δ¹⁸O), have been widely applied to trace nitrate sources in water bodies. Isotope analysis not only allows tracking of evaporation, precipitation, and groundwater mixing processes but also distinguishes among different nitrate sources (e.g., fertilizers, soils, organic wastes) [3]. In karst regions, stable isotope techniques offer effective tools for identifying nitrate sources and provide critical scientific support for addressing water quality problems [4, 5]. Global and local meteoric water lines (GMWL and LMWL) are commonly used in hydrological and environmental studies to analyze precipitation isotopic characteristics. Craig’s global meteoric water line demonstrates a specific linear relationship between δD-H₂O and δ¹⁸O-H₂O, forming the basis for hydrological cycle studies [6]. Wu et al. established the local meteoric water line for Guilin City, serving as a reference for local water source isotope research [7]. For nitrogen source apportionment, dual isotope techniques involving δ¹⁵N-NO₃⁻ and δ¹⁸O-NO₃⁻ have become important tools. Studies show that δ¹⁵N-NO₃⁻ values in atmospheric deposition range from -13.0‰ to 13.0‰, fertilizer-derived nitrate ranges from -6.0‰ to 6.0‰, and human/animal waste ranges from 4.0‰ to 25.0‰, while soil nitrogen typically ranges from 0.0‰ to 8.0‰. However, overlaps among these ranges, coupled with isotopic fractionation from biogeochemical processes, complicate source identification. To overcome this, Amberger et al. combined δ¹⁵N-NO₃⁻ and δ¹⁸O-NO₃⁻ dual isotope techniques to improve accuracy [8]. Atmospheric nitrate typically has δ¹⁸O-NO₃⁻ values of 25‰ to 70‰, fertilizers and soil nitrogen have ranges of 19‰–25‰ and -5‰–5‰, respectively, and nitrate from wastewaters is usually ≥15‰ [9]. Such research offers new approaches for precisely identifying nitrate sources, which is especially valuable in complex karst environments.
In summary, although stable isotope techniques have been widely used to investigate nitrate sources, research remains scarce in Southwest China's karst agricultural watersheds. This study uses stable isotope analysis of δ¹⁵N-NO₃⁻ and δ¹⁸O-NO₃⁻ to examine nitrate sources in such a setting, providing a scientific basis for water quality protection and pollution control. The Mudong River watershed in the Huixian Wetland of Guilin, Guangxi was selected. Based on sampling and analysis, we evaluated the spatiotemporal variations in nitrate (NO₃⁻) and its isotopic composition (δD-H₂O, δ¹⁸O-H₂O, δ¹⁵N-NO₃⁻, δ¹⁸O-NO₃⁻) and used the SIAR model to quantify the contributions of different sources. This research enriches the application of stable isotope techniques for nitrate source analysis in complex karst environments and provides crucial data support for water quality protection and pollution control, especially for local government planning and sustainable agricultural development.
2. Study area overview
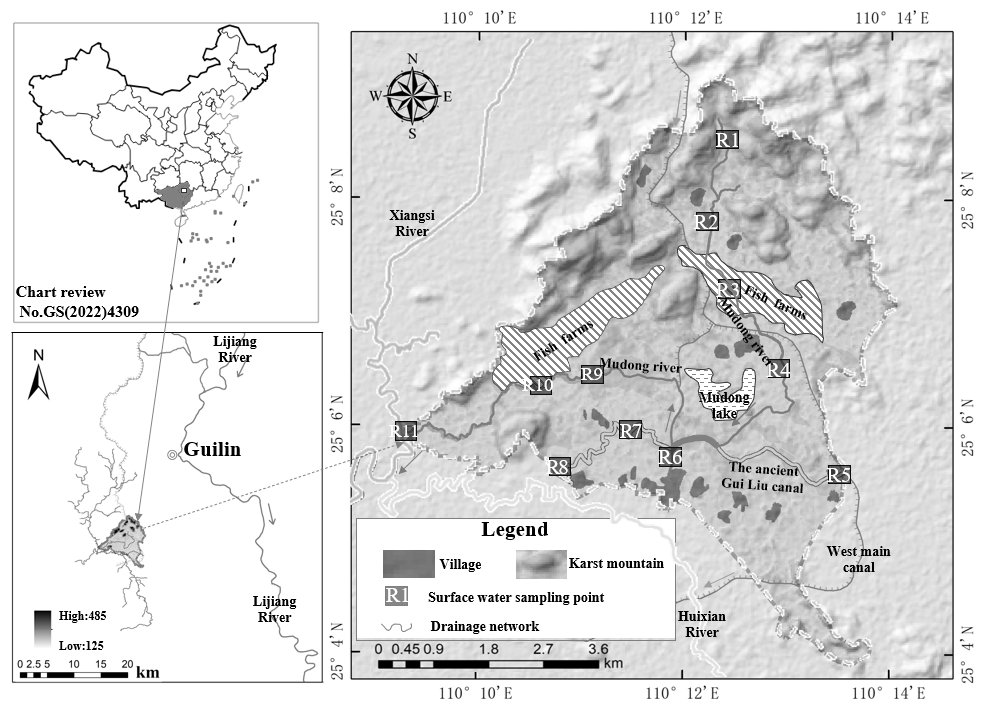
The Mudong River watershed (110°09′–110°14′ E, 25°04′–25°09′ N), with a catchment area of 30 km², is located northwest of Guilin City, Guangxi, China (Figure 1). The watershed has a mild and humid climate, with a long-term average temperature of approximately 20 °C and an average annual evaporation of 1568 mm. It experiences a typical subtropical monsoon climate with abundant rainfall averaging 1800 mm per year. The rainy season (generally from April to September) accounts for about 75–80% of the annual precipitation.
The main soil types in the Mudong watershed include paddy soil, calcareous soil, and red soil. Elevation ranges from 125 m to 485 m. The northern area consists of peak-cluster valleys with higher terrain, while the central region is lower, flatter, and dominated by peak-forest plains (wetlands) interspersed with isolated karst hills. Flat areas include farmland, water bodies, grasslands, orchards, and villages, while the karst hills are covered with shrubs. The Mudong River originates from surface karst springs in the northern rocky mountains and flows south through the core of the Huixian Karst Wetland, a structural basin containing the ancient Guiliu Canal, Suidong Lake, ponds, and marshes. It then turns westward and eventually joins the Xiangsi River. The total river length is about 15 km, with widths ranging from 2.0 m to 27 m, depths from 0.15 m to 2.16 m, and flow velocities ranging from approximately 0.001 m/s to 0.43 m/s.
3. Methods and data
3.1. Water sampling and analysis
A total of 33 water samples were collected at sampling sites R1 to R11 (Figure 1) in the Mudong catchment during December 2020, April 2021, and April 2025. The abundance values of hydrogen and oxygen isotopes in water (δD-H₂O and δ¹⁸O-H₂O) and nitrogen and oxygen isotopes in nitrate (δ¹⁵N-NO₃⁻ and δ¹⁸O-NO₃⁻) were measured as the key analytical data for this study. All samples were also analyzed for concentrations of total nitrogen (TN), nitrate (NO₃⁻), and ammonium (NH₄⁺) to support the analysis of the spatiotemporal distribution differences of nitrate within the catchment. Field sampling was conducted in accordance with the Technical Specifications for Monitoring of Surface Water and Wastewater (HJ/T 91—2002), with adjustments for actual field conditions. Water samples were collected directly from the river using a water sampler and stored in pre-rinsed 1000 mL amber glass bottles. At each sampling site, field parameters including water temperature, pH, and dissolved oxygen (DO) were recorded. After sampling, all water samples were transported to the laboratory on the same day and stored at 4 °C under refrigerated conditions. Within 48 hours, the following analyses were performed: TN concentrations were determined using the alkaline persulfate digestion UV spectrophotometric method (GB 11894—89); NO₃⁻ concentrations by UV spectrophotometry (HJ/T 346—2007); NH₄⁺ concentrations by the Nessler’s reagent spectrophotometric method (HJ 535—2009).
For isotope analysis, water samples were filtered in the laboratory using 0.45 μm membrane filters and stored in 50 mL polyethylene bottles, sealed, and transported to the Environmental Stable Isotope Laboratory at the Chinese Academy of Agricultural Sciences. Hydrogen and oxygen isotopes in water (δD-H₂O and δ¹⁸O-H₂O) were measured using a Picarro L1115-i liquid water and water vapor isotope analyzer. Nitrogen and oxygen isotopes in nitrate (δ¹⁵N-NO₃⁻ and δ¹⁸O-NO₃⁻) were measured using the denitrifier method combined with a Delta V-plus stable isotope ratio mass spectrometer.
3.2. Data analysis and processing
Data preprocessing and descriptive statistics were performed using Excel and SPSS Statistics software to evaluate the statistical significance of the elements. Graphs and maps were produced using Origin and ArcGIS software. The study used the Stable Isotope Analysis in R (SIAR) mixing model [10] to estimate the proportional contributions of different nitrate sources. The SIAR model is based on a Dirichlet distribution within a Bayesian framework. By defining k sources, n mixtures, and j isotopes while accounting for isotopic fractionation effects, the model can be represented as follows:
where:
4. Results and discussion
4.1. Surface water chemical characteristics
According to long-term monitoring data from 2020 to 2025 (Table 1), the concentrations of total nitrogen (TN) and nitrate-nitrogen (NO₃⁻-N) in the Mudong River showed considerable variability, ranging from 0.111 to 9.50 mg/L and 0.01 to 6.691 mg/L, respectively. The concentration of ammonium-nitrogen (NH₄⁺-N) ranged from 0.01 to 5.69 mg/L. Under the requirements of the Guilin City Water Function Zoning Plan, nitrogen and phosphorus indicators in Mudong catchment surface water are assessed against the Class III water standard of Environmental Quality Standards for Surface Water (GB 3838–2002). Exceedance thresholds are defined as TN > 1.0 mg/L, NH₄⁺-N > 1.0 mg/L, and NO₃⁻-N > 10 mg/L. During the monitoring period, 70.6% of water samples from the Mudong River had TN concentrations exceeding 1.0 mg/L. The exceedance rates for NO₃⁻-N and NH₄⁺-N were 0.3% and 12.0%, respectively. On average, NO₃⁻-N and NH₄⁺-N accounted for 43.3% and 26.3% of TN, respectively, indicating that NO₃⁻-N is the primary form of nitrogen loss in the river.
Mean dissolved oxygen concentrations at sampling sites ranged from 5.43 to 8.96 mg/L, mean pH values from 7.2 to 7.5, and mean electrical conductivity from 185.8 to 403.1 μS/cm. Overall, spatial variability was greatest for dissolved oxygen, followed by conductivity, and was smallest for pH.
|
Sampling Site |
Range (mean) |
||||||||
|
Concentration(mg·L-1) |
Dissolved Oxygen(mg/L) |
pH |
Conductivity (μS/cm) |
||||||
|
TN |
NH4+-N |
NO3--N |
|||||||
|
R1 |
0.34~6.83(2.35 ) |
0.01~0.78(0.14) |
0.02~5.01(1.98) |
3.4~36.3(8.96) |
7.0~8.0(7.4) |
364~450(403.1) |
|||
|
R2 |
0.12~4.87(1.23 ) |
0.02~1.17(0.24) |
0.01~5.01(0.98) |
1.4~19.5(6.80) |
6.3~8.0(7.4) |
82~461(185.8) |
|||
|
R3 |
1.13~7.27( 3.16) |
0.01~1.95(0.23) |
0.23~6.69(2.20) |
3.9~20.1(8.52) |
6.0~8.4(7.5) |
143~433(325.9) |
|||
|
R4 |
0.30~9.50( 2.32) |
0.04~5.69(0.78) |
0.08~4.05(1.07) |
3.1~41.0(7.15) |
6.9~8.7(7.4) |
197~385(308.8) |
|||
|
R5 |
0.61~7.52( 2.18) |
0.10~0.88(0.29) |
0.11~3.16(1.23) |
1.8~10.7(5.43) |
7.0~7.8(7.3) |
238~375(300.5) |
|||
|
R6 |
0.08~7.66( 1.98) |
0.07~0.72(0.30) |
0.05~4.18(1.08) |
0.9~44.0(6.48) |
6.8~7.7(7.3) |
238~333(291.1) |
|||
|
R7 |
0.11~7.29( 1.54) |
0.20~2.79(0.66) |
0.01~2.39(0.70) |
0.4~30.4(6.37) |
5.9~7.7(7.2) |
151~395(332.0) |
|||
|
R8 |
0.07~8.46(1.88 ) |
0.12~5.01(0.67) |
0.01~3.16 (1.04) |
0.3~14.6(7.10) |
5.7~7.7(7.4) |
209~396(307.4) |
|||
|
R9 |
0.15~7.61(1.47 ) |
0.10~1.08(0.45) |
0.02~3.13(0.82) |
1.3~18.4(6.47) |
6.7~8.3(7.4) |
233~313(274.2) |
|||
|
R10 |
0.02~7.05( 2.08) |
0.08~2.71(0.75) |
0.01~5.25(0.97) |
1.9~21.4(6.18) |
6.8~8.3(7.3) |
223~317(279.2) |
|||
|
R11 |
1.58~0.35(2.72 ) |
0.11~2.29(1.04) |
0.12~3.79 (1.09) |
2.7~25.9(8.79) |
6.8~8.5(7.4) |
211~338(284.1) |
|||
4.2. Nitrate transport and transformation processes
Table 2 shows that the δD-H₂O and δ¹⁸O-H₂O values at sampling sites R1 to R11 in the Mudong River ranged from −37.957‰ to −3.567‰ and −6.407‰ to −0.116‰, respectively. Along the north-to-south flow path from R1→R4→R6, δD-H₂O and δ¹⁸O-H₂O values gradually became enriched, indicating an increasing contribution from surface runoff. In contrast, along the east-to-west flow path from R6→R9→R11, δD-H₂O and δ¹⁸O-H₂O values became progressively depleted, suggesting an increased proportion of groundwater recharge.
|
Sampling Site |
Minimum~Maximum (Mean) |
|||
|
δD-H2O |
δ18O-H2O |
δ15N-NO3‾ |
δ18O-NO3‾ |
|
|
R1 |
-37.957~-35.594(-36.511) |
-6.407~-5.594 (-5.905) |
4.589 ~12.816 (9.094) |
4.201~8.967 (6.655) |
|
R2 |
-32.995~-14.771 (-25.385) |
-5.496~-2.348 (-4.205) |
3.427~9.146 (6.981) |
6.157~9.931(7.629) |
|
R3 |
-27.429~-23.190 (-24.990) |
-4.977~-2.533 (-3.765) |
1.920~13.328(8.675) |
3.510~9.678 (7.041) |
|
R4 |
-22.972~-14.062 (-19.800) |
-4.050~-1.526 (-2.374) |
9.969~14.993(12.151) |
2.251~9.899 (6.487) |
|
R5 |
-24.300~-7.506 (-17.336 ) |
-3.800~0.340 (-2.137) |
6.952~12.000(9.691) |
0.443~11.264(6.469) |
|
R6 |
-30.301~-3.567 (-17.833) |
-4.717~0.116 (-2.789) |
5.815~8.433 (6.783) |
0.765~19.266(8.986) |
|
R7 |
-31.865~-11.280 (-22.601) |
-5.363~-1.086 (-3.527) |
6.702~10.931(8.858) |
2.146~7.802 (5.472) |
|
R8 |
-33.420~-5.498 (-21.847) |
-5.430~-0.551 (-3.449) |
6.200~13.150(9.540) |
1.120~6.536 (4.454) |
|
R9 |
-28.265~-3.742 (-18.580) |
-4.348~0.053 (-2.861) |
-1.651~12.280 (4.532) |
0.037~8.203 (5.180) |
|
R10 |
-29.475~-3.974 (-20.057) |
-4.412~-0.194 (-2.984) |
6.506~10.792(7.432) |
2.302~7.134 (5.312) |
|
R11 |
-32.499~-4.719 (-22.117) |
-5.012~-0.229 (-3.381) |
5.642~10.843 (7.495) |
1.075~7.900(5.118) |
The δD-H₂O and δ¹⁸O-H₂O values in the Mudong River water samples show considerable dispersion and strong spatial variability, indicating that water migration processes have likely undergone varying degrees of evaporation and mixing. The northern recharge area of the Mudong catchment consists mainly of thin, discontinuous soils over exposed karst rock, allowing rapid infiltration of atmospheric precipitation (Figure 2). This leads to relatively scattered δD-H₂O and δ¹⁸O-H₂O signatures in sites R1–R2. The flat central flow area is characterized by covered karst terrain with gentle topography and slower runoff. This region is dominated by cropland and water bodies, where evaporation is intense, resulting in δ¹⁸O-H₂O enrichment in river sections R3–R5.

As shown in Table 2, δ¹⁵N-NO₃⁻ and δ¹⁸O-NO₃⁻ values in water samples from R1–R11 ranged from −1.651‰ to 14.993‰ and 0.037‰ to 19.266‰, respectively. Referring to the δ¹⁵N-NO₃⁻ and δ¹⁸O-NO₃⁻ source domains defined by Kendall et al [11]., values from the December 2020, April 2021, and April 2025 sampling campaigns were plotted in Figure 3.
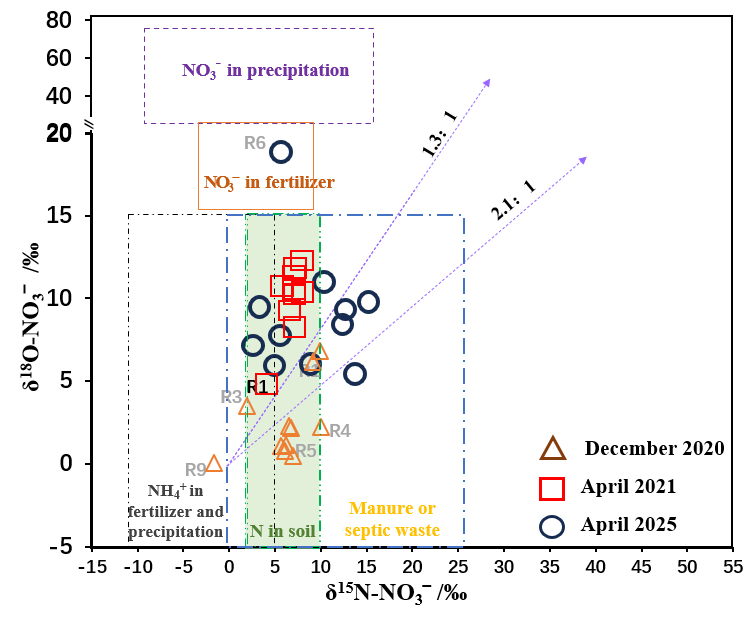
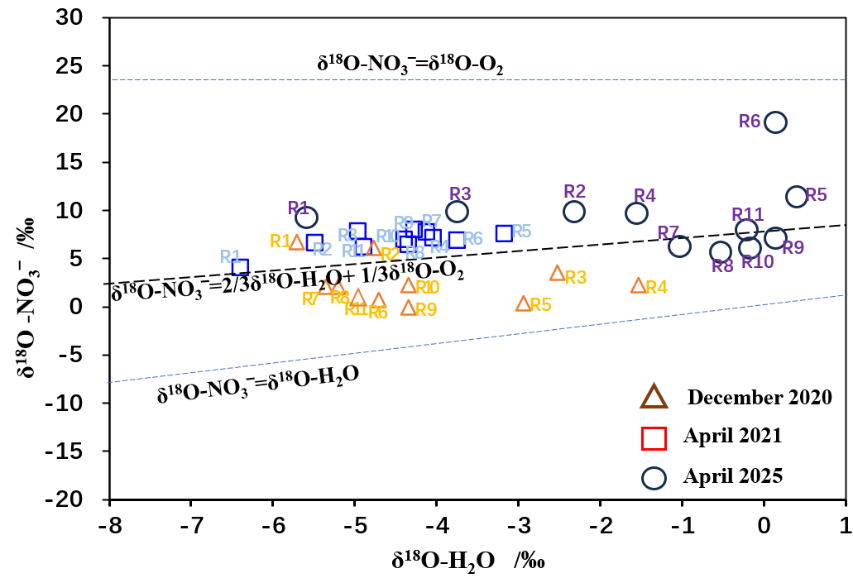
Nitrate in water bodies is influenced not only by source inputs but also by isotopic fractionation effects associated with biogeochemical processes such as denitrification and nitrification. Research indicates that dissolved oxygen (DO) concentrations exceeding 2.0 mg/L significantly suppress denitrification, though minor rates may occur at 2–6 mg/L [12]. As shown in Table 1, mean DO concentrations in the Mudong River samples were all ≥5.43 mg/L, suggesting that denitrification was not a dominant process during sampling. Studies show that during denitrification, NO₃⁻ is reduced to N₂ and N₂O, leading to decreased NO₃⁻ concentrations and enrichment of δ¹⁵N-NO₃⁻ and δ¹⁸O-NO₃⁻. The ratio of δ¹⁵N-NO₃⁻ to δ¹⁸O-NO₃⁻ enrichment typically falls between 1.3:1 and 2.1:1 [13], as seen in Figure 3. Nitrification typically produces δ¹⁸O-NO₃⁻ values between −10‰ and 10‰. Figure 4 shows that δ¹⁸O-NO₃⁻ values in Mudong River water samples all fall within this range, indicating that nitrification is the main process governing NO₃⁻ transformation in the study area. Generally, microbially induced nitrification incorporates two oxygen atoms from ambient water and one from dissolved O₂:
δ18O-NO3‾=
where the theoretical δ¹⁸O-O₂ value is 23.5‰. Figure 4 shows that most observed δ¹⁸O-NO₃⁻ values in the study area cluster near this theoretical value, supporting nitrification as the dominant process for δ¹⁸O-NO₃⁻ generation. Overall, measured δ¹⁸O-NO₃⁻ values were generally lower than theoretical values during the dry season but higher during the rainy season. On one hand, stronger evaporation and higher DO concentrations in the dry season lead to δ¹⁸O-H₂O enrichment, making the theoretical δ¹⁸O-NO₃⁻ value higher than measured values. On the other hand, elevated δ¹⁸O-NO₃⁻ values during the rainy season reflect the large contribution of atmospheric precipitation, yielding measured values above the theoretical line. This suggests that denitrification primarily occurs in low-permeability, thick-soil depressions of the middle and lower catchment areas with covered karst landscapes. In contrast, the fast-flowing upper reaches, characterized by exposed rock and thin soils, are less favorable for denitrification.
4.3. Quantitative analysis of nitrate sources
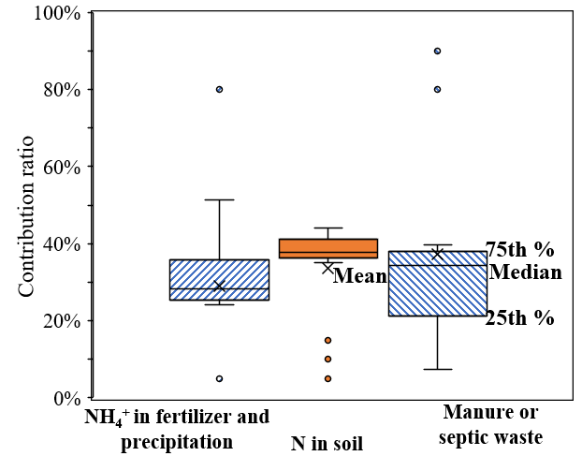
Figure 3 shows that the primary sources of NO₃⁻ in the study area’s water include fertilizer and rainfall-derived NH₄⁺, soil N, and animal manure/domestic sewage, each with distinct nitrogen and oxygen isotopic signatures and fractionation mechanisms. Overall, the study area’s water exhibits clear nitrification characteristics and negligible denitrification. Therefore, when applying the SIAR model to calculate the contribution rates of different NO₃⁻ sources, the fractionation factor CjkC_{jk}Cjk was set to 0. Results from the SIAR model (Figure 5) indicate that the dominant NO₃⁻ sources in the river water are soil N and animal manure/domestic sewage. The Mudong River serves as the base-level discharge surface of the study area, with river water levels generally lower than groundwater levels for most of the year. Consequently, soil water is the primary source of river recharge. Within the catchment, intensive livestock farming and agricultural activities, combined with shallow, discontinuous soil layers that have relatively low water retention but high permeability, lead to higher contributions from soil N and animal manure/domestic sewage to riverine NO₃⁻, with median contribution rates of 37.8% and 34.4%, respectively. The median contribution rate from fertilizer and rainfall-derived NH₄⁺ was 28.4%.
4.4. Analysis of the impact of karst subsurface properties on river nitrate
In agricultural catchments of the southwest China karst region, nitrate concentrations in surface water are significantly influenced by watershed hydrogeological conditions and subsurface characteristics. Generally, the northern recharge area and western discharge area of the catchment exhibit higher surface water nitrate concentrations, closely related to local topography, geomorphology, and hydrology [14]. In these zones, the presence of exposed karst landforms results in rapid water flow and stronger hydrodynamic conditions. This enhances the frequency of water exchange between recharge and discharge areas, facilitating the accumulation of pollutants in surface water, especially during the rainy season when agricultural non-point source pollution intensifies nitrogen contamination. In the relatively flat central runoff area, which hosts intensive fish ponds and rice paddies, agricultural activities are highly concentrated. Fertilization and irrigation practices directly increase nitrogen loads in surface water. Given the gentle terrain and slower runoff in these regions, nitrate concentrations are not rapidly diluted or exchanged, resulting in sustained high levels in the water. Meanwhile, significant domestic sewage discharge also occurs in residential areas of the central catchment, either directly or indirectly entering surface water and further aggravating nitrate pollution.
Moreover, the catchment’s karst hydrogeological conditions play a critical role in the cycling of surface water nitrate. The unique karst features create complex interactions between groundwater and surface water, where the low flow velocity of groundwater slows the transfer of pollutants between these systems, promoting nitrate accumulation [15]. These hydrogeological characteristics directly influence the spatial distribution of nitrate concentrations in surface water, leading to marked differences in water pollution levels across the catchment. Clearly, the Mudong catchment’s hydrogeological properties, associated landforms, land-use patterns, and human activities all have direct or indirect impacts on the sources, transport, and transformation of NO₃⁻ in surface water.
5. Conclusion
By analyzing hydrogen–oxygen and nitrogen–oxygen isotopes as well as nitrogen species concentrations (TN, NH₄⁺-N, and NO₃⁻-N) in water samples from the Mudong River catchment between 2020 and 2025, this study found that total nitrogen (TN) was predominantly in the form of NO₃⁻, with an exceedance rate of 70.6%. The δ¹⁵N-NO₃⁻ and δ¹⁸O-NO₃⁻ values ranged from −1.651‰ to 14.993‰ and 0.037‰ to 19.266‰, respectively, indicating that nitrification was the dominant process controlling nitrate transformation. Median contribution rates for soil N and animal manure/domestic sewage were 37.8% and 34.4%, respectively. Karst geomorphology, land use, and human activities were found to significantly influence nitrate transport and transformation. These findings provide valuable data support for water quality protection in agricultural catchments of the southwest China karst region. Future work can further integrate isotopic techniques to advance research on coordinated control of multiple pollution sources, offering a scientific basis for local governments to develop sustainable agricultural policies.
Funding:This research was funded by the Guangxi Natural Science Foundation for Young Scientists Program (Grant No. 2024GXNSFBA010429), and Basic Competence Enhancement Project for Young and Middle-aged Teachers in Guangxi Universities (Grant No. 2024KY0062), and 2024 Cultivation Project for National Natural Science Foundation of Guangxi Normal University.
References
[1]. Chen, J., Luo, M., Ma, R., Zhou, H., Zou, S., & Gan, Y. (2020). Nitrate distribution under the influence of seasonal hydrodynamic changes and human activities in Huixian karst wetland, South China.Journal of Contaminant Hydrology, 234, 103700. https: //doi.org/10.1016/j.jconhyd.2020.103700
[2]. Zhao, Y., Zheng, B., Jia, H., & Chen, Z. (2019). Determination sources of nitrates into the Three Gorges Reservoir using nitrogen and oxygen isotopes.Science of The Total Environment,687: 128-136. https: //doi.org/10.1016/j.scitotenv.2019.06.073
[3]. Zhang, Y., Shi, P., Li, F., Wei, A., Song, J., & Ma, J. (2018). Quantification of nitrate sources and fates in rivers in an irrigated agricultural area using environmental isotopes and a Bayesian isotope mixing model.Chemosphere,208, 493-501. https: //doi.org/10.1016/j.chemosphere.2018.05.164
[4]. Husic, A., Fox, J., Adams, E., Pollock, E., Ford, W., Agouridis, C., & Backus, J. (2020). Quantification of nitrate fate in a karst conduit using stable isotopes and numerical modeling.Water Research,170, 115348. https: //doi.org/10.1016/j.watres.2019.115348
[5]. Yue, F., Li, S., Zhong, J., & Liu, J. ( 2018) Evaluation of factors driving seasonal nitrate variations in surface and underground systems of a karst catchment.Vadose Zone Journal, 17(1), 1-10. https: //doi.org/10.2136/vzj2017.04.0071
[6]. Craig, H. (1961). Isotopic variations in Meteoric waters.Science,133(3465), 1702-1703. DOI: 10.1126/science.133.3465.1702
[7]. Wu, X., Zhu, X., Zhang, M., Bai, X., & Zhang, L. (2013). High-resolution stable isotope record of atmospheric precipitation in Guilin.Resources and Environment in the Yangtze Basin,22(2), 182-188. (in Chinese with English abstract)
[8]. Amberger, A., & Schmidt, H. (1987) Natürliche isotopengehalte von Nitrat als Indikatoren für dessen Herkunft.Geochimica et Cosmochimica Acta,51(10), 2699-2705. https: //doi.org/10.1016/0016-7037(87)90150-5
[9]. Nerantzis, K., Ioannis, M., Maria-Margarita, N., Matthias, B., Kyriaki, K., Efthimia, K. Manassis, M., Alexandra, I., George, V., & Konstantinos, V. (2020). Origin, implications and management strategies for nitrate pollution in surface and ground waters of Anthemountas basin based on a δ15N-NO3‾ and δ18O-NO3‾ isotope approach.Science of The Total Environment, 724, 138211. https: //doi.org/10.1016/j.scitotenv.2020.138211
[10]. Andrew, C., Richard, I., Stuart, B., & Andrew, L.(2010). Source Partitioning Using Stable Isotopes: Coping with Too Much Variation.Plos One,5(3), e9672. https: //doi.org/10.1371/journal.pone.0009672
[11]. Kendall, C., Elliott, E., & Wankel, S. (2007). Tracing Anthropogenic Inputs of Nitrogen to Ecosystems.Blackwell.
[12]. Chai, H., Xiang, Y., Chen, R., Shao, Z., Gu, L., Li, L., & He, Q., (2019). Enhanced simultaneous nitrification and denitrification in treating low carbon-to-nitrogen ratio wastewater: treatment performance and nitrogen removal pathway.Bioresource Technology,280, 51–58. https: //doi.org/10.1016/j.biortech.2019.02.022
[13]. Gibrilla, A., Fianko, J., Ganyaglo, R., Adomako, D., Anornu, G., & Zakaria, N. (2020). Nitrate contamination and source apportionment in surface and groundwater in Ghana using dual isotopes (δ15N and δ18O-NO3‾) and a Bayesian isotope mixing model.Journal of Contaminant Hydrology, 233, 103658. https: //doi.org/10.1016/j.jconhyd.2020.103658
[14]. Dai, J., Pan, L., Deng, Y., Wan, Z., & Xia, R. (2025). Modified SWAT Model for Agricultural Watershed in Karst Area of Southwest China. Agriculture,15(2), 192. https: //doi.org/10.3390/agriculture15020192
[15]. Ogrinc, N., Tamše, S., Zavadlav, S., Vrzel, J., & Jin, L. (2007). Evaluation of geochemical processes and nitrate pollution sources at the Ljubljansko polje aquifer (Slovenia): A stable isotope perspective.Science of The Total Environment,646, 1588-1600. https: //doi.org/10.1016/j.scitotenv.2018.07.245
Cite this article
Pan,L.;Han,R.;Luo,Z. (2025). Research on the sources of nitrate in agricultural watershed in karst areas of Southwest China based on stable isotopes. Advances in Engineering Innovation,16(7),21-28.
Data availability
The datasets used and/or analyzed during the current study will be available from the authors upon reasonable request.
Disclaimer/Publisher's Note
The statements, opinions and data contained in all publications are solely those of the individual author(s) and contributor(s) and not of EWA Publishing and/or the editor(s). EWA Publishing and/or the editor(s) disclaim responsibility for any injury to people or property resulting from any ideas, methods, instructions or products referred to in the content.
About volume
Journal:Advances in Engineering Innovation
© 2024 by the author(s). Licensee EWA Publishing, Oxford, UK. This article is an open access article distributed under the terms and
conditions of the Creative Commons Attribution (CC BY) license. Authors who
publish this series agree to the following terms:
1. Authors retain copyright and grant the series right of first publication with the work simultaneously licensed under a Creative Commons
Attribution License that allows others to share the work with an acknowledgment of the work's authorship and initial publication in this
series.
2. Authors are able to enter into separate, additional contractual arrangements for the non-exclusive distribution of the series's published
version of the work (e.g., post it to an institutional repository or publish it in a book), with an acknowledgment of its initial
publication in this series.
3. Authors are permitted and encouraged to post their work online (e.g., in institutional repositories or on their website) prior to and
during the submission process, as it can lead to productive exchanges, as well as earlier and greater citation of published work (See
Open access policy for details).
References
[1]. Chen, J., Luo, M., Ma, R., Zhou, H., Zou, S., & Gan, Y. (2020). Nitrate distribution under the influence of seasonal hydrodynamic changes and human activities in Huixian karst wetland, South China.Journal of Contaminant Hydrology, 234, 103700. https: //doi.org/10.1016/j.jconhyd.2020.103700
[2]. Zhao, Y., Zheng, B., Jia, H., & Chen, Z. (2019). Determination sources of nitrates into the Three Gorges Reservoir using nitrogen and oxygen isotopes.Science of The Total Environment,687: 128-136. https: //doi.org/10.1016/j.scitotenv.2019.06.073
[3]. Zhang, Y., Shi, P., Li, F., Wei, A., Song, J., & Ma, J. (2018). Quantification of nitrate sources and fates in rivers in an irrigated agricultural area using environmental isotopes and a Bayesian isotope mixing model.Chemosphere,208, 493-501. https: //doi.org/10.1016/j.chemosphere.2018.05.164
[4]. Husic, A., Fox, J., Adams, E., Pollock, E., Ford, W., Agouridis, C., & Backus, J. (2020). Quantification of nitrate fate in a karst conduit using stable isotopes and numerical modeling.Water Research,170, 115348. https: //doi.org/10.1016/j.watres.2019.115348
[5]. Yue, F., Li, S., Zhong, J., & Liu, J. ( 2018) Evaluation of factors driving seasonal nitrate variations in surface and underground systems of a karst catchment.Vadose Zone Journal, 17(1), 1-10. https: //doi.org/10.2136/vzj2017.04.0071
[6]. Craig, H. (1961). Isotopic variations in Meteoric waters.Science,133(3465), 1702-1703. DOI: 10.1126/science.133.3465.1702
[7]. Wu, X., Zhu, X., Zhang, M., Bai, X., & Zhang, L. (2013). High-resolution stable isotope record of atmospheric precipitation in Guilin.Resources and Environment in the Yangtze Basin,22(2), 182-188. (in Chinese with English abstract)
[8]. Amberger, A., & Schmidt, H. (1987) Natürliche isotopengehalte von Nitrat als Indikatoren für dessen Herkunft.Geochimica et Cosmochimica Acta,51(10), 2699-2705. https: //doi.org/10.1016/0016-7037(87)90150-5
[9]. Nerantzis, K., Ioannis, M., Maria-Margarita, N., Matthias, B., Kyriaki, K., Efthimia, K. Manassis, M., Alexandra, I., George, V., & Konstantinos, V. (2020). Origin, implications and management strategies for nitrate pollution in surface and ground waters of Anthemountas basin based on a δ15N-NO3‾ and δ18O-NO3‾ isotope approach.Science of The Total Environment, 724, 138211. https: //doi.org/10.1016/j.scitotenv.2020.138211
[10]. Andrew, C., Richard, I., Stuart, B., & Andrew, L.(2010). Source Partitioning Using Stable Isotopes: Coping with Too Much Variation.Plos One,5(3), e9672. https: //doi.org/10.1371/journal.pone.0009672
[11]. Kendall, C., Elliott, E., & Wankel, S. (2007). Tracing Anthropogenic Inputs of Nitrogen to Ecosystems.Blackwell.
[12]. Chai, H., Xiang, Y., Chen, R., Shao, Z., Gu, L., Li, L., & He, Q., (2019). Enhanced simultaneous nitrification and denitrification in treating low carbon-to-nitrogen ratio wastewater: treatment performance and nitrogen removal pathway.Bioresource Technology,280, 51–58. https: //doi.org/10.1016/j.biortech.2019.02.022
[13]. Gibrilla, A., Fianko, J., Ganyaglo, R., Adomako, D., Anornu, G., & Zakaria, N. (2020). Nitrate contamination and source apportionment in surface and groundwater in Ghana using dual isotopes (δ15N and δ18O-NO3‾) and a Bayesian isotope mixing model.Journal of Contaminant Hydrology, 233, 103658. https: //doi.org/10.1016/j.jconhyd.2020.103658
[14]. Dai, J., Pan, L., Deng, Y., Wan, Z., & Xia, R. (2025). Modified SWAT Model for Agricultural Watershed in Karst Area of Southwest China. Agriculture,15(2), 192. https: //doi.org/10.3390/agriculture15020192
[15]. Ogrinc, N., Tamše, S., Zavadlav, S., Vrzel, J., & Jin, L. (2007). Evaluation of geochemical processes and nitrate pollution sources at the Ljubljansko polje aquifer (Slovenia): A stable isotope perspective.Science of The Total Environment,646, 1588-1600. https: //doi.org/10.1016/j.scitotenv.2018.07.245