


1. Introduction
Since the beginning of the twenty-first century, rapid economic development has been accompanied by increasingly severe global climate change, with carbon emissions being one of the key drivers of global warming [1, 2]. In 2020, President Xi Jinping delivered an important address at the 75th Session of the United Nations General Assembly, proposing major strategic arrangements to accelerate the formation of green modes of production and lifestyles and making a significant commitment to carbon neutrality [3]. In recent years, global carbon dioxide emissions have continued to rise. According to the International Energy Agency’s 2023 CO₂ Emissions Report, global CO₂ emissions in 2023 increased by 410 million tonnes, a growth rate of 1.1%, reaching a record high of 37.4 billion tonnes. China’s CO₂ emissions in 2023 reached 12.6 billion tonnes, about 4% higher than in 2022. In response, China will adopt stronger policies and measures to strive to ensure the realization of the major goals of carbon peaking and carbon neutrality, and to make greater efforts and contributions toward achieving the objectives of the Paris Agreement.
Land, as the carrier of economic development, exerts a significant influence on both carbon emissions and carbon sequestration through changes in its utilization [4-6]. During the process of urbanization and the formation of urban agglomerations, patterns of land use have undergone rapid transformation, most notably characterized by the large-scale conversion of agricultural and ecological land into construction land. Such shifts in urban land use not only alter the structure and function of terrestrial ecosystems but also impair their carbon sink capacity, ultimately leading to a continuous rise in the total volume and rate of carbon emissions [7-11]. Statistics indicate that carbon emissions resulting from urban land use change account for approximately one-third of total emissions caused by human activities, second only to those from fossil fuel combustion [12]. Therefore, examining land use changes in cities and urban agglomerations holds considerable significance for achieving China’s “dual carbon” goals.
In recent years, research on the spatiotemporal evolution characteristics and driving factors of the carbon budget in regional urban agglomerations and individual cities has gradually become a hotspot. At the scale of a single urban agglomeration, Cheng et al. [13] calculated the carbon budget of the Lanxi Urban Agglomeration from 2000 to 2020 based on nighttime light data and Net Primary Productivity (NPP) data, in order to explore its spatiotemporal differentiation patterns. At the scale of regional urban agglomerations, Xu [14], using the dataset of CO₂ emissions in Chinese cities released by the China Urban Greenhouse Gas Working Group, examined the overall characteristics, composition, spatial distribution, transformation patterns of carbon emissions, as well as the structural and spatial characteristics of carbon sinks in China’s five major urban agglomerations. Liu et al. [15] employed the Enhanced Vegetation Index, adjusted nighttime light index, and LandScan population data to construct a model for estimating urban carbon emissions in different regions of China, thereby improving the understanding of spatiotemporal and regional differences in CO₂ emissions at the urban scale and providing a scientific basis for formulating feasible CO₂ reduction policies. Zhu et al. [16] using a geographic detector, analyzed the driving factors influencing the coupling coordination degree between carbon emission reduction and high-quality economic development in the Yangtze River Delta Urban Agglomeration from 2006 to 2021 from both temporal and spatial perspectives. Regarding the influencing factors and mechanisms of the carbon budget, Song [17] integrated various socioeconomic data and applied both the Ordinary Least Squares (OLS) model and Geographically Weighted Regression (GWR) model to investigate the mechanisms by which factors influence per capita carbon emissions from road transportation in different regions of the Central Plains Urban Agglomeration over multiple periods, and proposed recommendations for achieving carbon peaking in road transportation. Zhao et al. [18], by integrating the DMSP-OLS and NPP-VIIRS nighttime light datasets, examined the spatiotemporal evolution and influencing factors of carbon emissions from urban residents in China, concluding that extreme weather events and energy use efficiency have significant impacts on carbon emissions.
In summary, there has been no study thus far that approaches the analysis of the overall spatial distribution pattern and driving mechanisms of the carbon budget from the perspective of all 19 urban agglomerations in China. Therefore, based on 2022 land use data for China, this study calculates the carbon budget of the 19 urban agglomerations, processes the data using spatial autocorrelation analysis and hot spot analysis in ArcGIS 10.2 to obtain the spatial distribution characteristics of the carbon budget, and further applies correlation analysis and regression modeling to examine the influencing factors. The aim is to provide theoretical support for optimizing land use and achieving sustainable development of China’s urban agglomerations under the “dual carbon” framework.
2. Study area overview
This study takes as its research area the 19 urban agglomerations mentioned in the National New-type Urbanization Plan (2014-2020), which are currently at different stages of development and will undertake different missions in the course of future development. Referring to relevant studies [19, 20], these 19 urban agglomerations are categorized into six major regions—North China, East China, Northeast China, Central-South China, Southwest China, and Northwest China—as shown in Table 1.
|
Region |
Urban Agglomeration |
|
North China |
Beijing-Tianjin-Hebei Urban Agglomeration, Hohhot-Baotou-Ordos-Yulin Urban Agglomeration, Central Shanxi Urban Agglomeration |
|
East China |
Shandong Peninsula Urban Agglomeration, Yangtze River Delta Urban Agglomeration, West Coast of the Strait Urban Agglomeration |
|
Northeast China |
Harbin-Changchun Urban Agglomeration, Central-Southern Liaoning Urban Agglomeration |
|
Central-South China |
Central Plains Urban Agglomeration, Middle Reaches of the Yangtze River Urban Agglomeration, Pearl River Delta Urban Agglomeration, Beibu Gulf Urban Agglomeration |
|
Southwest China |
Chengdu-Chongqing Urban Agglomeration, Central Yunnan Urban Agglomeration, Central Guizhou Urban Agglomeration |
|
Northwest China |
Northern Tianshan Urban Agglomeration, Ningxia Yellow River Urban Agglomeration, Lanxi Urban Agglomeration, Guanzhong Plain Urban Agglomeration |
3. Data sources and research methods
3.1. Data sources
The primary data used in this study include: (1) Land Use Data: Sourced from the China Land Cover Dataset (CLCD) produced by Professor Yang Jie and Professor Huang Xin’s team at Wuhan University (https://zenodo.org/records/8176941). This study selects the 2022 raster land use data at 30 m resolution. Using ArcGIS 10.2, the data were reclassified, resampled, and clipped to obtain land use data within the study area, categorized into six land types: cropland, forest, grassland, water bodies, construction land, and unused land. (2) Net Primary Productivity (NPP) Data: Obtained from NASA’s Earth Science Data portal, specifically the MOD17A3HGFv061 dataset (https://lpdaac.usgs.gov/products/mod17a3hgfv061/). (3) Temperature Data: Sourced from the National Centers for Environmental Information (NCEI) under the National Oceanic and Atmospheric Administration (NOAA) of the United States (https://www.ncei.noaa.gov/data/global-summary-of-the-day/archive/). (4) Precipitation Data: Acquired from the ERA5-Land dataset published by the European Union and the European Centre for Medium-Range Weather Forecasts (https://www.ecmwf.int/en/era5-land). (5) Socioeconomic and Energy Consumption Data: Obtained from provincial and municipal statistical yearbooks, the China City Statistical Yearbook, and the China Energy Statistical Yearbook.
3.2. Research methods
3.2.1. Calculation of land use carbon budget
This study, referring to previous research on carbon emissions and carbon sequestration, identifies cropland and construction land as carbon sources, and forest, grassland, water bodies, and unused land as carbon sinks [21-24]. The carbon budget of each land use type is directly calculated by combining its area with the corresponding carbon emission or sequestration coefficient. Specifically, the carbon emission coefficient of cropland is 0.4970 t·hm-² [23]; the carbon emission coefficient of construction land is derived from the values of six major regions in China published by the Ministry of Natural Resources [25], specifically: 81.2 t·hm-² (North China), 65.3 t·hm-² (East China), 48.8 t·hm-² (Northeast China), 46.5 t·hm-² (Central-South China), 49.1 t·hm-² (Southwest China), and 33.9 t·hm-² (Northwest China). The carbon sequestration coefficients of grassland and forest are -0.021 t·hm-² and -0.581 t·hm-², respectively [26, 27]; the carbon sequestration coefficient of water bodies is -0.253 t·hm-² [28]; and the carbon sequestration coefficient of unused land is -0.005 t·hm-² [24]. Positive values indicate carbon emissions, and negative values indicate carbon sequestration. The carbon budget is specifically calculated as follows [29]:
In the formula,
3.2.2. Spatial autocorrelation analysis
The global Moran’s I index can describe the clustering of the carbon budget of China’s urban agglomerations in the overall spatial distribution. The calculation formula for the global Moran’s I index is as follows:
In the formula: n is the total number of study regions;
3.2.3. Hot spot analysis
Hot spot analysis (Getis-Ord Gi*) is a method used for local spatial autocorrelation analysis, which can intuitively examine the spatial distribution characteristics of urban carbon budgets. Using the Hot Spot Analysis tool in ArcGIS 10.2, cold and hot spots of carbon emissions and carbon sequestration are identified. A high Z-score indicates that the region is a hot spot in terms of carbon budget, and the higher the Z-score, the more tightly clustered the hot spot; a low Z-score indicates that the region is a cold spot, and the lower the Z-score, the more tightly clustered the cold spot.
3.2.4. Cluster analysis
In this study, SPSS 20.0 software was used to perform cluster analysis of the 19 urban agglomerations based on the carbon budget status of different land use types in each agglomeration, using the hierarchical clustering method.
3.2.5. Geographic detector
This study applies factor detection and interaction detection within the Geographic Detector framework to investigate the effects of different influencing factors and their interactions on the spatial distribution pattern of the carbon budget in China’s 19 urban agglomerations. The calculation formula is as follows:
In the formula:
3.2.6. SPSS regression analysis
The regression model between the carbon budget and its influencing factors for China’s 19 urban agglomerations was constructed using SPSS 20.0 software.
4. Results and analysis
4.1. Spatial pattern of carbon budget in china’s urban agglomerations based on land use
4.1.1. Spatial pattern of land use in china’s urban agglomerations
Based on the land use raster data, the spatial distribution pattern of land use in China’s urban agglomerations was obtained, as shown in Figure 1. Construction land is concentrated in North China and East China, mainly including the Beijing-Tianjin-Hebei Urban Agglomeration, Shandong Peninsula Urban Agglomeration, and Yangtze River Delta Urban Agglomeration. Cropland is relatively concentrated and widely distributed across Northeast China, North China, Central-South China, and Southwest China, mainly covering the Harbin-Changchun Urban Agglomeration, Central Plains Urban Agglomeration, and Chengdu-Chongqing Urban Agglomeration. Forests are mainly distributed in Northeast, Southeast, and Southwest China, representing the country’s three major forested regions, including the Harbin-Changchun Urban Agglomeration, West Coast of the Strait Urban Agglomeration, and Central Yunnan Urban Agglomeration. Water bodies are mainly distributed in Southeast China, including the Yangtze River Delta Urban Agglomeration and Middle Reaches of the Yangtze River Urban Agglomeration. Unused land and grassland are primarily concentrated in Northwest China, including the Northern Tianshan Urban Agglomeration and Hohhot-Baotou-Ordos-Yulin Urban Agglomeration. Overall, the distribution is uneven, showing a spatial pattern of “more in the west, less in the east.”
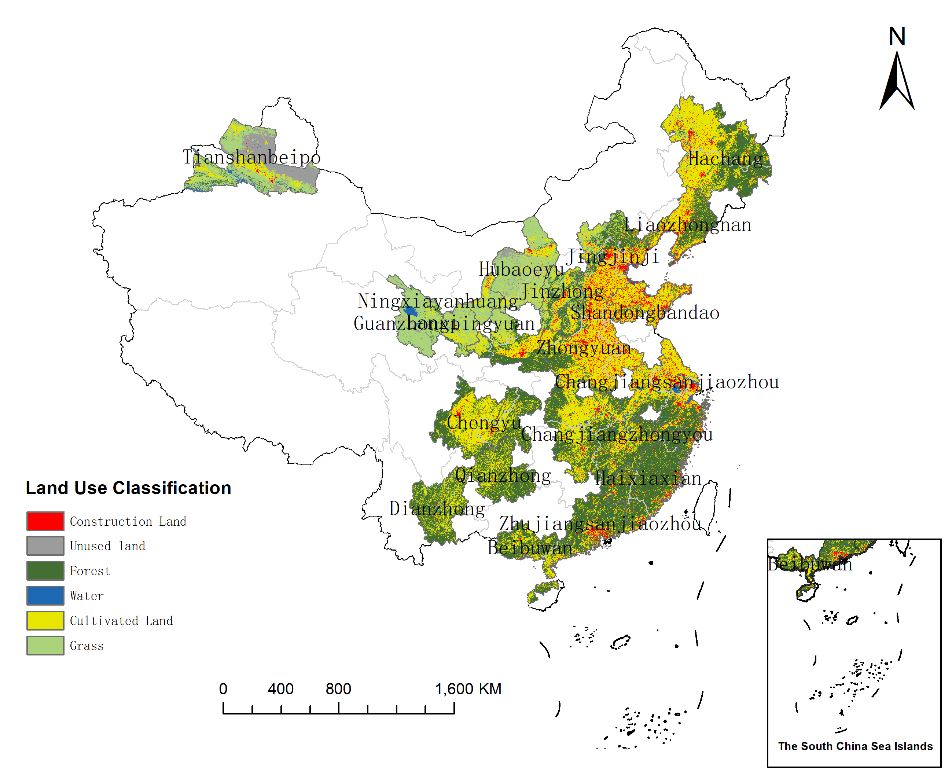
Note: The map approval number is GS (2019) 1822, the same applies hereinafter.
4.1.2. Spatial pattern of carbon budget in urban agglomerations based on land use
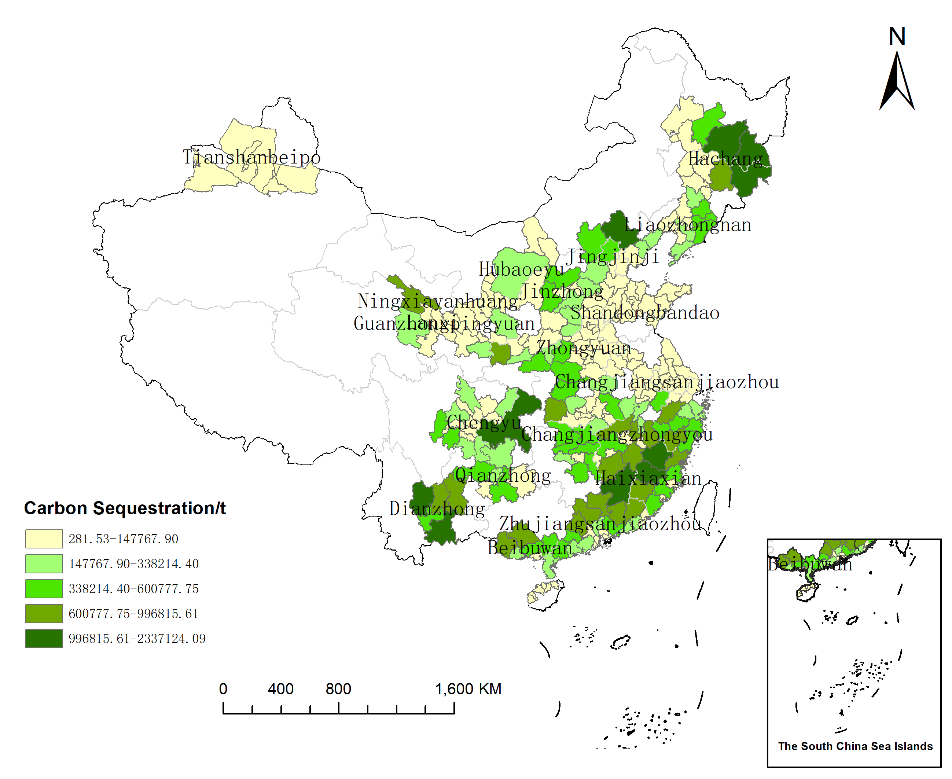
Based on the land use data and the carbon budget calculation coefficients, the carbon budgets and their spatial patterns for China’s 19 urban agglomerations in 2022 were obtained, as shown in Figure 2 and Figure 3. Overall, the spatial distribution of carbon emissions shows a pattern of “higher in the east and lower in the west,” while carbon sequestration exhibits a pattern of “higher in the south and lower in the north.” At the regional scale, carbon emissions are relatively high in Northeast China, North China, East China, and Central-South China. In contrast, local areas in Northeast China, the eastern coastal regions, and Southwest China have relatively high carbon sequestration, representing the major carbon sink areas.
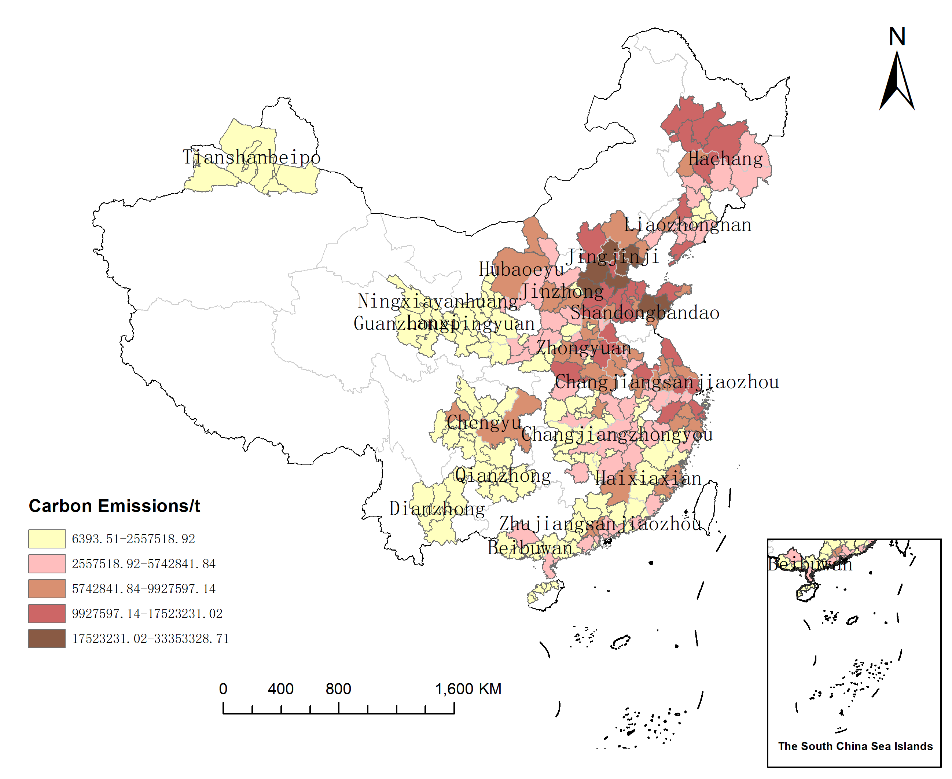
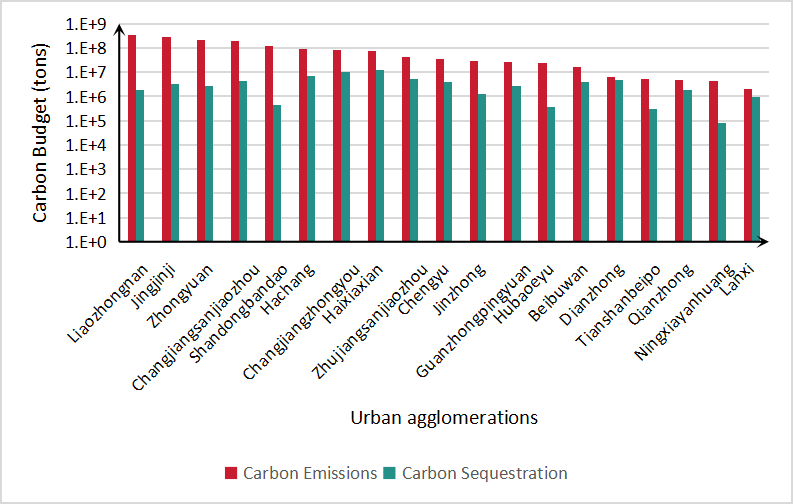
Based on the carbon budget data of urban agglomerations, as shown in Figure 4, areas of high carbon emissions in 2022 are mainly concentrated in the Central-Southern Liaoning, Beijing-Tianjin-Hebei, and Shandong Peninsula Urban Agglomerations. In terms of land use types, the Central-Southern Liaoning Urban Agglomeration has the largest area of construction land and correspondingly the highest carbon emissions, reaching 343.9 million tonnes. At the city scale, high carbon emissions are mainly observed in Beijing, Tianjin, and Qingdao, each exceeding 17.52 million tonnes. In contrast, the Lanxi Urban Agglomeration has the smallest construction land area and the lowest carbon emissions, approximately 2.01 million tonnes. This indicates significant differences in carbon emissions between urban agglomerations, primarily influenced by the size of construction land. With the rapid development of China’s economy, these high-emission areas will face increasing environmental pressure.
In 2022, areas of high carbon sequestration are mainly distributed in the Harbin-Changchun, West Coast of the Strait, Chengdu-Chongqing, and Central Guizhou Urban Agglomerations, encompassing cities such as Mudanjiang, Chongqing, and Ganzhou, with carbon sequestration exceeding 0.99 million tonnes in each case. Regarding land use types, the West Coast of the Strait Urban Agglomeration has the largest forest area and the highest carbon sequestration, approximately 12.14 million tonnes. The Ningxia Yellow River Urban Agglomeration has the smallest forest area and the lowest carbon sequestration, around 0.08 million tonnes. The differences in carbon sequestration among urban agglomerations are also significant, primarily determined by forest area. As the largest carbon pool in ecosystems, forests play a crucial role in absorbing CO₂ and mitigating global climate warming.
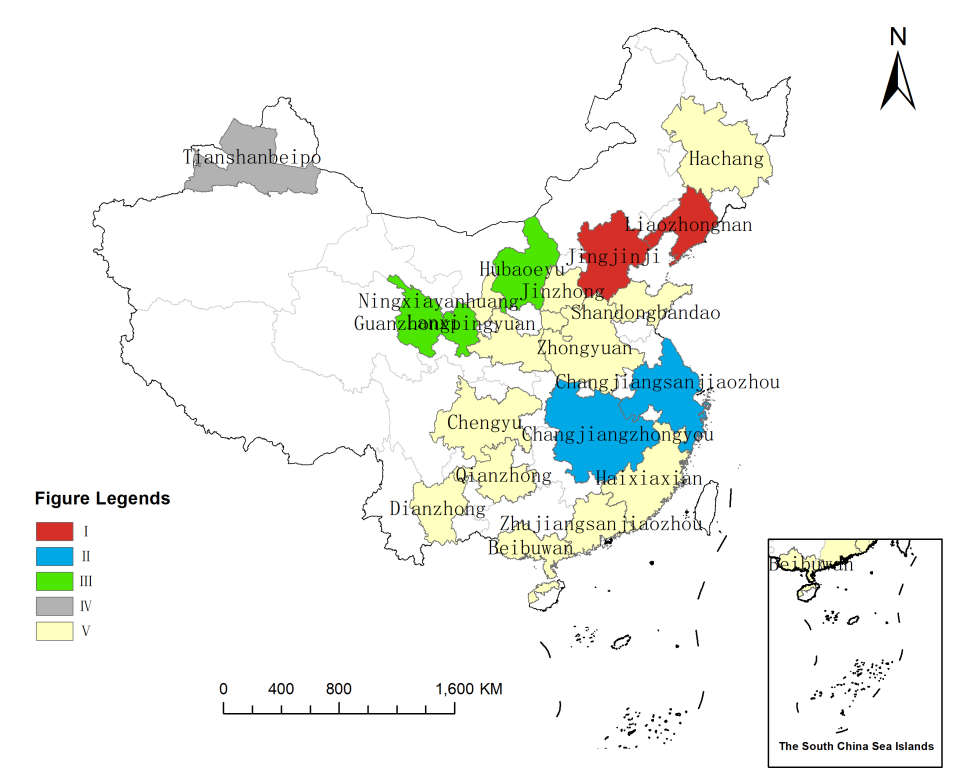
4.1.3. Clustering characteristics of carbon budget in china’s urban agglomerations based on land use
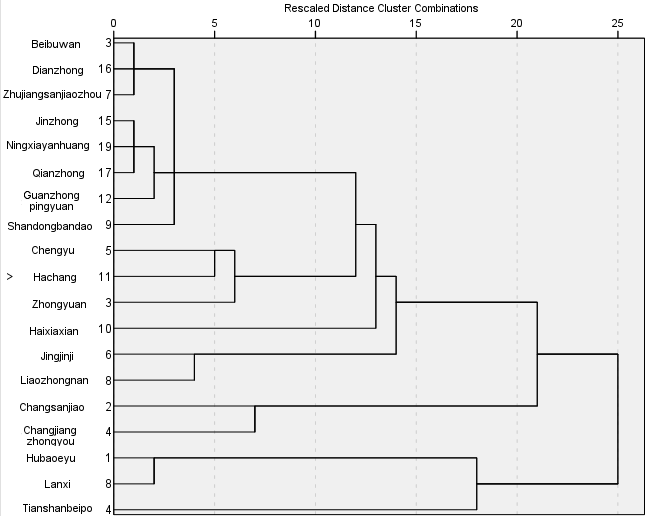
Based on the carbon emissions and sequestration data of different land use types in the 19 urban agglomerations, hierarchical cluster analysis was performed on the samples, dividing the 19 urban agglomerations into five categories, as shown in Figure 5 and Figure 6. Category I includes the Beijing-Tianjin-Hebei and Central-Southern Liaoning Urban Agglomerations. These urban agglomerations have large areas of construction land, high levels of urbanization and industrialization, and extensive construction land that supports substantial economic activities, resulting in the highest carbon emissions from construction land and the largest share in total carbon emissions. Additionally, cropland carbon emissions in Category I urban agglomerations are also relatively high, leading to the highest total carbon emissions. Category II includes the Middle Reaches of the Yangtze River and Yangtze River Delta Urban Agglomerations. Located in the middle and lower Yangtze River plains, these agglomerations contain extensive wetlands, tributaries, and freshwater lakes, with the largest water areas and the highest carbon sequestration. Category III includes the Lanxi and Hohhot-Baotou-Ordos-Yulin Urban Agglomerations. Situated in Northwest China, the unique continental climate and relatively large urban areas result in extensive grassland coverage, giving Category III urban agglomerations the highest carbon sequestration from grasslands. Category IV is the Northern Tianshan Urban Agglomeration. This agglomeration has the largest carbon sequestration from unused land. Due to its relatively remote location and arid climate, the population and economic development levels are low, and land development is limited. Category V includes the remaining urban agglomerations, such as the Harbin-Changchun, Ningxia Yellow River, and Central Shanxi Urban Agglomerations, which are widely distributed. Except for the West Coast of the Strait Urban Agglomeration, which has relatively high forest carbon sequestration, the carbon budget of other land use types and the total carbon budget are not prominent.
4.2. Spatial autocorrelation and hot spot analysis of carbon budget in china’s urban agglomerations
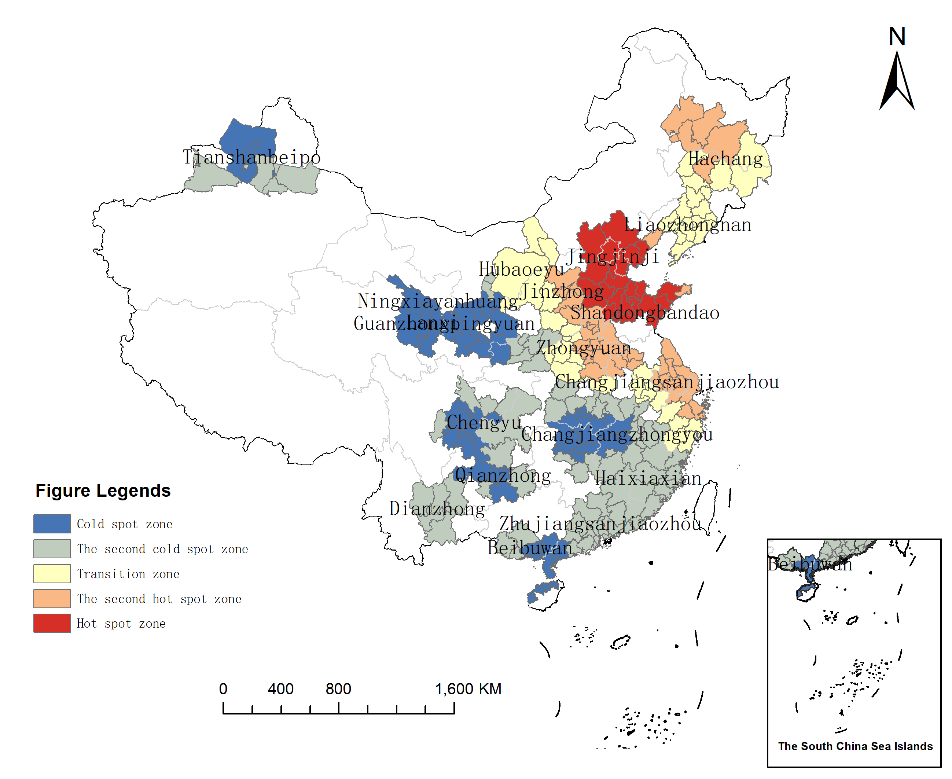
Based on the carbon budget data of the 19 urban agglomerations, the global Moran’s I indices for carbon emissions and carbon sequestration in 2022 were calculated as 0.541398 (P<0.01) and 0.272707 (P<0.01), respectively. Both Z-scores exceed 2.58, indicating that carbon emissions and carbon sequestration in China’s urban agglomerations exhibit significant positive spatial correlation and clustering.
To further examine the spatial clustering characteristics of carbon emissions in urban agglomerations, hot spot analysis was used to display the spatial distribution of cold and hot spots for carbon emissions and sequestration, as shown in Figures 7 and 8. The hot spot areas for carbon emissions are mainly concentrated in the Beijing-Tianjin-Hebei and Shandong Peninsula Urban Agglomerations, while secondary hot spots are primarily found in the Harbin-Changchun, Central Shanxi, and Central Plains Urban Agglomerations. The cold and secondary cold spots are widely distributed across the Northern Tianshan, Lanxi, Ningxia Yellow River, Guanzhong Plain, Chengdu-Chongqing, Central Guizhou, Middle Reaches of the Yangtze River, and Beibu Gulf Urban Agglomerations, covering Northwest, Southwest, and Central-South China. Overall, carbon emissions in China’s urban agglomerations display a spatial pattern of “hot spots clustered in the Bohai Rim of northern China and cold spots clustered in southern China.”
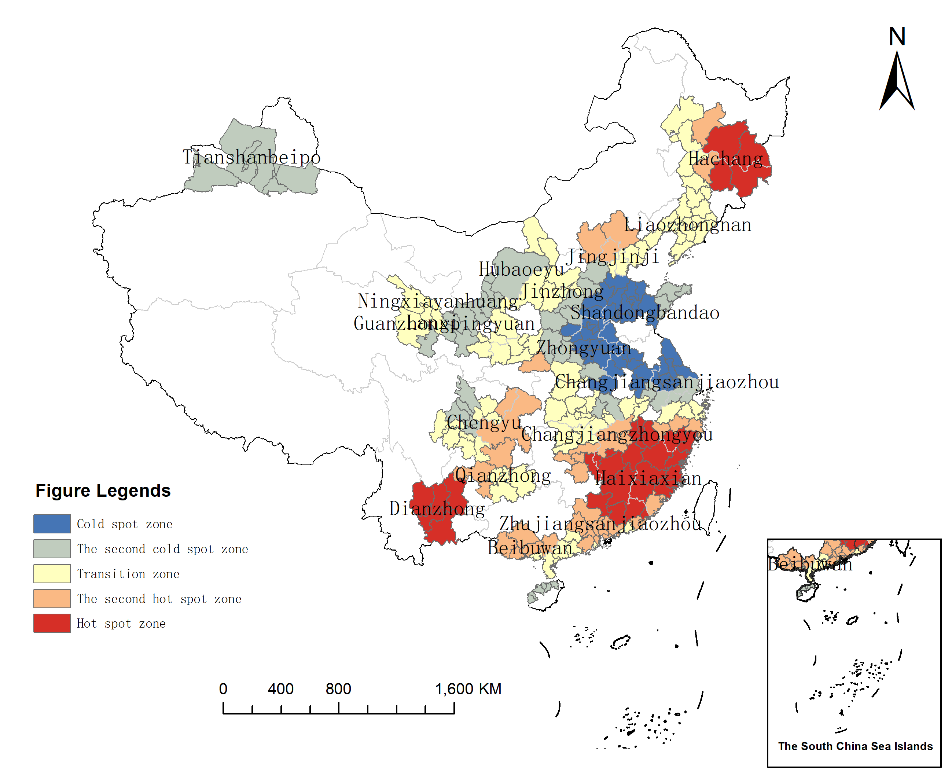
The spatial distribution of carbon sequestration cold and hot spots differs significantly from that of carbon emissions. Hot spots of carbon sequestration are mainly concentrated in the Harbin-Changchun, Middle Reaches of the Yangtze River, West Coast of the Strait, Pearl River Delta, and Central Yunnan Urban Agglomerations, while secondary hot spots are primarily distributed in the Beijing-Tianjin-Hebei, Chengdu-Chongqing, Central Guizhou, Middle Reaches of the Yangtze River, West Coast of the Strait, Pearl River Delta, and Beibu Gulf Urban Agglomerations. Cold spots are mainly concentrated in the Beijing-Tianjin-Hebei, Shandong Peninsula, Central Plains, and Yangtze River Delta Urban Agglomerations, whereas secondary cold spots are distributed across the Northern Tianshan, Lanxi, Ningxia Yellow River, Central Shanxi, Beijing-Tianjin-Hebei, Shandong Peninsula, Chengdu-Chongqing, Middle Reaches of the Yangtze River, and Yangtze River Delta Urban Agglomerations, showing widespread coverage. Overall, carbon sequestration in China’s urban agglomerations exhibits a spatial pattern of “cold spots clustered in North China and East China, and hot spots clustered in Northeast, Southeast, and Southwest China.”
4.3. Influencing factors of the spatial pattern of carbon budget in china’s urban agglomerations
This study selects nine influencing factors [30-33] from five dimensions: economy, population, climate, vegetation, and energy. The economic factors include GDP (X1), primary industry output (X2), secondary industry output (X3), and tertiary industry output (X4); the population factor is the number of permanent urban residents (X5); the climate factors include annual mean temperature (X6) and annual precipitation (X7); the vegetation factor is net primary productivity (NPP, X8); and the energy factor is total urban energy consumption (X9). Data analysis is performed using the Geographic Detector.
4.3.1. Influencing factors of the spatial pattern of carbon emissions in china’s urban agglomerations
Using the Geographic Detector to explore factors affecting the spatial pattern of carbon emissions, the explanatory power (q value) of each single factor was obtained, as shown in Table 2. Among them, total energy consumption has the strongest explanatory power (0.561), indicating that energy is the primary factor influencing carbon emissions. The number of permanent urban residents also has a high explanatory power (0.505), suggesting that population is another major factor driving carbon emissions. As urban populations continue to grow, carbon emissions in urban agglomerations correspondingly increase. Economic factors are also important, with GDP showing relatively high explanatory power (0.380). Among the three industrial sectors, the secondary industry has the strongest explanatory power (0.283), indicating that the development of the secondary industry, particularly heavy industry, has the greatest impact on carbon emissions. Among all analyzed factors, natural factors have relatively weaker influence.
|
Influencing Factor |
X1 |
X2 |
X3 |
X4 |
X5 |
X6 |
X7 |
X8 |
X9 |
|
q value |
0.380*** |
0.188** |
0.283*** |
0.273*** |
0.505*** |
0.049*** |
0.137*** |
0.223*** |
0.561*** |
Note: * * * P<0.01,* * P<0.05,* P<0.10
The explanatory power of the two-factor interactions on carbon emissions for each urban agglomeration is shown in Table 3. In general, the explanatory power of two-factor interactions is greater than that of single-factor effects, indicating that carbon emissions are influenced by the combined effects of multiple factors. The top three two-factor interaction q values are: total energy consumption with primary industry output, total energy consumption with secondary industry output, and total energy consumption with the number of permanent urban residents. This confirms that energy is the dominant factor affecting carbon emissions and highlights that the interaction between energy and economic factors plays a crucial role in influencing carbon emissions.
|
Influencing Factor |
X1 |
X2 |
X3 |
X4 |
X5 |
X6 |
X7 |
X8 |
X9 |
|
X1 |
0.380 |
||||||||
|
X2 |
0.629 |
0.188 |
|||||||
|
X3 |
0.416 |
0.589 |
0.283 |
||||||
|
X4 |
0.417 |
0.488 |
0.386 |
0.273 |
|||||
|
X5 |
0.665 |
0.753 |
0.714 |
0.573 |
0.505 |
||||
|
X6 |
0.441 |
0.349 |
0.405 |
0.351 |
0.615 |
0.049 |
|||
|
X7 |
0.634 |
0.467 |
0.562 |
0.488 |
0.711 |
0.186 |
0.137 |
||
|
X8 |
0.560 |
0.485 |
0.482 |
0.461 |
0.686 |
0.238 |
0.263 |
0.223 |
|
|
X9 |
0.789 |
0.829 |
0.827 |
0.688 |
0.806 |
0.672 |
0.701 |
0.783 |
0.561 |
4.3.2. Influencing factors of the spatial pattern of carbon sequestration in china’s urban agglomerations
Using the Geographic Detector to explore factors affecting the spatial pattern of carbon sequestration, the explanatory power (q value) of each single factor was obtained, as shown in Table 4. Among them, NPP has the strongest explanatory power (0.290), indicating that net primary productivity of vegetation has the most significant impact on carbon sequestration. NPP not only reflects the quality and productivity of ecosystems but is also an important factor for assessing ecosystem carbon sink capacity. Precipitation also has a substantial influence on carbon sequestration, with relatively strong explanatory power (0.157), second only to NPP. The effect of precipitation is mainly due to the critical role of natural factors in vegetation growth, which in turn affects NPP. Economic factors show relatively weak explanatory power, indicating that economic development has a comparatively minor impact on carbon sequestration.
|
Influencing Factor |
X1 |
X2 |
X3 |
X4 |
X5 |
X6 |
X7 |
X8 |
X9 |
|
q value |
0.052*** |
0.155** |
0.033*** |
0.052*** |
0.104*** |
0.038*** |
0.157*** |
0.290*** |
0.149*** |
Note: * * * P<0.01,* * P<0.05,* P<0.10
The explanatory power of two-factor interactions on carbon sequestration for each urban agglomeration is shown in Table 5. In general, the explanatory power of two-factor interactions is greater than that of single-factor effects, indicating that carbon sequestration is also influenced by the combined effects of multiple factors. The q values for the interactions between NPP and total energy consumption, and between NPP and primary industry output, exceed 0.7, demonstrating that NPP is the dominant factor affecting carbon sequestration. Moreover, the interactions between vegetation and human activity-related factors such as energy and industry also play an important role in influencing carbon sequestration.
|
Influencing Factor |
X1 |
X2 |
X3 |
X4 |
X5 |
X6 |
X7 |
X8 |
X9 |
|
X1 |
0.052 |
||||||||
|
X2 |
0.379 |
0.155 |
|||||||
|
X3 |
0.098 |
0.345 |
0.033 |
||||||
|
X4 |
0.107 |
0.379 |
0.117 |
0.052 |
|||||
|
X5 |
0.215 |
0.400 |
0.249 |
0.244 |
0.104 |
||||
|
X6 |
0.161 |
0.343 |
0.200 |
0.136 |
0.241 |
0.038 |
|||
|
X7 |
0.301 |
0.488 |
0.280 |
0.285 |
0.367 |
0.248 |
0.157 |
||
|
X8 |
0.474 |
0.741 |
0.492 |
0.486 |
0.621 |
0.438 |
0.489 |
0.290 |
|
|
X9 |
0.325 |
0.505 |
0.427 |
0.340 |
0.457 |
0.323 |
0.475 |
0.783 |
0.149 |
4.3.3. Automatic linear modeling regression analysis
Linear regression analysis of the influencing factors was performed using SPSS software. A stepwise method was employed to establish the regression model between the carbon budget and various influencing factors for the 19 urban agglomerations in China, as follows:
In the equation,
The adjusted R² of the regression model is 0.795, indicating a high goodness-of-fit to the sample data. The significant factors in the equation are coal and NPP, with importance values of 0.95 and 0.05, respectively. The regression coefficient for energy consumption is 5128.15 (p<0.01), indicating a significant positive effect of energy consumption on carbon emissions; the regression coefficient for NPP is -0.36 (p<0.01), indicating a significant positive effect of NPP on carbon sequestration.
5. Conclusions and discussion
5.1. Conclusions
(1) In 2022, the spatial distribution of the carbon budget across China’s 19 urban agglomerations was uneven, exhibiting the pattern of “higher carbon emissions in the east and lower in the west, higher carbon sequestration in the south and lower in the north.”
(2) Significant differences in carbon emissions were observed among the urban agglomerations. The Liaoning-Central South (Liao Zhongnan) Urban Agglomeration had the highest carbon emissions, while the Lanxi Urban Agglomeration had the lowest, mainly due to differences in the area of construction land. Similarly, carbon sequestration varied significantly across urban agglomerations, with the West Coast of the Strait Urban Agglomeration showing the highest carbon sequestration and the Ningxia Yellow River Urban Agglomeration the lowest, primarily influenced by forest area.
(3) Based on the carbon budget data derived from land use, the 19 urban agglomerations can be clustered into five categories. Category I urban agglomerations have high carbon emissions from construction land and cropland; Category II urban agglomerations have the largest water areas and highest carbon sequestration; Category III urban agglomerations have the highest grassland carbon sequestration; Category IV urban agglomerations have the highest carbon sequestration from unused land; Category V urban agglomerations include the remaining agglomerations, which are widely distributed and show no outstanding carbon budget characteristics across land types or overall.
(4) In 2022, carbon emissions and carbon sequestration in China’s 19 urban agglomerations exhibited significant spatial correlation and clustering. The spatial pattern shows “carbon emission hot spots clustered in the Bohai Rim of northern China, and carbon sequestration hot spots clustered in Northeast, Southeast, and Southwest China.”
(5) Results from the Geographic Detector and regression analysis indicate that energy consumption has a significant positive effect on carbon emissions, and the interaction between energy and economic factors is extremely important. Net primary productivity of vegetation has a significant positive effect on carbon sequestration, and the interactions between vegetation and human activity-related factors such as energy and industry also play a crucial role in influencing carbon sequestration.
5.2. Discussion
(1) This study found that the spatial distribution of the carbon budget across China’s 19 urban agglomerations is uneven and exhibits significant spatial clustering. Carbon emissions primarily show an “east-high, west-low” pattern, while carbon sequestration mainly displays a “south-high, north-low” pattern. The level of carbon emissions in urban agglomerations is mainly determined by the area of construction land. Because construction land has a high carbon emission coefficient, it serves as the primary carbon source within urban agglomerations [34]. Conversely, forest land, with a high carbon sequestration coefficient, serves as the main carbon sink, so carbon sequestration is largely dependent on forest area. Under the current context of rapid and high-quality economic development in China, it is necessary to improve the utilization efficiency of construction land, rationally plan urban agglomeration construction land, coordinate the spatial distribution of carbon sources and sinks, and control carbon emission intensity. At the same time, attention should be given to protecting carbon sink land such as forests, particularly in the three major forest regions of Northeast, Southeast, and Southwest China. Ecological protection and restoration measures should be implemented, including afforestation and forest conservation, to prevent the expansion of urban construction land from encroaching on carbon sink areas, which would weaken the carbon sink function and exacerbate carbon emissions.
(2) Based on the differences in the carbon budget among the 19 urban agglomerations, targeted and differentiated carbon reduction measures should be formulated from the perspective of land use patterns. For urban agglomerations dominated by construction land, carbon emissions should be limited through measures such as controlling population density, optimizing urban spatial layout, and restricting urban expansion. For agglomerations dominated by cropland, continuous conversion of farmland to forests and grasslands should be promoted under strict adherence to the farmland red line and protection of reserve farmland, alongside ecological restoration measures such as mountain-water-forest-field-lake projects, to enhance carbon sequestration capacity. For agglomerations dominated by forest, grassland, and water bodies, ecological protection and management should be emphasized, including measures to prevent human interference from disrupting carbon sequestration, as well as soil erosion and land degradation control, to consolidate carbon sink capacity. For agglomerations dominated by unused land, where carbon reduction pressure is relatively low, measures should focus on promoting industrial structure optimization and improving economic development levels.
(3) When formulating carbon reduction measures for each urban agglomeration, attention should also be given to the main factors influencing spatial variation in the carbon budget. From the perspective of energy consumption structure, efforts should be made to transition traditional energy industries to new energy industries, enhance industrial R&D capabilities, promote the application of new energy technologies, and establish a new energy–based industrial development system. Regarding population, the spatial distribution of urban populations should be optimized to limit resource and environmental pressures caused by excessive population growth, achieving a balance between urban population size and carrying capacity. In terms of vegetation landscapes, sustainable development principles should be followed, building urban green spaces during urban development, while simultaneously emphasizing ecological restoration and protection to enhance urban agglomerations’ carbon reduction capacity.
(4) Due to data limitations, this study has certain shortcomings. The carbon emission and sequestration coefficients for each land use type are based on previous studies. In the future, it will be necessary to further investigate the natural and socio-economic characteristics of different regions and urban agglomerations and use actual monitored carbon budget data to improve the accuracy of the results.
References
[1]. Fang, J. Y., Zhu, J. L., & Wang, S. P. (2011). Global warming, human-induced carbon emissions, and their uncertainties.Science China: Earth Sciences(English Edition), 54(10), 11. https: //doi.org/10.1007/s11430-011-4292-0
[2]. Houghton, R. A., & Nassikas, A. A. (2017). Global and regional fluxes of carbon from land use and land cover change 1850–2015.Global Biogeochemical Cycles, 31(3), 456–472. https: //doi.org/10.1002/2016GB005546
[3]. Xi, J. P. (2020). Speech at the general debate of the 75th session of the United Nations General Assembly.Gazette of the State Council of the People's Republic of China, (28), 5–7.
[4]. Pouyat, R. (2014). Urban land use change effects on below- and aboveground carbon stocks—a global perspective and future research needs. In AGU Fall Meeting Abstracts. AGU Fall Meeting.
[5]. Chen, Y., Lu, H., & Li, J. (2020). Effects of land use cover change on carbon emissions and ecosystem services in Chengyu urban agglomeration,China. Stochastic Environmental Research and Risk Assessment, 34, 5993. https: //doi.org/10.1007/s00477-020-01819-8
[6]. Wang, M. T., Wei, W., & Xie, B. B. (2024). Spatio-temporal evolution characteristics of carbon sources/sinks in key ecological functional zones from a multi-scale perspective: A case study of the Yellow River Basin.Acta Scientiae Circumstantiae, 44(2), 477–488.
[7]. Chen, N., Xin, C., & Zhang, B. (2023). Contribution of multi-objective land use optimization to carbon neutrality: A case study of Northwest China.Ecological Indicators, 157. https: //doi.org/10.1016/j.ecolind.2023.111219
[8]. Foley, J. A. (2005). Global consequences of land use.Science, 309(5734), 570–574. https: //doi.org/10.1126/science.1111772
[9]. Li, Y. Y., Wei, W., & Zhou, J. J. (2023). Changes in China's land-use carbon emissions and coordinated zoning.Environmental Science, 44(3), 1267–1276. https: //doi.org/10.13227/j.hjkx.202204009
[10]. Zhu, H., Pan, Y. H., Chen, Y. T. (2024). Effects of land-use changes on carbon stocks and their components in Hangzhou from 2000 to 2030.Environmental Science & Technology, 47(11), 22–34. https: //doi.org/10.19672/j.cnki.1003-6504.0787.24.338
[11]. Zhou, Z., Meng, J. J., & Qi, Y. (2016). Research progress on the importance and pattern optimization of China's ecological land.Journal of Ecology, 35(1), 8. https: //doi.org/10.13292/j.1000-4890.201601.030
[12]. Ma, X. Z., & Wang, Z. (2015). Research progress on the impact of land-use change on regional carbon sources and sinks.Acta Ecologica Sinica, 35(17), 10. https: //doi.org/10.5846/stxb201312112932
[13]. Cheng, F. Y., Shi, P. J., & Zhang, W. P. (2023). Spatio-temporal differentiation of carbon budget and carbon compensation zoning in the Lanxi urban agglomeration from the perspective of major function zones: Based on DMSP/OLS and NPP/VIIRS nighttime light data.Acta Scientiae Circumstantiae, 43(11), 398–410.
[14]. Xu, S. (2024). Analysis of carbon emission characteristics and decarbonization strategies of China's five major urban agglomerations.Shanghai Urban Planning, (4), 48–55.
[15]. Liu, X., Ou, J., & Wang, S. (2018). Estimating spatiotemporal variations of city-level energy-related CO₂ emissions: An improved disaggregating model based on vegetation-adjusted nighttime light data.Journal of Cleaner Production, 177(MAR.10), 101–114. https: //doi.org/10.1016/j.jclepro.2017.12.197
[16]. Zhu, Z. M., Xu, J., Lin, W. X. (2024). Spatio-temporal coupling and driving factors of carbon reduction and high-quality economic development in the Yangtze River Delta urban agglomeration.Resources and Environment in the Yangtze Basin, 33(10), 2285–2298.
[17]. Song, S. L. (2024). Prediction and influencing factors of road traffic carbon emissions in the Central Plains urban agglomeration under carbon peak context [Master's thesis, Shijiazhuang Tiedao University]. https: //doi.org/10.27334/d.cnki.gstdy.2024.001223
[18]. Zhao, J., Ji, G., & Yue, Y. L. (2019). Spatio-temporal dynamics of urban residential CO₂ emissions and their driving forces in China using the integrated two nighttime light datasets.Applied Energy, 235(FEB.1), 612–624. https: //doi.org/10.1016/j.apenergy.2018.09.180
[19]. Liu, Z. Y., Zhang, S. S. (2024). Spatio-temporal evolution and influencing factors of energy consumption carbon emissions in China's urban agglomerations based on nighttime light data.Ecological Economy, 40(9), 23–31.
[20]. Zhou, D., Zhao, S., & Liu, S. (2014). Surface urban heat island in China's 32 major cities: Spatial patterns and drivers.Remote Sensing of Environment, 152, 51–61.
[21]. Zhao, X. C., Zhu, X., & Zhou, Y. Y. (2013). Analysis of carbon emission effects and spatio-temporal patterns of different land use types in Hunan Province.Acta Scientiae Circumstantiae, 33(3), 941–949. https: //doi.org/10.13671/j.hjkxxb.2013.03.037
[22]. Zhang, L. Q., Chen, S. P., & Wang, W. Q. (2013). Measurement and trend prediction of carbon emission effects of construction land changes in Anhui Province over the past 15 years: Based on the STIRPAT model.Acta Scientiae Circumstantiae, 33(3), 950–958.
[23]. Xiao, H. Y., Yuan, X. Z., & Li, B. (2012). Study on carbon emission effects of land use changes: A case study of Chongqing.Journal of Chongqing Normal University (Natural Science Edition), 29(1), 38–42+115.
[24]. Lai, L. (2010). Research on the carbon emission effects of land use in China [Master’s thesis, Nanjing University].
[25]. China Land & Resources News. (2023). Low-carbon emissions: A new topic for land use regulation [EB/OL].Retrieved January14, 2024, from https: //www.mnr.gov.cn/dt/ywbb/201810/t20181030_2249226.html
[26]. Su, Y. L., & Zhang, Y. F. (2011). Study on carbon emission benefits of land use changes in Shaanxi Province.Journal of Soil and Water Conservation, 25(1), 5. https: //doi.org/CNKI: SUN: TRQS.0.2011-01-033
[27]. Fang, J. Y., Guo, Z. D., & Park, S. L. (2007). Estimation of terrestrial vegetation carbon sinks in China from 1981 to 2000.Science in China D, 37(6), 804. https: //doi.org/10.3969/j.issn.1674-7240.2007.06.012
[28]. Shi, H. X., Mu, X. M., & Zhang, Y. L. (2012). Study on carbon emission effects of different land use types in Guangyuan, Sichuan Province.Bulletin of Soil and Water Conservation, 32(3), 6. https: //doi.org/CNKI: SUN: STTB.0.2012-03-022
[29]. Chen, J. S., Zhang, J. J., & Li, J. L. (2024). Spatio-temporal changes of carbon emissions and driving factors in the Beijing-Tianjin-Hebei region.Acta Ecologica Sinica, 44(6), 2270–2283. https: //doi.org/10.20103/j.stxb.202304290904
[30]. Niu, Y. W., Zhao, X. C., & Hu, Y. J. (2021). Spatio-temporal differentiation of land-use carbon emissions at county level in the Chang-Zhu-Tan region based on NPP-VIIRS nighttime lights.Acta Scientiae Circumstantiae. https: //doi.org/10.13671/j.hjkxxb.2021.0281
[31]. Xu, B. W., Luo, C. S., & Shen, J. Y. (2024). Measurement and influencing factors of per capita carbon emissions in Zhejiang Province.Environmental Science and Management, 49(10), 20–25.
[32]. Gao, L. B. (2024). Status and factor decomposition of industrial carbon emissions in Gansu Province based on LMDI.Science & Technology Innovation and Productivity, 45(10), 67–70.
[33]. Wang, S. N., Wu, Y. J., & Wang, H. Z. (2024). Analysis of driving factors of spatio-temporal changes of remote sensing drought in Ordos based on geographic detector [J/OL].Arid Zone Research, 1–12. Retrieved December 6, 2024, from http: //kns.cnki.net/kcms/detail/65.1095.X.20241115.1751.004.html
[34]. Deng, Y. J., Chen, H., & Hai, Y. F. (2024). Spatial patterns of land-use carbon emissions and carbon balance zoning in the Chengdu-Chongqing twin-city economic circle.Bulletin of Soil and Water Conservation, 44(5), 337–346. https: //doi.org/10.13961/j.cnki.stbctb.2024.05.036
Cite this article
Liu,Y. (2025). Spatial pattern and influencing factors of carbon budget based on land use in urban agglomerations in China. Advances in Engineering Innovation,16(8),20-33.
Data availability
The datasets used and/or analyzed during the current study will be available from the authors upon reasonable request.
Disclaimer/Publisher's Note
The statements, opinions and data contained in all publications are solely those of the individual author(s) and contributor(s) and not of EWA Publishing and/or the editor(s). EWA Publishing and/or the editor(s) disclaim responsibility for any injury to people or property resulting from any ideas, methods, instructions or products referred to in the content.
About volume
Journal:Advances in Engineering Innovation
© 2024 by the author(s). Licensee EWA Publishing, Oxford, UK. This article is an open access article distributed under the terms and
conditions of the Creative Commons Attribution (CC BY) license. Authors who
publish this series agree to the following terms:
1. Authors retain copyright and grant the series right of first publication with the work simultaneously licensed under a Creative Commons
Attribution License that allows others to share the work with an acknowledgment of the work's authorship and initial publication in this
series.
2. Authors are able to enter into separate, additional contractual arrangements for the non-exclusive distribution of the series's published
version of the work (e.g., post it to an institutional repository or publish it in a book), with an acknowledgment of its initial
publication in this series.
3. Authors are permitted and encouraged to post their work online (e.g., in institutional repositories or on their website) prior to and
during the submission process, as it can lead to productive exchanges, as well as earlier and greater citation of published work (See
Open access policy for details).
References
[1]. Fang, J. Y., Zhu, J. L., & Wang, S. P. (2011). Global warming, human-induced carbon emissions, and their uncertainties.Science China: Earth Sciences(English Edition), 54(10), 11. https: //doi.org/10.1007/s11430-011-4292-0
[2]. Houghton, R. A., & Nassikas, A. A. (2017). Global and regional fluxes of carbon from land use and land cover change 1850–2015.Global Biogeochemical Cycles, 31(3), 456–472. https: //doi.org/10.1002/2016GB005546
[3]. Xi, J. P. (2020). Speech at the general debate of the 75th session of the United Nations General Assembly.Gazette of the State Council of the People's Republic of China, (28), 5–7.
[4]. Pouyat, R. (2014). Urban land use change effects on below- and aboveground carbon stocks—a global perspective and future research needs. In AGU Fall Meeting Abstracts. AGU Fall Meeting.
[5]. Chen, Y., Lu, H., & Li, J. (2020). Effects of land use cover change on carbon emissions and ecosystem services in Chengyu urban agglomeration,China. Stochastic Environmental Research and Risk Assessment, 34, 5993. https: //doi.org/10.1007/s00477-020-01819-8
[6]. Wang, M. T., Wei, W., & Xie, B. B. (2024). Spatio-temporal evolution characteristics of carbon sources/sinks in key ecological functional zones from a multi-scale perspective: A case study of the Yellow River Basin.Acta Scientiae Circumstantiae, 44(2), 477–488.
[7]. Chen, N., Xin, C., & Zhang, B. (2023). Contribution of multi-objective land use optimization to carbon neutrality: A case study of Northwest China.Ecological Indicators, 157. https: //doi.org/10.1016/j.ecolind.2023.111219
[8]. Foley, J. A. (2005). Global consequences of land use.Science, 309(5734), 570–574. https: //doi.org/10.1126/science.1111772
[9]. Li, Y. Y., Wei, W., & Zhou, J. J. (2023). Changes in China's land-use carbon emissions and coordinated zoning.Environmental Science, 44(3), 1267–1276. https: //doi.org/10.13227/j.hjkx.202204009
[10]. Zhu, H., Pan, Y. H., Chen, Y. T. (2024). Effects of land-use changes on carbon stocks and their components in Hangzhou from 2000 to 2030.Environmental Science & Technology, 47(11), 22–34. https: //doi.org/10.19672/j.cnki.1003-6504.0787.24.338
[11]. Zhou, Z., Meng, J. J., & Qi, Y. (2016). Research progress on the importance and pattern optimization of China's ecological land.Journal of Ecology, 35(1), 8. https: //doi.org/10.13292/j.1000-4890.201601.030
[12]. Ma, X. Z., & Wang, Z. (2015). Research progress on the impact of land-use change on regional carbon sources and sinks.Acta Ecologica Sinica, 35(17), 10. https: //doi.org/10.5846/stxb201312112932
[13]. Cheng, F. Y., Shi, P. J., & Zhang, W. P. (2023). Spatio-temporal differentiation of carbon budget and carbon compensation zoning in the Lanxi urban agglomeration from the perspective of major function zones: Based on DMSP/OLS and NPP/VIIRS nighttime light data.Acta Scientiae Circumstantiae, 43(11), 398–410.
[14]. Xu, S. (2024). Analysis of carbon emission characteristics and decarbonization strategies of China's five major urban agglomerations.Shanghai Urban Planning, (4), 48–55.
[15]. Liu, X., Ou, J., & Wang, S. (2018). Estimating spatiotemporal variations of city-level energy-related CO₂ emissions: An improved disaggregating model based on vegetation-adjusted nighttime light data.Journal of Cleaner Production, 177(MAR.10), 101–114. https: //doi.org/10.1016/j.jclepro.2017.12.197
[16]. Zhu, Z. M., Xu, J., Lin, W. X. (2024). Spatio-temporal coupling and driving factors of carbon reduction and high-quality economic development in the Yangtze River Delta urban agglomeration.Resources and Environment in the Yangtze Basin, 33(10), 2285–2298.
[17]. Song, S. L. (2024). Prediction and influencing factors of road traffic carbon emissions in the Central Plains urban agglomeration under carbon peak context [Master's thesis, Shijiazhuang Tiedao University]. https: //doi.org/10.27334/d.cnki.gstdy.2024.001223
[18]. Zhao, J., Ji, G., & Yue, Y. L. (2019). Spatio-temporal dynamics of urban residential CO₂ emissions and their driving forces in China using the integrated two nighttime light datasets.Applied Energy, 235(FEB.1), 612–624. https: //doi.org/10.1016/j.apenergy.2018.09.180
[19]. Liu, Z. Y., Zhang, S. S. (2024). Spatio-temporal evolution and influencing factors of energy consumption carbon emissions in China's urban agglomerations based on nighttime light data.Ecological Economy, 40(9), 23–31.
[20]. Zhou, D., Zhao, S., & Liu, S. (2014). Surface urban heat island in China's 32 major cities: Spatial patterns and drivers.Remote Sensing of Environment, 152, 51–61.
[21]. Zhao, X. C., Zhu, X., & Zhou, Y. Y. (2013). Analysis of carbon emission effects and spatio-temporal patterns of different land use types in Hunan Province.Acta Scientiae Circumstantiae, 33(3), 941–949. https: //doi.org/10.13671/j.hjkxxb.2013.03.037
[22]. Zhang, L. Q., Chen, S. P., & Wang, W. Q. (2013). Measurement and trend prediction of carbon emission effects of construction land changes in Anhui Province over the past 15 years: Based on the STIRPAT model.Acta Scientiae Circumstantiae, 33(3), 950–958.
[23]. Xiao, H. Y., Yuan, X. Z., & Li, B. (2012). Study on carbon emission effects of land use changes: A case study of Chongqing.Journal of Chongqing Normal University (Natural Science Edition), 29(1), 38–42+115.
[24]. Lai, L. (2010). Research on the carbon emission effects of land use in China [Master’s thesis, Nanjing University].
[25]. China Land & Resources News. (2023). Low-carbon emissions: A new topic for land use regulation [EB/OL].Retrieved January14, 2024, from https: //www.mnr.gov.cn/dt/ywbb/201810/t20181030_2249226.html
[26]. Su, Y. L., & Zhang, Y. F. (2011). Study on carbon emission benefits of land use changes in Shaanxi Province.Journal of Soil and Water Conservation, 25(1), 5. https: //doi.org/CNKI: SUN: TRQS.0.2011-01-033
[27]. Fang, J. Y., Guo, Z. D., & Park, S. L. (2007). Estimation of terrestrial vegetation carbon sinks in China from 1981 to 2000.Science in China D, 37(6), 804. https: //doi.org/10.3969/j.issn.1674-7240.2007.06.012
[28]. Shi, H. X., Mu, X. M., & Zhang, Y. L. (2012). Study on carbon emission effects of different land use types in Guangyuan, Sichuan Province.Bulletin of Soil and Water Conservation, 32(3), 6. https: //doi.org/CNKI: SUN: STTB.0.2012-03-022
[29]. Chen, J. S., Zhang, J. J., & Li, J. L. (2024). Spatio-temporal changes of carbon emissions and driving factors in the Beijing-Tianjin-Hebei region.Acta Ecologica Sinica, 44(6), 2270–2283. https: //doi.org/10.20103/j.stxb.202304290904
[30]. Niu, Y. W., Zhao, X. C., & Hu, Y. J. (2021). Spatio-temporal differentiation of land-use carbon emissions at county level in the Chang-Zhu-Tan region based on NPP-VIIRS nighttime lights.Acta Scientiae Circumstantiae. https: //doi.org/10.13671/j.hjkxxb.2021.0281
[31]. Xu, B. W., Luo, C. S., & Shen, J. Y. (2024). Measurement and influencing factors of per capita carbon emissions in Zhejiang Province.Environmental Science and Management, 49(10), 20–25.
[32]. Gao, L. B. (2024). Status and factor decomposition of industrial carbon emissions in Gansu Province based on LMDI.Science & Technology Innovation and Productivity, 45(10), 67–70.
[33]. Wang, S. N., Wu, Y. J., & Wang, H. Z. (2024). Analysis of driving factors of spatio-temporal changes of remote sensing drought in Ordos based on geographic detector [J/OL].Arid Zone Research, 1–12. Retrieved December 6, 2024, from http: //kns.cnki.net/kcms/detail/65.1095.X.20241115.1751.004.html
[34]. Deng, Y. J., Chen, H., & Hai, Y. F. (2024). Spatial patterns of land-use carbon emissions and carbon balance zoning in the Chengdu-Chongqing twin-city economic circle.Bulletin of Soil and Water Conservation, 44(5), 337–346. https: //doi.org/10.13961/j.cnki.stbctb.2024.05.036