


1 Introduction
Trust, as an important social source, is indispensable in social and economic activities. Recent decades have seen an increasing popularity of data driven analysis used for clarifying the controversies within trust literature, especially in the field of education economics [2, 7, 10, 16]. Most of these studies, however, conclude that education can foster trust which is defined as “people think most others in the society can be trusted”. Using a regression-discontinuity design and data collected in the CGSS, the present study argues that the educational effect is not likely a causal factor for generating trust in China, so the general assumption of positive causality stated in previous research is contextual. Also, with respect to the more comprehensive measures of trust—the intensity of trust and the radius of trust [6], this paper argues that the radius of trust is not likely to be affected by educational attainment.
2 Literature Review
Most literature on social trust and education is optimistic about their positive relationship. There are several reasons to believe that higher education can effectively increase levels of social trust: (1) at the individual level, education can make subject better informed and can improve her lie detection skills as well as the skills of handling other information, thus should increase her social trust [12][13]; (2) higher education background tend to create a “climate of trust” which forms a virtue circle for trust. This statement is supported by Helliwell and Putnam who have stated that once an individual know higher education makes people more trusting, she will be more likely to put trust on others who are more educated [7]; (3) the well-educated are more likely to have greater economic success, which reduces the possibility of exposing to crime and other social issues that may impair social trust [8]; (4) college education helps the formation of social trust since it make individuals “open-minded to accept otherness from heterogenous groups, and inspiring consensus on normative values” [9]; (5) it increases one’s contact with cosmopolitanism and more diversity, therefore, leads to less suspicion and more tolerance in socialization [18]; (6) education enhances people’s powerfulness, thus people that are more educated are capable of taking on more risk [20].
Historically, free universal education in the West in the 19th century significantly strengthened identification with the nation-state; education transforms individuals from "subjects" into active citizens, fostering higher expectations and demands for honesty from both society and government [17]. Education also fostered social and economic equality which is a crucial factor in building generalized trust [19]. Huang et al. (2011), in a meta-analysis of 28 studies, found that each additional year of schooling raised social trust by 4.6% of its standard deviation [9]. Research in the U.S., Denmark, and Germany further validates education's role in enhancing trust [1, 5, 15]. Frederiksen et al. argue that education not only heightens trust intensity but also broadens its scope, encouraging trust in a wider social spectrum [6].
3 The Compulsory Education Law (1986)
In China, each school year begins in September, with children aged six or older expected to start primary school. This study uses average schooling years across cohorts to examine the impact of compulsory education laws. However, educational outcomes are also influenced by two major events: the 1962 Great Famine and the 1999 University Enrollment Expansion. Therefore, the analysis focuses on individuals born within ten years around September 1971. Figure 1 shows a clear “jump” in schooling at this cutoff, affirming the policy's effect.
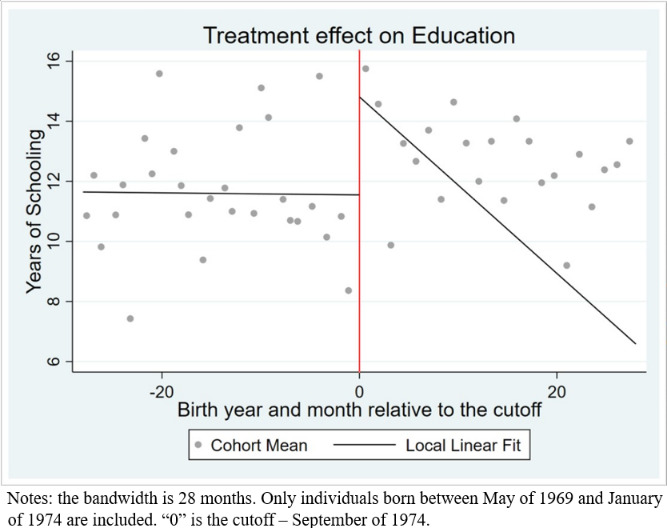
Figure 1. The effect of the Compulsory Education Law (1986) on educational attainments among cohorts
4 Data
The data taken in this study comes from the Chinese General Social Survey (CGSS). Till now this annual survey has experienced its Cycle I (2003-2008) and Cycle II (2010-2019), with its latest wave collected in 2015. This paper uses the 2015 wave.
4.1 Dependent Variables
The way of measuring social trust or “commonly believed generalized trust” is by asking a survey question: “Overall, do you agree that most people in this society can be trusted?” The respondents are offered with 5 options to this question: (1) Totally disagree; (2) Partly disagree; (3) Can’t say agree or not; (4) Partly agree; (5) Totally agree. A binary variable “social trust” is made by giving the value of “1” to individuals who answer (3), (4) or (5). Note that the CGSS set not only collect data of the trust in “most people”, but also that of trust in “strangers”, “colleagues”, “friends”, “relatives”, “neighbors”. The five items are conveniently ranked from the most distant category (“strangers”) to the closest group (“relatives”). Though those compliers have not been asked about the “radius” of trust directly, these data provide a chance to investigate the effects of education across a variety of relationships in socializing [6]. Each of these five forms of trust is measured by 5 options: (1) Almost all of them cannot be trusted; (2) Most of them cannot be trusted; (3) Half of them can be trusted; (4) Most of them can be trusted; (5) Almost all of them can be trusted. Similarly, binary variables are assigned a value of 1 if the answer is (3), (4), or (5).
4.2 Independent Variable: Education
Based on the question asked in the CGSS, the completed months of schooling is calculated as follows:
\( \begin{cases}(Year of getting highest degree - Year of Birth - 1 - 6), if Z≥0 \\ (Year of getting highest degree - Year of Birth - 6), if Z \lt 0\end{cases} \)
Here, Z (the running variable) represents the month relative to the cutoff, measured in months. If an individual is born in or after September, they start school the year after turning six; those born before September begin school in the year when they turn six. Therefore, when measuring educational attainment, individuals born in or after September in year 𝑡 t subtract one additional year compared to those born earlier. Based on the Compulsory Education Law (1986), six years are subtracted from the total education years in both cases.
4.3 Control Variables
The covariates in the OLS and 2SLS models include Age, Age^2, Female, Rural, Marriage, Han nationality, and Lower SES. Age is calculated as 2015 minus birth year (subtracting an additional year if born after October). The variables Female and Rural are dummies (Female = 1 for females, Rural = 1 for rural residents). Marriage is 1 if the individual is married or remarried, reflecting its positive association with social trust [4]. Han nationality and Lower SES are also included, the latter coded as 1 for respondents with lower SES.
Table 1. Summary statistics
|
(1) |
(2) |
(3) |
(4) |
(5) |
VARIABLES |
N |
mean |
Sd |
min |
max |
Female Rural Han Marriage Lower SES Age Treatment Education Social Trust Trust in Strangers Trust in Neighbors Trust in Relatives Trust in Friends Trust in Colleagues Birth year and month relative to the cutoff (in months) |
599 599 599 599 599 599 599 599 598 588 594 598 596 553 599 |
0.509 0.339 0.933 0.902 0.300 43.748 0.484 12.155 0.783 0.274 0.933 0.962 0.706 0.920 -1.147 |
0.500 0.474 0.250 0.298 0.459 1.475 0.500 6.182 0.413 0.446 0.251 0.192 0.456 0.271 16.979 |
0 0 0 0 0 41 0 0 0 0 0 0 0 0 -28 |
1 1 1 1 1 46 1 39 1 1 1 1 1 1 28 |
Notes: The table presents the summary statistics for baseline sample, with a selected optimal bandwidth of 28 month. |
|||||
The original sample contains 10968 observations. Given the impacts from The Great Famine in 1962 and the University Enrollment Expansion (1999) on domestic average educational level, 6807 observations have then been excluded and leave 4161 individuals born within the 10 years around the cutoff. Using bandwidth selection method suggested in previous research [11][14], 780 subjects born between May 1969 and January 1974 were selected, with 599 left after missing data removal. In this sample, 78% trust most others, 93% trust at least half of their neighbors, and 96% trust half or more of their relatives. Table 1 summarizes these statistics.
5 Method
This paper employs a fuzzy RD design because people in distant rural areas were not fully affected by the law enforcement. The linear probability model is shown below:
\( Y_{ict}=β_{0}+β_{1}Edu_{ict}+β_{2}X_{ict}+H(T_{ic},Z_{ic})+ε_{ict} \) (1)
Where \( Y_{ict} \) stands for the level of trust of subject “i” in cohort “c” at time “t”; \( Edu_{ict} \) represents the educated years of schooling for subject “i” in cohort “c” at time “t”; \( β_{1} \) is the parameter of interest; \( X_{ict} \) indicates a vector of observable individual characteristics that may affect trust, such as gender, age, socioeconomic status, marriage status, region; \( T_{ic} \) represents the “Treatment” dummy to see if an individual is affected by the enforcement of the Compulsory Education Law (1986), thus \( T_{ic} \) is equal to 1 if the subject was born in or after the September of 1971, otherwise equals to 0. \( Z_{ic} \) is the running variable which measures the birth year and month relative to the cut off. \( H(T_{ic},Z_{ic})=α_{1}Z_{ic}+α_{2}(T_{ic},×Z_{ic}^{2}) \) , allowing different trends existing on the two sides of the cutoff. \( ε_{ict} \) is the residual which captures all factors unobserved (i.e., personalities, family background, intelligence, etc.)
\( Edu_{ict}=γ_{0}+γ_{1}T_{ic}+γ_{2}X_{ict}+G(T_{ic},Z_{ic})+μ_{ict} \) (2)
Similar to \( H(T_{ic},Z_{ic}) \) , \( G(T_{ic},Z_{ic}) \) allows the appearance of two different trends around the cutoff; \( μ_{ict} \) is the error term, capturing all unobserved factors. \( T_{ic} \) .is the treatment dummy. Replace \( Edu_{ict} \) in equation (2) with that in equation (1) to get:
\( Y_{ict}=(β_{0}+β_{1}γ_{0})+β_{1}γ_{1}T_{ic}+(β_{2}+β_{1}γ_{2})X_{ict}+(β_{1}G(T_{ic},Z_{ic})+H(T_{ic},Z_{ic}))+(β_{1}μ_{ict}+ε_{ict}) \) (3)
6 RD Assumptions
Lee and Lemieux (2010) have suggested other two criteria essential for checking the validity of a causal inference: (1) subjects cannot (fully) manipulate the running variable “Z”; (2) all pre-determined variables (observed and unobserved) are supposed to be continuous at the cutoff. The result of testing for manipulation of the running variable is shown in Fig. 2, which indicates symmetry, suggesting no manipulation. Assuming continuity of unobserved factors [14], I then verify six covariates: rural compliance rate, marital status, socioeconomic status, gender, ethnicity, and age. Results in Fig.2 and Fig. 3 show that both assumptions are met.
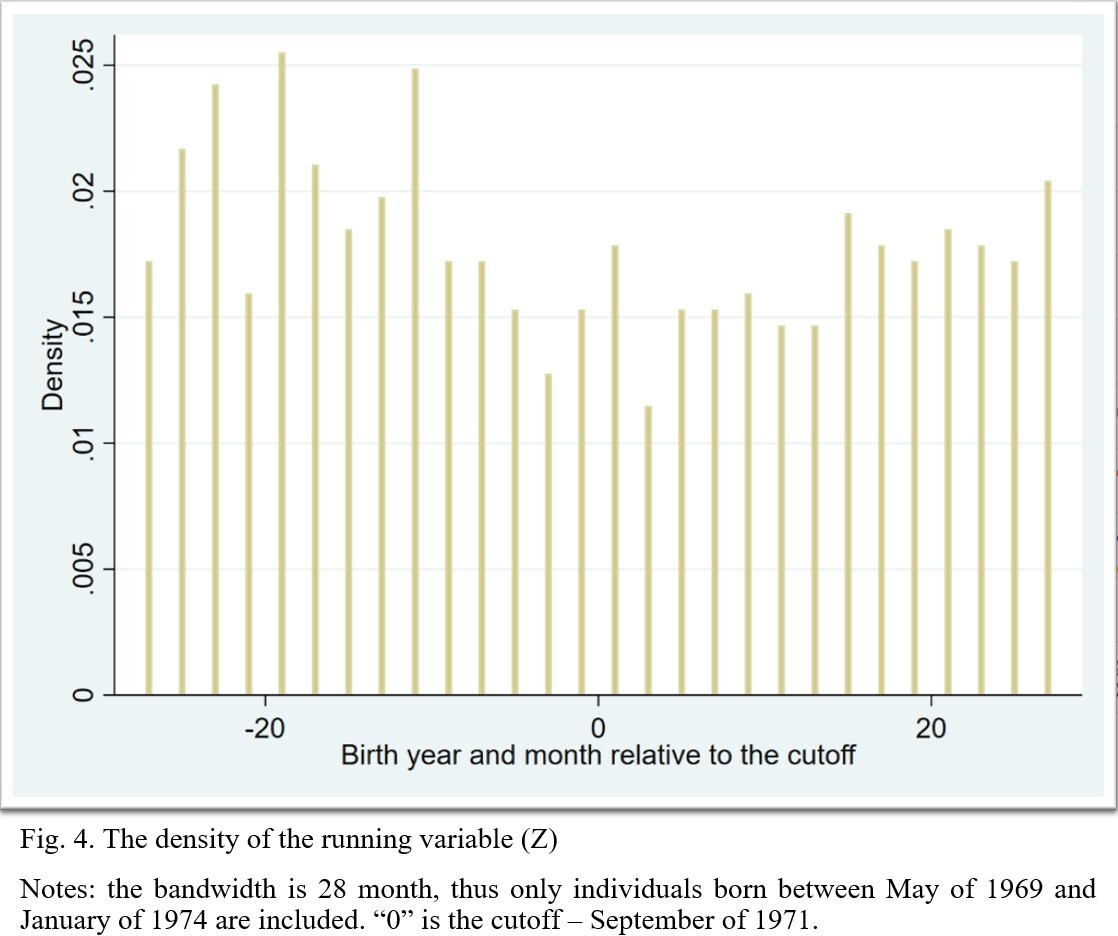
Figure 2. The density of running variable (Z)
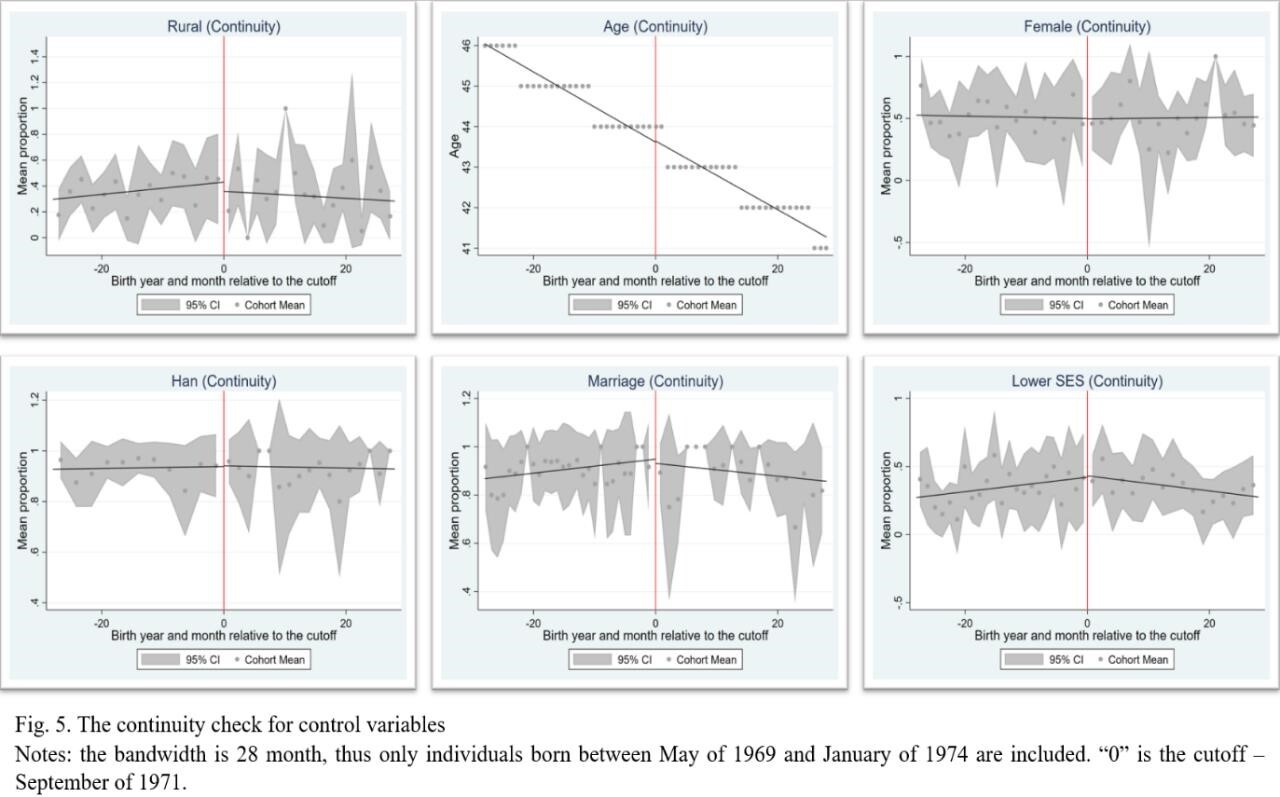
Figure 3. The continuity check for control variables
7 Correlation Test (OLS)
Table 2. The educational effects on generalized trust and trust in different distant relationships
|
(1) |
(2) |
(3) |
(4) |
(5) |
(6) |
(7) |
|
|
|
|
|
|
||
Panel A: Education and social trust |
|||||||
Education |
0.00298 |
0.00470* |
0.00505* |
0.00523** |
0.00518** |
0.00569** |
0.00484* |
(0.00246) |
(0.00254) |
(0.00258) |
(0.00264) |
(0.00263) |
(0.00262) |
(0.00265) |
|
Observations |
598 |
598 |
598 |
598 |
598 |
598 |
598 |
Panel B: Education and trust in strangers |
|||||||
Education |
0.00630** |
0.00597* |
0.00588* |
0.00582* |
0.00515 |
0.00500 |
0.00478 |
(0.00312) |
(0.00320) |
(0.00321) |
(0.00323) |
(0.00325) |
(0.00325) |
(0.00328) |
|
Observations |
588 |
588 |
588 |
588 |
588 |
588 |
588 |
Panel C: Education and trust in colleagues |
|||||||
Education |
0.000372 |
0.000227 |
0.000284 |
-5.89e-05 |
-5.95e-05 |
1.53e-05 |
-0.000681 |
(0.00215) |
(0.00220) |
(0.00217) |
(0.00217) |
(0.00218) |
(0.00212) |
(0.00208) |
|
Observations |
553 |
553 |
553 |
553 |
553 |
553 |
553 |
Panel D: Education and trust in friends (Unfamiliar) |
|||||||
Education |
0.00412 |
0.00484 |
0.00477 |
0.00425 |
0.00423 |
0.00407 |
0.00323 |
(0.00290) |
(0.00301) |
(0.00303) |
(0.00307) |
(0.00307) |
(0.00308) |
(0.00310) |
|
Observations |
596 |
596 |
596 |
596 |
596 |
596 |
596 |
Panel E: Education and trust in relatives |
|||||||
Education |
-0.000269 |
3.68e-05 |
0.000141 |
0.000120 |
0.000194 |
0.000303 |
-5.00e-05 |
(0.00155) |
(0.00157) |
(0.00158) |
(0.00157) |
(0.00159) |
(0.00162) |
(0.00161) |
|
Observations |
598 |
598 |
598 |
598 |
598 |
598 |
598 |
Panel F: Education and trust in neighbors |
|||||||
Education |
0.000841 |
0.00134 |
0.00141 |
0.00164 |
0.00165 |
0.00171 |
0.00127 |
(0.00178) |
(0.00184) |
(0.00182) |
(0.00180) |
(0.00180) |
(0.00183) |
(0.00181) |
|
Observations |
594 |
594 |
594 |
594 |
594 |
594 |
594 |
Notes: The optimal bandwidth is 28 months, only individuals born between may of 1969 and January of 1974 are included. All regressions include “cohort trends”. In regression (1), only “Education” is added; in regression (2), “Rural” dummy is added; in regression (3), “Age” and “Age Square” are added; in regression (4), “Female” dummy is added; in regression (5), “Han” dummy is added; in regression (6), “Marriage” dummy is added; in regression (7), “Lower SES” dummy is added. Robust standard errors in parentheses. Significance levels: ***, p<0.01; **, p<0.05; *, p<0.1. |
|||||||
This section examines the link between education and generalized trust intensity. Panel A of Table 2 presents correlations between education and social trust, while Panel B covers trust in strangers. Results across regressions (2) to (7) show consistent coefficients between 0.0047 and 0.0057, mostly significant at the 10% level, suggesting missing regional controls may cause negative bias. Each additional year of education correlates with a 0.5% increase in social trust probability. Results in Panels C and D show that education has no statistically significant impact on trust in colleagues or unfamiliar friends, with coefficients near zero. For trust in relatives (Panel E), results align with previous findings [6], showing minimal correlation with education. In trust toward neighbors (Panel F), a regional control mitigates a potential negative bias, but results remain statistically insignificant. Overall, education has negligible effects on trust intensity across different relationships.
8 Causal Inference
Table 3. The effects of the Compulsory Education Law (1986) on education (OLS)
|
(1) |
(2) |
(3) |
(4) |
(5) |
(6) |
(7) |
VARIABLES |
Years of Schooling |
||||||
|
|
|
|
|
|
|
|
Treatment |
2.217** |
1.835* |
3.325*** |
3.346*** |
3.370*** |
3.382*** |
3.398*** |
|
(1.092) |
(1.025) |
(1.201) |
(1.197) |
(1.193) |
(1.191) |
(1.190) |
Rural |
3.511*** |
3.485*** |
3.528*** |
3.535*** |
3.468*** |
3.479*** |
|
|
(0.451) |
(0.449) |
(0.451) |
(0.449) |
(0.446) |
(0.445) |
|
Age |
|
55.65** |
56.74*** |
57.59*** |
57.72*** |
59.66*** |
|
|
|
(21.91) |
(21.68) |
(21.81) |
(21.75) |
(21.55) |
|
Age Square |
|
-0.649** |
0.660*** |
0.670*** |
0.671*** |
0.693*** |
|
|
|
(0.252) |
(0.249) |
(0.251) |
(0.250) |
(0.248) |
|
Female |
|
1.666*** |
1.655*** |
1.679*** |
1.633*** |
||
|
|
(0.482) |
(0.483) |
(0.482) |
(0.480) |
||
Han |
|
-0.678 |
-0.707 |
-0.750 |
|||
|
|
(1.052) |
(1.058) |
(1.054) |
|||
Marriage |
|
-1.275 |
-1.369 |
||||
|
|
(0.960) |
(0.946) |
||||
Lower SES |
|
-1.292** |
|||||
|
|
(0.513) |
|||||
Cohort Trends |
Yes |
Yes |
Yes |
Yes |
Yes |
Yes |
Yes |
Observations |
599 |
599 |
599 |
599 |
599 |
599 |
599 |
Notes: The “Treatment” dummy is 1 when an individual is affected by the Compulsory Education Law (1986). “Cohort Trends” includes the running variable “Z” and its interaction with “Treatment” T. Robust standard errors in parentheses. Significance levels: ***, p<0.01; **, p<0.05; *, p<0.1 |
|||||||
This section tests if education causes any increase in the intensity of generalized trust or the radius of trust. Adding controls as in Table 2, the 2SLS results in Table 4 show educational effects on social trust range from 0.036 to 0.065, but none are statistically significant, suggesting no causal relationship. For trust in strangers, the estimates (Panel B) range from -0.003 to -0.010, all negligible and statistically insignificant at the 10% level. Thus, the results provide no evidence of a causal link between education and the intensity of generalized trust. The results for testing the causal effect of education on trust in colleagues and unfamiliar friends, shown in Panels C and D. The coefficients for colleagues become negative, but none in either panel are statistically significant at the 10% level. Panels E and F examine causality on trust in closer relationships, and again, no estimates reach significance. Thus, no evidence supports a causal relationship between education and trust.
Table 4. The educational effect on generalized trust and trust in different distant relationships (2SLS)
|
(1) |
(2) |
(3) |
(4) |
(5) |
(6) |
(7) |
|
|
|
|
|
|
||
Panel A: Education and social trust |
|||||||
Education |
0.0505 |
0.0652 |
0.0370 |
0.0366 |
0.0367 |
0.0361 |
0.0363 |
(0.0398) |
(0.0518) |
(0.0280) |
(0.0276) |
(0.0274) |
(0.0270) |
(0.0276) |
|
Observations |
598 |
598 |
598 |
598 |
598 |
598 |
598 |
Panel B: Education and trust in strangers |
|||||||
Education |
0.00644 |
0.00966 |
-0.00359 |
0.00350 |
-0.00378 |
-0.00365 |
-0.00343 |
(0.0376) |
(0.0452) |
(0.0280) |
(0.0278) |
(0.0276) |
(0.0276) |
(0.0274) |
|
Observations |
588 |
588 |
588 |
588 |
588 |
588 |
588 |
Panel C: Education and trust in colleagues |
|||||||
Education |
-0.0138 |
-0.0183 |
-0.0119 |
-0.0127 |
-0.0126 |
-0.0127 |
-0.0123 |
(0.0193) |
(0.0250) |
(0.0161) |
(0.0167) |
(0.0165) |
(0.0164) |
(0.0163) |
|
Observations |
553 |
553 |
553 |
553 |
553 |
553 |
553 |
Panel D: Education and trust in friends (Unfamiliar) |
|||||||
Education |
0.00199 |
0.00145 |
0.000238 |
0.000147 |
0.000144 |
0.000271 |
0.000811 |
(0.0364) |
(0.0434) |
(0.0275) |
(0.0274) |
(0.0272) |
(0.0272) |
(0.0268) |
|
Observations |
596 |
596 |
596 |
596 |
596 |
596 |
596 |
Panel E: Education and trust in relatives |
|||||||
Education |
0.0204 |
0.0255 |
0.0146 |
0.0145 |
0.0137 |
0.0135 |
0.0137 |
(0.0196) |
(0.0247) |
(0.0133) |
(0.0132) |
(0.0127) |
(0.0127) |
(0.0126) |
|
Observations |
598 |
598 |
598 |
598 |
598 |
598 |
598 |
Panel F: Education and trust in neighbors |
|||||||
Education |
0.00603 |
0.00868 |
0.00626 |
0.00611 |
0.00598 |
0.00592 |
0.00618 |
(0.0217) |
(0.0267) |
(0.0166) |
(0.0165) |
(0.0163) |
(0.0163) |
(0.0161) |
|
Observations |
594 |
594 |
594 |
594 |
594 |
594 |
594 |
Notes: Robust standard errors in parentheses. Significance levels: ***, p<0.01; **, p<0.05; *, p<0.1. |
|||||||
9 Robustness Check
The bandwidths employed for checking robustness are 75%, 125%, 150%, 175%, 200%, 225% of 28 months, respectively. For comparison, I put the 2SLS estimates within the current bandwidth (28) in column (1) of Table 5. Panel A shows first-stage results with coefficients between 1.6 and 4.1, all significant at the 10% level, confirming the law’s positive impact on education. However, Panel B and C reveal no significant impact of education on generalized trust. Similarly, Panels D to G examine trust across relationship types, with all results remaining statistically insignificant. Overall, the 2SLS findings under different bandwidths do not support the hypothesis that education significantly improves trust.
Table 5. Robustness check: Bandwidth selection test
|
(1) |
(2) |
(3) |
(4) |
(5) |
(6) |
(7) |
Bandwidths (months) |
±28 |
±63 |
±56 |
±49 |
±42 |
±35 |
±21 |
|
|
|
|
|
|
||
Panel A: The effects of the Compulsory Education Law (1986) on education |
|||||||
Treatment |
3.398*** |
1.601* |
1.799* |
1.878* |
2.929*** |
2.853** |
4.067*** |
(1.190) |
(0.875) |
(0.952) |
(0.972) |
(1.057) |
(1.111) |
(1.366) |
|
Observations |
599 |
1331 |
1191 |
1069 |
909 |
758 |
439 |
Panel B: Education and social trust |
|||||||
Education |
0.0363 |
0.0175 |
0.00826 |
0.0238 |
0.0292 |
0.0331 |
0.0261 |
(0.0267) |
(0.0399) |
(0.0380) |
(0.0381) |
(0.0266) |
(0.0290) |
(0.0234) |
|
Observations |
598 |
1329 |
1189 |
1067 |
907 |
756 |
439 |
Panel C: Education and trust in strangers |
|||||||
Education |
-0.00343 |
0.000237 |
-0.0182 |
-0.0169 |
0.0121 |
0.00224 |
0.00578 |
(0.0274) |
(0.0418) |
(0.0422) |
(0.0407) |
(0.0291) |
(0.0301) |
(0.0247) |
|
Observations |
588 |
1309 |
1171 |
1050 |
892 |
745 |
430 |
Panel D: Education and trust in colleagues |
|||||||
Education |
-0.0123 |
-0.00138 |
-0.0114 |
0.00888 |
0.00480 |
0.00312 |
-0.0143 |
(0.0163) |
(0.0233) |
(0.0230) |
(0.0221) |
(0.0151) |
(0.0164) |
(0.0148) |
|
Observations |
553 |
1227 |
1097 |
982 |
836 |
697 |
403 |
Panel E: Education and trust in friends (Unfamiliar) |
|||||||
Education |
0.000811 |
0.0148 |
-0.0103 |
0.00371 |
0.0210 |
0.0168 |
0.000913 |
(0.0268) |
(0.0426) |
(0.0407) |
(0.0392) |
(0.0283) |
(0.0297) |
(0.0243) |
|
Observations |
596 |
1321 |
1183 |
1061 |
903 |
752 |
437 |
Panel F: Education and trust in relatives |
|||||||
Education |
0.0137 |
0.0142 |
0.00388 |
0.00471 |
0.0146 |
0.0188 |
0.0138 |
(0.0126) |
(0.0194) |
(0.0171) |
(0.0167) |
(0.0122) |
(0.0137) |
(0.0115) |
|
Observations |
598 |
1329 |
1189 |
1067 |
908 |
757 |
438 |
Panel G: Education and trust in neighbors |
|||||||
Education |
0.00618 |
0.0290 |
0.0121 |
0.00852 |
0.0172 |
0.0143 |
0.0122 |
(0.0161) |
(0.0298) |
(0.0246) |
(0.0235) |
(0.0165) |
(0.0170) |
(0.0143) |
|
Observations |
594 |
1322 |
1184 |
1062 |
902 |
753 |
434 |
Notes: Robust standard errors in parentheses. Significance levels: ***, p<0.01; **, p<0.05; *, p<0.1. |
|||||||
10 Conclusion
This paper challenges the assumption that higher education inherently increases trust. OLS regressions indicate that education is positively correlated with generalized trust intensity but not its scope. To explore causality, the study uses a 2SLS approach with the 1986 Compulsory Education Law as an instrument, finding no causal link. Although previous studies suggest education fosters trust, their reliance on OLS weakens causal claims. In sum, education may correlate with but does not causally enhance trust in others.
References
[1]. Alesina, A., & Ferrara, E. (2002). Who trusts others? Journal of Public Economics, 85(2), 207-234. https://doi.org/10.1016/S00472727(01)00084-6
[2]. Borgonovi, F. (2012). The relationship between education and levels of trust and tolerance in Europe. The British Journal of Sociology, 63(1), 146-167. https://doi.org/10.1111/j.1468-4446.2011.01397.
[3]. Calonico, S., et al. (2014). Robust nonparametric confidence intervals for regression discontinuity designs. Econometrica, 82(6), 2295-2326. https://doi.org/10.3982/ECTA11757
[4]. Diener, E., & Seligman, M. (2004). Beyond money: Toward an economy of well-being. Psychological Science in the Public Interest, 5(1), 1-31. https://doi.org/10.1111/j.0963-7214.2004.00501001.x
[5]. Frederiksen, M. (2014). And mistrust take the hindmost: Generalized trust in Denmark from 1990-2008. Nordic Journal of Social Research, 5(1), 80-109. https://doi.org/10.7577/njsr.2076
[6]. Frederiksen, M., et al. (2016). Education and trust: Exploring the association across social relationships and nations. Acta Sociologica, 59(4), 293-308. https://doi.org/10.1177/0001699316658936
[7]. Helliwell, F., & Putnam, D. (2007). Education and social capital. Eastern Economic Journal, 33(1), 1-19. https://www.nber.org/papers/w7121
[8]. Huang, L., et al. (2009). A meta-analysis of the effect of education on social capital. Economics of Education Review, 28(4), 454-464. https://doi.org/10.1016/j.econedurev.2008.03.004
[9]. Huang, L., et al. (2011). College education and social trust: An evidence-based study on the causal mechanisms. Social Indicators Research, 104, 287-310. https://doi.org/10.1007/s11205-010-9744
[10]. Huang, L., et al. (2012). Does education promote social capital? Evidence from IV analysis and nonparametric-bound analysis. Empirical Economics, 42, 1011-1034. https://doi.org/10.1007/s00181-011-0450-7
[11]. Imbens, G., & Lemieux, T. (2008). Regression discontinuity designs: A guide to practice. Journal of Econometrics, 142(2), 615-635. https://doi.org/10.1016/j.jeconom.2007.05.001
[12]. Keefer, P., & Knack, S. (2005). Social capital, social norms, and the new institutional economics. In Handbook of New Institutional Economics (pp. 701-725). https://link.springer.com/chapter/10.1007/0-387-25092-1_28
[13]. Kruger, F. (2021). The neurobiology of trust. Cambridge University Press. https://doi.org/10.1017/9781108770880
[14]. Lee, D., & Lemieux, T. (2010). Regression discontinuity designs in economics. Journal of Economic Literature, 48(2), 281-355. https://doi.org/10.1257/jel.48.2.281
[15]. Margaryan, L., et al. (2021). Does education affect attitudes towards immigration? Evidence from Germany. J Human Resources, 56(2), 446-479. https://doi.org/10.3368/jhr.56.2.0318-9372R1
[16]. Putnam, D. (2000). Bowling alone: The collapse and revival of American community. Simon and Schuster. https://books.google.co.uk/books
[17]. Rothstein, B., & Uslaner, E. (2005). All for all: Equality, corruption, and social trust. World Politics, 58(1), 41-72. https://doi.org/10.1353/wp.2006.0022
[18]. Sullivan, J., et al. (1982). Political tolerance and American democracy. University of Chicago Press. https://books.google.co.uk/books
[19]. Uslaner, E. (2002). The moral foundation of trust. Cambridge University Press. https://dx.doi.org/10.2139/ssrn.824504
[20]. Wu, C., & Shi, Z. (2020). Education and social trust in transitional China. Chinese Sociological Review, 52(2), 115-143. https://doi.org/10.1080/21620555.2019.1665995
Cite this article
Wang,X. (2024). How Education Shapes Trust: Empirical Evidence from China. Journal of Applied Economics and Policy Studies,14,31-39.
Data availability
The datasets used and/or analyzed during the current study will be available from the authors upon reasonable request.
Disclaimer/Publisher's Note
The statements, opinions and data contained in all publications are solely those of the individual author(s) and contributor(s) and not of EWA Publishing and/or the editor(s). EWA Publishing and/or the editor(s) disclaim responsibility for any injury to people or property resulting from any ideas, methods, instructions or products referred to in the content.
About volume
Journal:Journal of Applied Economics and Policy Studies
© 2024 by the author(s). Licensee EWA Publishing, Oxford, UK. This article is an open access article distributed under the terms and
conditions of the Creative Commons Attribution (CC BY) license. Authors who
publish this series agree to the following terms:
1. Authors retain copyright and grant the series right of first publication with the work simultaneously licensed under a Creative Commons
Attribution License that allows others to share the work with an acknowledgment of the work's authorship and initial publication in this
series.
2. Authors are able to enter into separate, additional contractual arrangements for the non-exclusive distribution of the series's published
version of the work (e.g., post it to an institutional repository or publish it in a book), with an acknowledgment of its initial
publication in this series.
3. Authors are permitted and encouraged to post their work online (e.g., in institutional repositories or on their website) prior to and
during the submission process, as it can lead to productive exchanges, as well as earlier and greater citation of published work (See
Open access policy for details).
References
[1]. Alesina, A., & Ferrara, E. (2002). Who trusts others? Journal of Public Economics, 85(2), 207-234. https://doi.org/10.1016/S00472727(01)00084-6
[2]. Borgonovi, F. (2012). The relationship between education and levels of trust and tolerance in Europe. The British Journal of Sociology, 63(1), 146-167. https://doi.org/10.1111/j.1468-4446.2011.01397.
[3]. Calonico, S., et al. (2014). Robust nonparametric confidence intervals for regression discontinuity designs. Econometrica, 82(6), 2295-2326. https://doi.org/10.3982/ECTA11757
[4]. Diener, E., & Seligman, M. (2004). Beyond money: Toward an economy of well-being. Psychological Science in the Public Interest, 5(1), 1-31. https://doi.org/10.1111/j.0963-7214.2004.00501001.x
[5]. Frederiksen, M. (2014). And mistrust take the hindmost: Generalized trust in Denmark from 1990-2008. Nordic Journal of Social Research, 5(1), 80-109. https://doi.org/10.7577/njsr.2076
[6]. Frederiksen, M., et al. (2016). Education and trust: Exploring the association across social relationships and nations. Acta Sociologica, 59(4), 293-308. https://doi.org/10.1177/0001699316658936
[7]. Helliwell, F., & Putnam, D. (2007). Education and social capital. Eastern Economic Journal, 33(1), 1-19. https://www.nber.org/papers/w7121
[8]. Huang, L., et al. (2009). A meta-analysis of the effect of education on social capital. Economics of Education Review, 28(4), 454-464. https://doi.org/10.1016/j.econedurev.2008.03.004
[9]. Huang, L., et al. (2011). College education and social trust: An evidence-based study on the causal mechanisms. Social Indicators Research, 104, 287-310. https://doi.org/10.1007/s11205-010-9744
[10]. Huang, L., et al. (2012). Does education promote social capital? Evidence from IV analysis and nonparametric-bound analysis. Empirical Economics, 42, 1011-1034. https://doi.org/10.1007/s00181-011-0450-7
[11]. Imbens, G., & Lemieux, T. (2008). Regression discontinuity designs: A guide to practice. Journal of Econometrics, 142(2), 615-635. https://doi.org/10.1016/j.jeconom.2007.05.001
[12]. Keefer, P., & Knack, S. (2005). Social capital, social norms, and the new institutional economics. In Handbook of New Institutional Economics (pp. 701-725). https://link.springer.com/chapter/10.1007/0-387-25092-1_28
[13]. Kruger, F. (2021). The neurobiology of trust. Cambridge University Press. https://doi.org/10.1017/9781108770880
[14]. Lee, D., & Lemieux, T. (2010). Regression discontinuity designs in economics. Journal of Economic Literature, 48(2), 281-355. https://doi.org/10.1257/jel.48.2.281
[15]. Margaryan, L., et al. (2021). Does education affect attitudes towards immigration? Evidence from Germany. J Human Resources, 56(2), 446-479. https://doi.org/10.3368/jhr.56.2.0318-9372R1
[16]. Putnam, D. (2000). Bowling alone: The collapse and revival of American community. Simon and Schuster. https://books.google.co.uk/books
[17]. Rothstein, B., & Uslaner, E. (2005). All for all: Equality, corruption, and social trust. World Politics, 58(1), 41-72. https://doi.org/10.1353/wp.2006.0022
[18]. Sullivan, J., et al. (1982). Political tolerance and American democracy. University of Chicago Press. https://books.google.co.uk/books
[19]. Uslaner, E. (2002). The moral foundation of trust. Cambridge University Press. https://dx.doi.org/10.2139/ssrn.824504
[20]. Wu, C., & Shi, Z. (2020). Education and social trust in transitional China. Chinese Sociological Review, 52(2), 115-143. https://doi.org/10.1080/21620555.2019.1665995