


1. Introduction
Sorghum (Sorghum bicolor L.), a member of the Poaceae family, is also known by other names such as shushu and luyi. As one of the world’s major economic crops, it is widely cultivated across tropical to temperate regions [1,2]. Sorghum holds diversified value in use, serving key roles in food supply, livestock feed, industrial brewing, and the production of renewable energy [3]. Within agricultural production systems, the selection of sorghum cultivars plays a decisive role in determining crop yield, quality traits, environmental adaptability, and economic returns [4]. Optimizing varietal selection based on regional climate characteristics, soil properties, and market demands [5] can not only enhance the economic efficiency of crop production, but also contribute to sustainable agricultural ecosystems and improved resilience to climate change [6]. Notably, local germplasm resources, as a vital genetic foundation for crop improvement, provide essential genes for the development of high-yielding, disease-resistant, and high-quality sorghum cultivars [7]. Currently, the sorghum industry faces several critical challenges [8], including a lack of genetic diversity in dominant cultivars, widespread cultivar degradation, declining resistance to pests and diseases, and increasing genetic homogeneity. In this context, enhancing the conservation and utilization of region-specific sorghum germplasm is of great practical significance for the genetic improvement and renewal of brewing sorghum varieties.
Metabolomics is a scientific discipline dedicated to the systematic study of small-molecule metabolites within biological systems, typically targeting compounds with molecular weights below 1500 Da. By comprehensively analyzing the composition, concentration, and dynamic changes of these metabolites, metabolomics provides insights into the metabolic characteristics and regulatory mechanisms of organisms [9]. These metabolites include amino acids, organic acids, sugars, lipids, nucleotides, and others [10]. Metabolomics is characterized by its comprehensiveness, dynamic profiling, high sensitivity, and multidimensionality [11]. Among available platforms, ultra-performance liquid chromatography-tandem mass spectrometry (UPLC-MS/MS) has become a widely adopted tool in targeted metabolomics research due to its superior separation capability, detection sensitivity, and mass resolution. This technology has found broad application across multiple disciplines, including food composition analysis [12], disease diagnostics [13], and plant metabolite identification [14]. For instance, Alma D. Paz González et al. [15] employed UPLC-MS to identify and quantify antibiotic residues in pork samples from supermarkets and butcher shops in two major cities in northeastern Mexico. Seven antibiotic residues were detected, highlighting poor food industry management and a potential health risk to local populations. Yang Shuo [16] developed and optimized a hair detection method for mescaline using LC-MS/MS. The method exhibited a good linear range between 10–1000 pg/mg, with limits of detection (LOD) and quantification (LOQ) of 3 pg/mg and 10 pg/mg, respectively. The analysis process was completed in just 5 minutes. Validation results showed intra- and inter-day precision (RSD) below 15%, accuracy (bias range: –11.2% to 6.8%) within acceptable limits, recoveries between 85.0% and 101.0%, and matrix effects ranging from 92.0% to 105.0%. This method has been successfully applied in 19 forensic case analyses. Chen Yangxin et al. [17] developed a multi-residue detection and dietary risk assessment method for 28 fungicides in Coix lacryma-jobi using UPLC-MS/MS combined with an enhanced QuEChERS protocol.
In this study, we employed a broad-targeted metabolomics approach based on the UPLC-MS/MS platform to systematically compare the metabolite profiles of fruits from five sorghum cultivars. By analyzing the compositional differences in primary metabolites and associated metabolic pathways among samples from different geographic origins, we identified characteristic metabolic biomarkers with potential for cultivar differentiation. The findings provide a scientific basis for the development and utilization of regional sorghum germplasm resources and offer important guidance for the breeding of sorghum varieties specifically used in liquor production.
2. Materials and methods
2.1. Materials and reagents
Detailed information on the sorghum varieties used in this study is shown in Table 1. For each variety, three biological replicates were set. Seeds of uniform size, free from mechanical damage or mold, were selected and stored at −80°C for analysis.
Reagents included chromatographic-grade methanol, acetonitrile, and analytical standards. Methanol and acetonitrile (chromatographic grade) were purchased from Merck, and standard substances were obtained from BioBioPha/Sigma-Aldrich.
Table 1. Information of sorghum varieties
ID | Variety Name | Origin |
1 | Langnuo Red 19 (lnh) | Luzhou, Sichuan |
2 | Jinnuoliang No. 1 (jinnl) | Luzhou, Sichuan |
3 | Jinnuoliang No. 1 (jinl) | Luzhou, Sichuan |
4 | Hongyingzi (hyz) | Huairen, Guizhou |
5 | Liaosa No. 19 (lz19) | Liaoning |
2.2. Instruments and equipment
The UPLC-FTMS system was manufactured by Thermo Fisher Scientific. The BEH C18 (100 mm × 2.1 mm i.d., 1.7 µm) and BEH Amide (100 mm × 2.1 mm i.d., 1.7 µm) chromatographic columns were from Agilent Technologies. The nitrogen evaporator and the benchtop rapid centrifugal concentrator were provided by Shanghai Sumspring Instrument Co., Ltd. The tissue homogenizer and the high-speed refrigerated centrifuge were from Shanghai Jingxin Industrial Development Co., Ltd. The electronic balance was also from Shanghai Jingxin Industrial Development Co., Ltd.
2.3. Methods
2.3.1. Sample preparation
(1) Pre-treatment: The biological samples were freeze-dried in a Scientz-100F freeze dryer under vacuum conditions.
(2) Grinding: The dried samples were ground using a Retsch MM 400 mixer mill at 30 Hz for 1.5 minutes to obtain a uniform powder.
(3) Extraction: Precisely 100 mg of powder was weighed and dissolved in 1.2 mL of 70% methanol solution.
(4) Incubation: The mixture was left to stand at 4°C overnight and vortexed for 30 seconds every 30 minutes, repeated six times.
(5) Filtration: After centrifugation at 12,000 rpm for 10 minutes, the supernatant was filtered through a 0.22 μm membrane and collected in injection vials for subsequent UPLC-MS/MS analysis.
2.3.2. Quality control samples
To monitor the stability of the analytical system, Quality Control (QC) samples were prepared by pooling equal volumes of all sample extracts. One QC sample was inserted into the detection sequence every 5–10 test samples to evaluate the reproducibility of the method throughout the experiment.
2.3.3. LC-MS/MS analysis
Chromatographic conditions:
(1) Separation was performed using an Agilent SB-C18 reversed-phase column (1.8 µm, 2.1×100 mm);
(2) The mobile phases consisted of 0.1% formic acid in ultrapure water (A) and 0.1% formic acid in acetonitrile (B);
(3) The gradient elution program was as follows: 5% B at 0 min, linearly increased to 95% B over 9 min, held for 1 min, then decreased to 5% B in 1.1 min and equilibrated for 3 min;
(4) The flow rate was set at 0.35 mL/min, the column oven temperature at 40°C, and the injection volume was 4 µL.
Mass spectrometry conditions:
Data acquisition was performed using an AB4500 Q TRAP UPLC/MS/MS system equipped with an electrospray ionization (ESI) source and a hybrid linear ion trap-triple quadrupole mass analyzer. The optimized ionization conditions were: source temperature 550°C; ion spray voltage +5500 V (positive mode) / −4500 V (negative mode); gas settings: GS1 = 50 psi, GS2 = 60 psi, curtain gas = 25 psi. The collision cell was set to high sensitivity mode. Mass axis calibration was conducted using 10 μmol/L (QQQ mode) and 100 μmol/L (LIT mode) polypropylene glycol standard solutions. Multiple reaction monitoring (MRM) mode was employed with nitrogen as the collision gas. Optimal declustering potentials (DP) and collision energies (CE) were determined for each ion pair, and MRM detection windows were set according to metabolite retention times.
2.3.4. Data analysis
SPSS 21.0 was used to perform ANOVA on physicochemical parameters and yield-related indices of the sorghum samples. Metabolomic data analysis was conducted using the SIMCA 14.1 software in conjunction with the “ropls” package (version 1.6.2) in R. The statistical approaches included: Principal Component Analysis (PCA) to assess global metabolic variation among samples; Hierarchical Cluster Analysis (HCA) to visualize sample similarity; Orthogonal Partial Least Squares Discriminant Analysis (OPLS-DA) to identify metabolites with significant inter-group differences. Functional annotation of differential metabolites was conducted using the KEGG pathway database (https://www.kegg.jp/kegg/pathway.html), enabling systematic investigation of related metabolic pathways and regulatory networks. Furthermore, clustering and pathway enrichment analysis were performed using the scipy.stats module in Python, with Fisher's exact test applied to identify statistically significant pathways.
3. Results and analysis
3.1. Principal Component Analysis (PCA)
As shown in Figure 1, Principal Component Analysis (PCA) revealed the metabolic profile distribution patterns of samples from the five experimental groups. The First Principal Component (PC1) and the Second Principal Component (PC2) accounted for 24.51% and 19.89% of the total variance, respectively. The sample distribution in PCA space exhibited the following characteristics: (1) clear separation trends among groups along both PC1 and PC2 dimensions; (2) tight clustering of samples within each group, indicating good reproducibility; and (3) quality control (QC) samples were centrally distributed among the groups, further confirming the significant inter-group metabolic differences. Figure 2 shows the results of hierarchical clustering analysis (HCA) of differential metabolites. The heatmap illustrates pronounced differences in metabolite expression patterns among the experimental groups. This grouping pattern is consistent with the PCA results, jointly confirming the presence of distinct metabolic profiles across the five experimental groups. Notably, differential metabolites displayed regular expression changes across comparison groups, providing a crucial basis for subsequent pathway analysis.
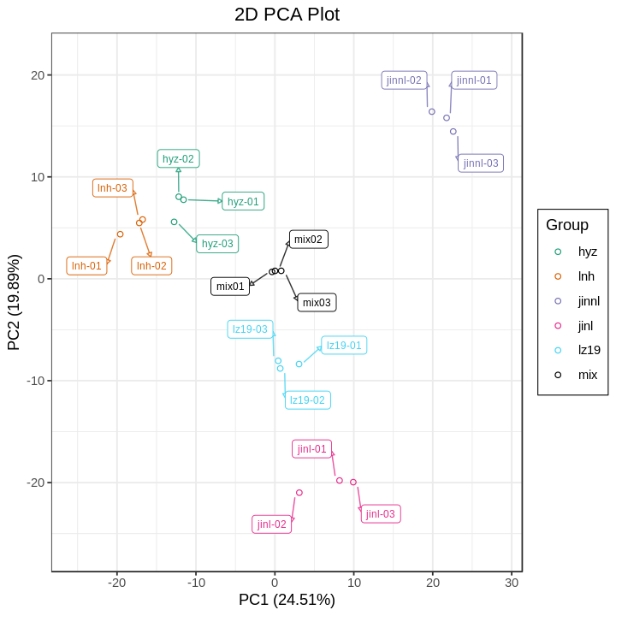
Figure 1. PCA scores plot
Note: The x-axis represents the first principal component (PC1), and the y-axis represents the second principal component (PC2). The numbers in parentheses indicate the percentage of total variance explained by each principal component. Each dot in the PCA plot represents one sample. Different groups are marked with different colors. The ellipse denotes the 95% confidence interval.
Figure 2. Cluster analysis
3.2. OPLS-DA and permutation test analysis
Orthogonal Partial Least Squares Discriminant Analysis (OPLS-DA) is a multivariate statistical method for discriminant analysis [18]. This method builds a predictive model between metabolite expression and sample class to effectively distinguish metabolic characteristics among treatment groups. The analysis procedure mainly includes: (1) constructing a training set using samples with known categories; (2) building a predictive model through partial least squares regression; (3) evaluating the classification performance of the model. As shown in Figure 3, the OPLS-DA analysis results indicate the following: Sample distribution features: Samples from each group are distinctly separated in the score plots, with tight clustering within groups and good reproducibility, suggesting strong discriminative power of the model. Component contributions: hyz vs jinl: PC1 = 55.5%, PC2 = 9.7%; hyz vs jinnl: PC1 = 59.4%, PC2 = 11.8%; hyz vs lnh: PC1 = 52.3%, PC2 = 13.8%; hyz vs lz19: PC1 = 57.1%, PC2 = 16.4%; jinl vs lz19: PC1 = 52.1%, PC2 = 10.7%; jinnl vs jinl: PC1 = 55.6%, PC2 = 17.2%; jinnl vs lz19: PC1 = 60.1%, PC2 = 9.23%; lnh vs jinl: PC1 = 58.2%, PC2 = 17.7%; lnh vs jinnl: PC1 = 60.0%, PC2 = 15.9%; lnh vs lz19: PC1 = 57.3%, PC2 = 9.82%. These results demonstrate significant metabolic differences among the experimental groups, and that the OPLS-DA model can effectively discriminate between them.
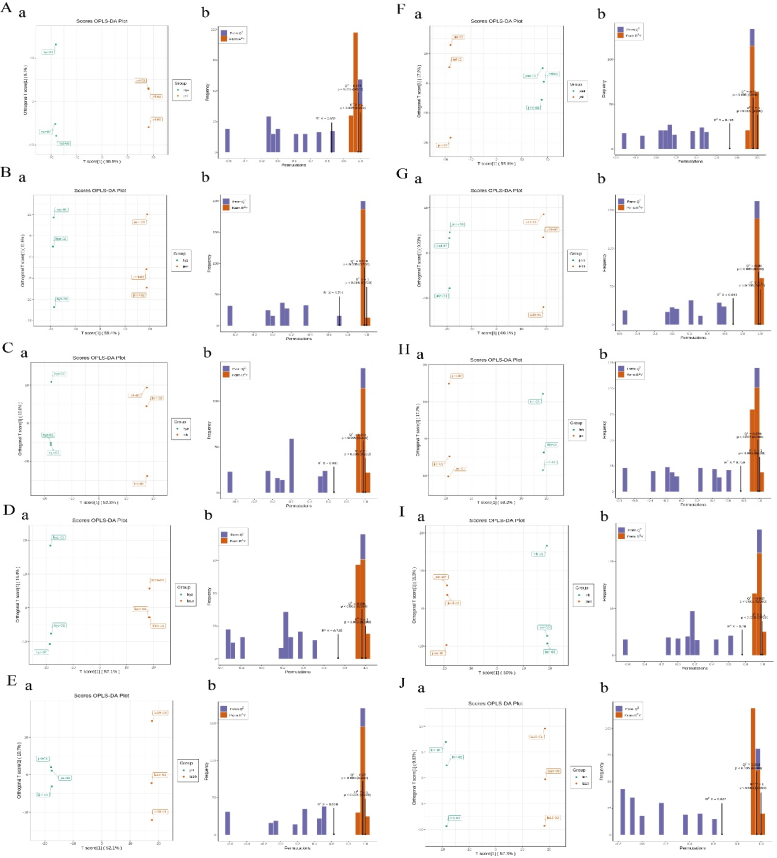
Figure 3. OPLS-DA scores and model validation
Note: (A) hyz vs jinl; (B) hyz vs jinnl; (C) hyz vs lnh; (D) hyz vs lz19; (E) jinl vs lz19; (F) jinnl vs jinl; (G) jinnl vs lz19; (H) lnh vs jinl; (I) lnh vs jinnl; (J) lnh vs lz19. Each dot represents a sample. Different colors represent different sample groups. The ellipse represents the 95% confidence interval.
Model validation results (Fig. 3) show that for all comparison groups: hyz vs jinl: R²X = 0.652, R²Y = 1, Q² = 0.973; hyz vs jinnl: R²X = 0.711, R²Y = 1, Q² = 0.976; hyz vs lnh: R²X = 0.661, R²Y = 1, Q² = 0.975; hyz vs lz19: R²X = 0.735, R²Y = 1, Q² = 0.965; jinl vs lz19: R²X = 0.628, R²Y = 1, Q² = 0.970; jinnl vs jinl: R²X = 0.728, R²Y = 1, Q² = 0.960; jinnl vs lz19: R²X = 0.693, R²Y = 1, Q² = 0.980; lnh vs jinl: R²X = 0.759, R²Y = 1, Q² = 0.979; lnh vs jinnl: R²X = 0.760, R²Y = 1, Q² = 0.982; lnh vs lz19: R²X = 0.672, R²Y = 1, Q² = 0.963. All models had R² values exceeding the 0.5 threshold, and Q² values greater than 0.9, confirming excellent predictive performance and reliability. To assess model stability, 200 permutation tests were performed. Statistical analysis indicated that the original R² and Q² values were significantly higher than those from the randomized permutations (p < 0.05), thus ruling out the possibility of model overfitting. Based on the validated models, variable importance in projection (VIP) scores were employed to identify statistically significant differential metabolites.
3.3. Screening of differential metabolites among different treatment groups
Based on the Variable Importance in Projection (VIP) values obtained from the OPLS-DA model and fold change analysis (Log2FC), differential metabolites were identified with the thresholds set at VIP ≥ 1 and |Log2FC| ≥ 1. Multiple groups of statistically significant differential metabolites were identified (Fig. 4, Tables 2–3). The metabolic changes in each comparison group were as follows: In the hyz vs jinl comparison, 175 differential metabolites were detected, mainly comprising 9 amino acid derivatives, 11 nucleotide compounds, and 78 flavonoids. Among them, 77 metabolites (44.0%) were upregulated and 98 metabolites (56.0%) were downregulated (Fig. 4A). In the hyz vs jinnl comparison, 179 differential metabolites were identified, with lipids (27 species) and phenolic acids (54 species) being the major categories. Upregulated metabolites accounted for 54.8%, and downregulated ones for 45.2% (Fig. 4B). In the hyz vs lnh comparison, 152 differential metabolites were detected, primarily flavonoids (59 species) and phenolic acids (30 species). Upregulated metabolites accounted for 35.5%, and downregulated metabolites for 64.5% (Fig. 4C). In the hyz vs lz19 comparison, 175 differential metabolites were identified, mainly flavonoids (63 species) and phenolic acids (30 species). Upregulated metabolites accounted for 33.71%, while downregulated metabolites accounted for 66.29% (Fig. 4D). In the jinl vs lz19 comparison, 123 differential metabolites were detected, dominated by flavonoids (59 species) and phenolic acids (20 species). Upregulated metabolites accounted for 44.72%, and downregulated metabolites for 55.28% (Fig. 4E). In the jinnl vs jinl comparison, 187 differential metabolites were detected, mainly flavonoids (66 species) and phenolic acids (43 species). Upregulated metabolites accounted for 32.62%, and downregulated metabolites for 67.38% (Fig. 4F). In the jinnl vs lz19 comparison, 153 differential metabolites were identified, dominated by flavonoids (58 species) and phenolic acids (29 species). Upregulated metabolites accounted for 28.10%, and downregulated metabolites for 71.90% (Fig. 4G). In the lnh vs jinl comparison, 194 differential metabolites were identified, with flavonoids (67 species) and phenolic acids (37 species) being the major categories. Upregulated metabolites accounted for 55.15%, and downregulated metabolites for 44.85% (Fig. 4H). In the lnh vs jinnl comparison, 220 differential metabolites were detected, mainly flavonoids (73 species) and phenolic acids (37 species). Upregulated metabolites accounted for 67.27%, while downregulated metabolites accounted for 32.73% (Fig. 4I). In the lnh vs lz19 comparison, 170 differential metabolites were identified, primarily flavonoids (54 species) and phenolic acids (25 species). Upregulated metabolites accounted for 51.18%, and downregulated metabolites for 48.82% (Fig. 4J).
Figure 4. Volcano plots of differential metabolites
Note: (A) hyz vs jinl comparison; (B) hyz vs jinnl comparison; (C) hyz vs lnh comparison; (D) hyz vs lz19 comparison; (E) jinl vs lz19 comparison; (F) jinnl vs jinl comparison; (G) jinnl vs lz19 comparison; (H) lnh vs jinl comparison; (I) lnh vs jinnl comparison; (J) lnh vs lz19 comparison.
Table 2. Statistical analysis of differential metabolite quantities between different treatment groups (hyz vs jinl; hyz vs jinnl; hyz vs lnh; hyz vs lz19; jinl vs lz19)
Metabolite Classification | Number of Differentially Significant Metabolites | ||||
hyz vs jinl | hyz vs jinnl | hyz vs lnh | hyz vs lz19 | jinl vs lz19 | |
Amino acids and derivatives | 9 | 14 | 8 | 10 | 1 |
Nucleotides and derivatives | 11 | 4 | 5 | 12 | 2 |
Organic acids | 6 | 6 | 5 | 3 | 3 |
Lipids | 9 | 27 | 26 | 20 | 14 |
Phenolic acids | 29 | 54 | 30 | 30 | 20 |
Flavonoids | 78 | 40 | 59 | 63 | 59 |
Alkaloids | 7 | 16 | 11 | 14 | 14 |
Others | 26 | 18 | 8 | 23 | 10 |
Total | 175 | 179 | 152 | 175 | 123 |
Table 3. Statistical analysis of differential metabolite quantities between different treatment groups (jinnl vs jinl; jinnl vs lz19; lnh vs jinl; lnh vs jinnl; lnh vs lz19)
Metabolite Classification | Number of Differentially Significant Metabolites | |||||
jinnl vs jinl | jinnl vs lz19 | lnh vs jinl | lnh vs jinnl | lnh vs lz19 | ||
Amino acids and derivatives | 10 | 5 | 11 | 28 | 18 | |
Nucleotides and derivatives | 13 | 7 | 4 | 7 | 3 | |
Organic acids | 7 | 4 | 16 | 18 | 10 | |
Lipids | 15 | 19 | 17 | 13 | 20 | |
Phenolic acids | 43 | 29 | 37 | 37 | 25 | |
Flavonoids | 66 | 58 | 67 | 73 | 54 | |
Alkaloids | 8 | 16 | 16 | 22 | 16 | |
Others | 25 | 15 | 26 | 22 | 24 | |
Total | 187 | 153 | 194 | 220 | 170 | |
3.4. Differential metabolomic analysis between treatment groups
3.4.1. Overall metabolite analysis
Some metabolites exhibited similar expression patterns across different groups. Based on the expression levels of metabolites, clustering analysis was performed to group metabolites with consistent expression trends into the same cluster. A total of 12 distinct clusters were generated (Figure. 5).
Figure 5. Trend analysis diagram
Note: The X-axis represents different time points, while the Y-axis indicates normalized expression levels.
3.4.2. Heatmap analysis of differential metabolites among treatment groups
Prior to analysis, the data were subjected to log₂ transformation and z-score normalization (zero-mean normalization). Significant differential metabolites were further analyzed via heatmap, as shown in Fig. 6. In the heatmap, red areas represent regions of high metabolite expression, while green areas indicate low expression. In the hyz vs jinl group, 77 differential metabolites showed significantly lower expression in the hyz group compared to the jinl group, primarily amino acid derivatives and alkaloids. Conversely, 98 metabolites were significantly upregulated in the hyz group, mainly nucleotides and lipids. In the hyz vs jinnl group, 98 metabolites were downregulated in the hyz group (mainly amino acid derivatives), while 81 were upregulated (mainly lipids). In the hyz vs lnh group, 54 metabolites were downregulated in the hyz group (mainly organic acids and phenolic acids), while 98 were upregulated (mainly nucleotides and lipids). In the hyz vs lz19 group, 59 metabolites were downregulated in the hyz group (mainly amino acid derivatives), while 116 were upregulated (mainly nucleotides and lipids). In the jinl vs lz19 group, 55 metabolites were downregulated in the jinl group (mostly phenolic acids), while 68 were upregulated (mostly flavonoids). In the jinnl vs jinl group, 61 metabolites were downregulated in the jinnl group (mostly lipids), while 126 were upregulated (mostly nucleotides and amino acid derivatives). In the jinnl vs lz19 group, 43 metabolites were downregulated in the jinnl group (mostly lipids), while 110 were upregulated (mostly nucleotides and flavonoids). In the lnh vs jinl group, 107 metabolites were downregulated in the lnh group (mostly amino acid derivatives and organic acids), while 87 were upregulated (mostly phenolic acids). In the lnh vs jinnl group, 148 metabolites were downregulated in the lnh group (mostly amino acid derivatives, nucleotides, and organic acids), while 72 were upregulated (mostly lipids and alkaloids). In the lnh vs lz19 group, 87 metabolites were downregulated in the lnh group (mostly amino acid derivatives), while 83 were upregulated (mostly phenolic acids).
Figure 6. Heatmap
Note: Panels (A–J) represent heatmaps of metabolite expression for the following comparisons, respectively: hyz vs jinl; hyz vs jinnl; hyz vs lnh; hyz vs lz19; jinl vs lz19; jinnl vs jinl; jinnl vs lz19; lnh vs jinl; lnh vs jinnl; lnh vs lz19. Each row represents a differential metabolite, and each column represents a sample. Colors from green to red indicate expression levels from low to high.
3.4.3. Analysis of differential metabolites among different treatment groups
As shown in Table 4-13, significant differential metabolites among the various groups are listed. In the hyz vs jinl comparison group, L-citrulline, γ-aminobutyric acid, and L-proline were significantly upregulated in the jinl group, with fold changes ranging from 2.266 to 2.812 compared to the hyz group. Conversely, N-acetyl-L-glutamic acid, 2'-deoxycytidine, and 2'-deoxyguanosine were markedly downregulated in jinl, accounting for only 6.6% to 28.9% of the levels in the hyz group. In the hyz vs jinnl comparison group, L-aspartic acid, 3-hydroxy-3-methylglutaric acid, and 5'-deoxy-5'-methylthioadenosine were significantly upregulated in jinnl, with fold increases ranging from 2.911 to 19.311. On the other hand, sedoheptulose-7-phosphate, raffinose, and lysophosphatidylcholine (20:0) were significantly downregulated in jinnl, accounting for only 24.5% to 32.6% of the levels in hyz. In the hyz vs lnh comparison group, phosphoenolpyruvate, trans-aconitic acid, and D-glucono-1,5-lactone were significantly upregulated in lnh, with fold changes ranging from 2.124 to 3.580. Meanwhile, guanine, monoacylglycerol (18:4), and N-monomethyl-L-arginine were significantly downregulated, representing only 20.4% to 30.6% of hyz group levels. In the hyz vs lz19 comparison, significant upregulation was observed in D-glucuronic acid, L-citrulline, and L-aspartic acid in the lz19 group, with fold increases ranging from 2.228 to 3.720. Metabolites such as 7-methylguanine, O-phosphocholine, and guanosine 3',5'-cyclic monophosphate were significantly downregulated, comprising only 3.4% to 34.9% of the hyz group levels. In the jinl vs lz19 comparison, lysophosphatidylethanolamine (15:1), lysophosphatidylcholine (15:1), and lysophosphatidylcholine (19:2) were significantly upregulated in lz19, with fold increases ranging from 2.111 to 2.841. Meanwhile, heptadecanoic acid, sorbitol-6-phosphate, and 2R-hydroxyoctadecanoic acid were significantly downregulated, accounting for 24.7% to 42.1% of jinl levels. In the jinnl vs jinl group comparison, S-methylglutathione, sedoheptulose-7-phosphate, and maltotetraose were significantly upregulated in jinl, with fold changes ranging from 2.744 to 6.615. Meanwhile, 2-methoxyadenosine, 5'-deoxy-5'-methylthioadenosine, and p-hydroxybenzoic acid were significantly downregulated, representing only 12.3% to 30.2% of jinnl levels. In the jinnl vs lz19 comparison, D-trehalose, D-maltotriose, and sedoheptulose-7-phosphate were significantly upregulated in lz19, with fold increases of 2.42 to 4.982. In contrast, D-ribose, p-hydroxybenzoic acid, and 4-O-glucosyl-4-hydroxybenzoic acid were significantly downregulated, accounting for only 8.11% to 34.1% of jinnl group levels. In the lnh vs jinl group comparison, L-methionine, xylitol, and D-arabitol were significantly upregulated in jinl, with fold changes ranging from 2.837 to 3.607. In contrast, trans-aconitic acid, N-acetyl-L-glutamine, and lysophosphatidylethanolamine (18:0) were significantly downregulated, comprising only 25.5% to 36.8% of lnh group levels. In the lnh vs jinnl comparison group, L-arginine, N-acetyl-L-aspartic acid, and 5'-deoxy-5'-methylthioadenosine were significantly upregulated in jinnl, with fold increases ranging from 3.841 to 9.370. On the other hand, raffinose, trans-aconitic acid, and L-lysine butyrate ester were significantly downregulated, accounting for only 19.5% to 32.4% of lnh levels. In the lnh vs lz19 comparison group, L-aspartic acid, L-citrulline, and lysophosphatidylcholine (17:2) were significantly upregulated in lz19, with fold changes ranging from 3.045 to 6.001. Meanwhile, glucose-1-phosphate, O-phosphocholine, and D-glucose-6-phosphate were significantly downregulated, representing only 34.5% to 41.0% of lnh levels.
Table 4. Differential metabolites between hyz and jinl
No. | Differential Metabolite | VIP | FC | Log2FC | Regulation |
1 | N-Acetyl-L-glutamic acid | 1.339 | 0.0231 | -5.437 | Down |
2 | LysoPC 19:2 | 1.331 | 0.066 | -3.922 | Down |
3 | LysoPC 19:2 (2n isomer) | 1.328 | 0.076 | -3.711 | Down |
4 | 2'-Deoxycytidine | 1.272 | 0.289 | -1.792 | Down |
5 | 2'-Deoxyguanosine | 1.293 | 0.289 | -1.791 | Down |
6 | L-Citrulline | 1.308 | 2.812 | 1.492 | Up |
7 | 3-Hydroxy-3-methylglutaric acid | 1.239 | 2.618 | 1.388 | Up |
8 | γ-Aminobutyric acid (GABA) | 1.335 | 2.499 | 1.321 | Up |
9 | L-Proline | 1.337 | 2.266 | 1.180 | Up |
10 | D-Arabitol | 1.321 | 2.326 | 1.218 | Up |
Table 5. Differential metabolites between hyz and jinnl
No. | Differential Metabolite | VIP | FC | Log2FC | Regulation |
1 | 9-Hydroxy-13-oxo-10-octadecenoic acid | 1.283 | 0.245 | -2.027 | Down |
2 | LysoPC 20:0 | 1.282 | 0.256 | -1.966 | Down |
3 | D-Maltotetraose | 1.270 | 0.284 | -1.814 | Down |
4 | Raffinose | 1.243 | 0.307 | -1.702 | Down |
5 | D-Sedoheptulose 7-phosphate | 1.274 | 0.326 | -1.617 | Down |
6 | 5'-Deoxy-5'-methylthioadenosine | 1.275 | 19.311 | 4.271 | Up |
7 | S-(5'-Adenosyl)-L-homocysteine | 1.263 | 6.406 | 2.679 | Up |
8 | N-Acetyl-L-aspartic acid | 1.278 | 3.796 | 1.925 | Up |
9 | 3-Hydroxy-3-methylglutaric acid | 1.273 | 3.401 | 1.765 | Up |
10 | L-Aspartic acid | 1.292 | 2.911 | 1.542 | Up |
Table 6. Differential metabolites between hyz and lnh
No. | Differential Metabolite | VIP | FC | Log2FC | Regulation |
1 | Pyridoxine-5'-O-β-D-diglucoside | 1.286 | 0.204 | -2.291 | Down |
2 | Monoglyceride (18:4) | 1.302 | 0.274 | -1.869 | Down |
3 | N-Monomethyl-L-arginine | 1.377 | 0.293 | -1.771 | Down |
4 | Guanine | 1.357 | 0.300 | -1.737 | Down |
5 | LysoPC 19:0 | 1.352 | 0.306 | -1.708 | Down |
6 | L-Lysine butyrate ester | 1.368 | 3.580 | 1.840 | Up |
7 | D-Glucurono-1,5-lactone | 1.275 | 3.200 | 1.678 | Up |
8 | N-Acetyl-L-glutamine | 1.365 | 3.075 | 1.621 | Up |
9 | trans-Aconitic acid | 1.325 | 2.326 | 1.218 | Up |
10 | Phosphoenolpyruvate | 1.075 | 2.124 | 1.087 | Up |
Table 7. Differential metabolites between hyz and lz19
No. | Differential Metabolite | VIP | FC | Log2FC | Regulation |
1 | N-Acetyl-L-glutamic acid | 1.319 | 0.034 | -4.872 | Down |
2 | 9-Hydroxy-13-oxo-10-octadecenoic acid | 1.304 | 0.209 | -2.260 | Down |
3 | Guanosine 3',5'-cyclic monophosphate | 1.272 | 0.237 | -2.074 | Down |
4 | O-Phosphocholine | 1.300 | 0.297 | -1.750 | Down |
5 | 7-Methylguanine | 1.250 | 0.349 | -1.521 | Down |
6 | L-Aspartic acid | 1.308 | 3.720 | 1.895 | Up |
7 | L-Citrulline | 1.297 | 3.541 | 1.824 | Up |
8 | LysoPC 20:3 | 1.295 | 2.522 | 1.335 | Up |
9 | D-Glucurono-1,5-lactone | 1.094 | 2.325 | 1.218 | Up |
10 | D-Glucuronic acid | 1.282 | 2.228 | 1.156 | Up |
Table 8. Differential metabolites between jinl and lz19
No. | Differential Metabolite | VIP | FC | Log2FC | Regulation |
1 | 2R-Hydroxyoctadecanoic acid | 1.001 | 0.247 | -2.020 | Down |
2 | 13-Hydroxy-9Z,11E-octadecadienoic acid | 1.325 | 0.315 | -1.666 | Down |
3 | Heptadecanoic acid | 1.005 | 0.371 | -1.430 | Down |
4 | Sorbitol-6-phosphate | 1.324 | 0.382 | -1.387 | Down |
5 | 15(R)-Hydroxy-linoleic acid | 1.373 | 0.421 | -1.249 | Down |
6 | LysoPC 19:2 | 1.330 | 2.841 | 1.506 | Up |
7 | LysoPC 19:2 (2n isomer) | 1.270 | 2.520 | 1.333 | Up |
8 | LysoPC 15:1 | 1.381 | 2.336 | 1.224 | Up |
9 | LysoPE 15:1 | 1.370 | 2.111 | 1.078 | Up |
10 | 1-O-Gentisoyl-D-glucose | 1.331 | 2.322 | 1.215 | Up |
Table 9. Differential metabolites between jinnl and jinl
No. | Differential Metabolite | VIP | FC | Log2FC | Regulation |
1 | 5'-Deoxy-5'-methylthioadenosine | 1.281 | 0.123 | -3.022 | Down |
2 | 4-O-Glucosyl-4-hydroxybenzoic acid | 1.280 | 0.207 | -2.275 | Down |
3 | N-Hydroxyserotonin | 1.244 | 0.209 | -2.256 | Down |
4 | p-Hydroxybenzoic acid | 1.315 | 0.291 | -1.783 | Down |
5 | 2-Methoxyadenosine | 1.306 | 0.302 | -1.725 | Down |
6 | D-Sedoheptulose 7-phosphate | 1.326 | 6.615 | 2.726 | Up |
7 | D-Maltotetraose | 1.244 | 3.260 | 1.705 | Up |
8 | LysoPC 20:0 | 1.309 | 3.245 | 1.698 | Up |
9 | Adonitol | 1.329 | 3.200 | 1.678 | Up |
10 | S-Methylglutathione | 1.218 | 2.744 | 1.456 | Up |
Table 10. Differential metabolites between jinnl and lz19
No. | Differential Metabolite | VIP | FC | Log2FC | Regulation |
1 | 5'-Deoxy-5'-methylthioadenosine | 1.245 | 0.0811 | -3.624 | Down |
2 | p-Hydroxybenzoic acid | 1.282 | 0.213 | -2.229 | Down |
3 | 4-O-β-D-Glucosyl-p-hydroxybenzoic acid | 1.284 | 0.247 | -2.020 | Down |
4 | 9,10,13-Trihydroxy-11-octadecenoic acid | 1.286 | 0.261 | -1.937 | Down |
5 | D-Ribose | 1.274 | 0.341 | -1.552 | Down |
6 | D-Sedoheptulose 7-phosphate | 1.276 | 4.982 | 2.317 | Up |
7 | D-Melezitose | 1.223 | 3.538 | 1.823 | Up |
8 | D-Maltotetraose | 1.246 | 3.305 | 1.724 | Up |
9 | LysoPC 17:2 | 1.224 | 2.907 | 1.539 | Up |
10 | D-Trehalose | 1.229 | 2.420 | 1.275 | Up |
Table 11. Differential metabolites between lnh and jinl
No. | Differential Metabolite | VIP | FC | Log2FC | Regulation |
1 | Guanosine 3',5'-cyclic monophosphate (cGMP) | 1.187 | 0.255 | -1.969 | Down |
2 | N-Acetyl-L-glutamine | 1.301 | 0.298 | -1.747 | Down |
3 | Ferulic acid 4-O-glucoside | 1.244 | 0.301 | -1.732 | Down |
4 | trans-Aconitic acid | 1.291 | 0.343 | -1.541 | Down |
5 | LysoPE 18:0 | 1.304 | 0.368 | -1.440 | Down |
6 | 3-Hydroxy-3-methylglutaric acid | 1.249 | 3.607 | 1.851 | Up |
7 | L-Citrulline | 1.266 | 3.239 | 1.695 | Up |
8 | D-Arabitol | 1.292 | 2.901 | 1.537 | Up |
9 | Xylitol | 1.293 | 2.878 | 1.525 | Up |
10 | L-Methionine | 1.243 | 2.837 | 1.504 | Up |
Table 12. Differential metabolites between lnh and jinnl
No. | Differential Metabolite | VIP | FC | Log2FC | Regulation |
1 | Raffinose | 1.263 | 0.195 | -2.359 | Down |
2 | Stachyose | 1.264 | 0.219 | -2.191 | Down |
3 | trans-Aconitic acid | 1.269 | 0.252 | -1.990 | Down |
4 | L-Lysine butyrate | 1.202 | 0.283 | -1.820 | Down |
5 | D-Melezitose | 1.224 | 0.324 | -1.627 | Down |
6 | 5'-Deoxy-5'-methylthioadenosine | 1.223 | 9.370 | 3.228 | Up |
7 | S-(5'-Adenosyl)-L-homocysteine | 1.283 | 8.499 | 3.087 | Up |
8 | 2,6-Diaminopimelic acid | 1.2768 | 6.638 | 2.731 | Up |
9 | N-Acetyl-L-aspartic acid | 1.252 | 5.180 | 2.373 | Up |
10 | L-Arginine | 1.285 | 3.841 | 1.941 | Up |
Table 13. Differential metabolites between lnh and lz19
No. | Differential Metabolite | VIP | FC | Log2FC | Regulation |
1 | Glucose-1-phosphate | 1.271 | 0.345 | -1.536 | Down |
2 | trans-Aconitic acid | 1.292 | 0.357 | -1.487 | Down |
3 | O-Phosphocholine | 1.304 | 0.358 | -1.483 | Down |
4 | D-Glucose-6-phosphate | 1.195 | 0.371 | -1.429 | Down |
5 | Guanosine 3',5'-cyclic monophosphate (cGMP) | 1.225 | 0.410 | -1.286 | Down |
6 | Pyridoxine 5'-O-glucoside | 1.311 | 6.001 | 2.585 | Up |
7 | L-Citrulline | 1.285 | 4.078 | 2.028 | Up |
8 | LysoPC 16:1 | 1.3135 | 3.943 | 1.979 | Up |
9 | LysoPC 17:2 | 1.282 | 3.433 | 1.780 | Up |
10 | L-Aspartic acid | 1.298 | 3.045 | 1.606 | Up |
3.4.4. Enrichment pathway analysis of differential metabolites in different treatment groups
The growth and development of organisms are regulated by complex metabolic networks, involving multi-level cascade reactions. Metabolic pathway enrichment analysis allows for a systematic evaluation of the impact of experimental treatments on the overall metabolic regulatory network. The results of metabolic pathway enrichment analysis based on the KEGG database are shown in Figure 7. The distribution characteristics of the differential metabolites in the metabolic pathways for each comparison group are as follows: Comparison between hyz and jinl groups (Figure 7A): Total number of involved metabolic pathways: 57. Significant pathways: Flavonoid biosynthesis, Flavonoid/Flavonol biosynthesis, Isoflavonoid biosynthesis; Metabolic characteristics: The jinl group may enhance antioxidant capacity by activating flavonoid synthesis pathways, while the hyz group demonstrates a regulatory advantage in basal metabolism. Comparison between hyz and jinnl groups (Figure 7B): Total number of involved metabolic pathways: 58; Significant pathways: Flavonoid biosynthesis, Lysine biosynthesis, Pentose phosphate pathway; Metabolic characteristics: The jinnl group may maintain the active state of secondary metabolism by enhancing the pentose phosphate pathway (NADPH supply) and lysine biosynthesis. Comparison between hyz and lnh groups (Figure 7C): Total number of involved metabolic pathways: 42; Significant pathways: Linoleic acid metabolism, Flavonoid biosynthesis, Flavonoid/Flavonol biosynthesis, Plant hormone signal transduction; Metabolic characteristics: The lnh group may coordinate stress adaptation through hormone signaling (e.g., ABA) and lipid metabolism, while maintaining the activity of the flavonoid antioxidant system. Comparison between hyz and lz19 groups (Figure 7D): Total number of involved metabolic pathways: 62; Significant pathway: Flavonoid biosynthesis; Metabolic characteristics: The lz19 group shows specific activation of the flavonoid pathway, which may be related to its unique environmental adaptation strategy. Comparison between jinl and lz19 groups (Figure 7E): Total number of involved metabolic pathways: 33; Significant pathways: Flavonoid biosynthesis, Isoflavonoid biosynthesis. Comparison between jinnl and jinl groups (Figure 7F): Total number of involved metabolic pathways: 53; Significant pathways: Isoflavonoid biosynthesis, Flavonoid/Flavonol biosynthesis, Flavonoid biosynthesis; Metabolic characteristics: The jinnl group has a significantly higher content of flavonols (such as myricetin) compared to the jinl group (FC=2.8), indicating differentiated characteristics in the antioxidant metabolic network between the two groups. Comparison between jinnl and lz19 groups (Figure 7G): Total number of involved metabolic pathways: 42; Significant pathway: Flavonoid biosynthesis. Comparison between lnh and jinl groups (Figure 7H): Total number of involved metabolic pathways: 55; Significant pathways: Flavonoid biosynthesis, Isoflavonoid biosynthesis; Metabolic characteristics: The lnh group generally has a higher content of isoflavonoids (such as genistein), which may be related to root-microbe interactions. Comparison between lnh and jinnl groups (Figure 7I): Total number of involved metabolic pathways: 74; Significant pathways (8 pathways): Arginine biosynthesis, Flavonoid biosynthesis, Lysine biosynthesis, Aminoacyl-tRNA biosynthesis, Amino acid biosynthesis, Amide biosynthesis, Stilbenoid biosynthesis, Phenylalanine, Aspartate, and Glutamate metabolism; Metabolic characteristics: The lnh group exhibits comprehensive reprogramming of amino acid metabolism, which may respond to environmental changes through NO and phenolic compounds. Comparison between lnh and lz19 groups (Figure 7J): Total number of involved metabolic pathways: 64; Significant pathways: Flavonoid biosynthesis, Stilbenoid biosynthesis, Phenylpropanoid biosynthesis, Arginine biosynthesis; Metabolic characteristics: The co-regulation of phenylpropanoid pathways and stilbenoid biosynthesis may form the core of the lnh group’s defensive metabolic network. The active state of the arginine/lysine pathways reflects its unique nitrogen utilization strategy.
Figure 7. Differential metabolite enrichment pathway - bubble diagram
Note: All comparison groups showed significant enrichment of the flavonoid biosynthesis pathway, but there were variety-specific differences in the preference for its downstream branches (flavonols/iso-flavonoids), which may represent the metabolic basis for the adaptive differentiation of different varieties. (A) Comparison between hyz and jinl groups; (B) Comparison between hyz and jinnl groups; (C) Comparison between hyz and lnh groups; (D) Comparison between hyz and lz19 groups; (E) Comparison between jinl and lz19 groups; (F) Comparison between jinnl and jinl groups; (G) Comparison between jinnl and lz19 groups; (H) Comparison between lnh and jinl groups; (I) Comparison between lnh and jinnl groups; (J) Comparison between lnh and lz19 groups. The X-axis represents the enrichment factor (RichFactor), which is calculated as the number of differential metabolites annotated to the pathway divided by the total number of metabolites in the pathway. The larger this value, the greater the proportion of differential metabolites annotated to the pathway. The size of the circles represents the number of differential metabolites annotated to the pathway.
4. Conclusion
This study utilized the ultra-high-performance liquid chromatography-tandem mass spectrometry (UPLC-MS/MS) platform to comprehensively analyze the primary metabolites of several sorghum cultivars. Experimental data indicated that, based on metabolite identification, a total of 503 metabolites were detected in the samples from five different sorghum cultivars. Through inter-group comparison analysis, each cultivar combination (including hyz-jinl, hyz-jinnl, etc.) showed 175 to 220 significant differential metabolites. The specific distribution of these metabolites is as follows: 175, 179, 152, 175, 123, 187, 153, 194, 220, and 170 metabolites. These results clearly confirm the significant metabolomic differences between sorghum materials of different genotypes. The study found that the sorghum varieties not only exhibited distinct differences in the types of metabolites but also showed significant variations in the relative content of key metabolites. These cultivar-specific differential metabolites could serve as potential molecular markers to differentiate between different sorghum genotypes. Metabolic pathway enrichment analysis based on the KEGG database revealed that the biosynthesis pathway of flavonoid compounds was the most significantly altered pathway. Notably, flavonoid metabolites showed the most prominent content differences across the cultivars, suggesting that this metabolic pathway could be a key regulatory node in the formation of cultivar-specific metabolic traits. This discovery provides an important theoretical foundation for a deeper understanding of the metabolic basis of sorghum quality traits and offers valuable guidance for sorghum cultivar improvement. Flavonoid compounds have significant biological and medical effects, particularly their powerful antioxidant properties [19]. These compounds not only inhibit bacterial growth [20], resist tumors [21], and alleviate allergic reactions [22] but also combat viral infections. Furthermore, they can effectively regulate blood lipid levels, control elevated blood pressure, and provide good protection for the heart and vascular system. Therefore, flavonoid compounds have significant application value in various fields, especially in the development and manufacturing of functional foods, skincare products, and nutritional supplements [23].
References
[1]. Mohamed, A. A., Zhang, C., & Li, Q. (2016). Comparison of physicochemical characteristics of starch isolated from sweet and grain sorghum. Journal of Chemistry, 2016, 1–15.
[2]. Gao, X., Feng, Z., Ding, Y. (2023). Genetic diversity of agronomic traits in 257 sorghum germplasm resources. Southwest China Journal of Agricultural Sciences, 36(1), 1–10.
[3]. Li, S., Liu, M., Liu, F. (2021). Current situation and future prospects of sorghum industry and seed industry development in China. Scientia Agricultura Sinica, 54(3), 471–482.
[4]. Li, Z., Li, Z., Zhou, W. (2021). Evaluation and comprehensive analysis of major agronomic traits of sorghum lines. Molecular Plant Breeding, 19(19), 6503–6511.
[5]. Baolige. (2020). Identification of salt tolerance in sorghum germplasm resources and full-length transcriptome analysis under salt stress [Master’s thesis, Jilin University].
[6]. Sow, S. H. K. P., Wang, X., Borrell, R. S. (2021). Near infrared spectroscopic evaluation of starch properties of diverse sorghum populations. Processes, 9(11), 1942.
[7]. Casimir, A. L. S., Roger, B., Freddy, A. Y. (2025). Agronomic performance of local and improved Sorghum bicolor L. Moench varieties in the Sudanian area, north of Côte d'Ivoire. International Journal of Plant & Soil Science, 37(3), 20–32.
[8]. Wu, S., & Li, S. (2024). Collaboration to address the challenges faced by smallholders in practicing organic agriculture: A case study of the organic sorghum industry in Zunyi City, China. Agriculture, 14(5), 726.
[9]. Dong, Y., & Malitsky, S. (2024). MetaboReport: From metabolomics data analysis to comprehensive reporting. Bioinformatics, Advance online publication.
[10]. Gu, W., Feng, Y., Liu, C. (2025). Transcriptomic and metabolomic unraveling of nitrogen use efficiency in sorghum: The quest for molecular adaptations to low-nitrogen stress. Plant Growth Regulation, Advance online publication.
[11]. Jiang, L., Mao, L., Lin, J. (2024). Pharmacokinetic study of granisetron in human plasma measured by UPLC-MS/MS and its use in healthy Chinese subjects. Pakistan Journal of Pharmaceutical Sciences, 37(3), 475–489.
[12]. Sun, J., LaMei, X., Ansi, A. W. (2025). Metabolic profiling and amino acid evolution in fermented oats: Insights from UPLC-MS/MS and PLS-DA analysis. Food Bioscience, 66, 106172.
[13]. Shao, M., Wang, R., Wen, C. (2025). Quantification of pectolinarin in rat plasma using UPLC-MS/MS and its pharmacokinetic analysis. Biomedical Chromatography, 39(4), e70032.
[14]. Arimboor, R., Chandrasekharan, P. L., Thaliakuzhy, Z. (2025). UPLC-MS/MS profiling of photodegradation of aflatoxin B1 in chili peppers. Journal of Food Science and Technology, Advance online publication.
[15]. González, P. D. A., Vázquez, M. V. A., Perez, O. E. (2024). Determination of antibiotic residues in pork meat from Northeast Mexico by UPLC-MS. CyTA - Journal of Food, 22(1), Article in press.
[16]. Shuo, Y., Yan, S., Zhuonan, C. (2022). Detection of mescaline in human hair samples by UPLC-MS/MS: Application to 19 authentic forensic cases. Journal of Chromatography B, 1195, 123202.
[17]. Chen, Y., Song, B., Huang, M. (2025). Multiresidue analysis of pesticides and dietary risk assessment of Coix seed by UPLC-MS/MS. Journal of Food Composition and Analysis, 140, 107192.
[18]. Xinrui W, Huaqiang L, Jinling Y. (2024). Rapid Characterization of Male and Female Taxus chinensis by Near-Infrared (NIR) Spectroscopy and High-Performance Liquid Chromatography (HPLC) with Orthogonal Partial Least Squares—Discriminant Analysis (OPLS-DA). Analytical Letters, 57(7), 1106–1122.
[19]. Wei, J., Zhang, Z., Li, D. (2015). Study on ionic liquid-assisted extraction of four flavonoid components from Sorghum bicolor. China Journal of Chinese Materia Medica, 40(7), 1305–1310.
[20]. Shen, J., Zhao, Q., Zhang, K. (2024). Insights into inhibitory mechanisms: Unraveling the structure-activity relationship of dietary flavonoids on gut bacterial β-glucuronidase. Journal of Functional Foods, 122, 106510.
[21]. Guo, Z., Dong, G., Liu, X. (2025). Unraveling the mechanisms of antitumor action of Sophora flavescens flavonoids via network pharmacology and molecular simulation. In Silico Pharmacology, 13(1), 48.
[22]. Xue, J., Liu, Y., Chen, Q. (2024). The role of flavonoids from Aurantii Fructus Immaturus in the alleviation of allergic asthma: Theoretical and practical insights. International Journal of Molecular Sciences, 25(24), 13587.
[23]. Dykes, L., & Rooney, W. L. (2006). Sorghum and millet phenols and antioxidants. Journal of Cereal Science, 44(3), 236–251.
Cite this article
Duan,Y.;Pan,M.;Kang,Z. (2025). UPLC-MS/MS-based differential analysis of seed primordial metabolism in different sorghum varieties. Journal of Food Science, Nutrition and Health,4(1),1-17.
Data availability
The datasets used and/or analyzed during the current study will be available from the authors upon reasonable request.
Disclaimer/Publisher's Note
The statements, opinions and data contained in all publications are solely those of the individual author(s) and contributor(s) and not of EWA Publishing and/or the editor(s). EWA Publishing and/or the editor(s) disclaim responsibility for any injury to people or property resulting from any ideas, methods, instructions or products referred to in the content.
About volume
Journal:Journal of Food Science, Nutrition and Health
© 2024 by the author(s). Licensee EWA Publishing, Oxford, UK. This article is an open access article distributed under the terms and
conditions of the Creative Commons Attribution (CC BY) license. Authors who
publish this series agree to the following terms:
1. Authors retain copyright and grant the series right of first publication with the work simultaneously licensed under a Creative Commons
Attribution License that allows others to share the work with an acknowledgment of the work's authorship and initial publication in this
series.
2. Authors are able to enter into separate, additional contractual arrangements for the non-exclusive distribution of the series's published
version of the work (e.g., post it to an institutional repository or publish it in a book), with an acknowledgment of its initial
publication in this series.
3. Authors are permitted and encouraged to post their work online (e.g., in institutional repositories or on their website) prior to and
during the submission process, as it can lead to productive exchanges, as well as earlier and greater citation of published work (See
Open access policy for details).
References
[1]. Mohamed, A. A., Zhang, C., & Li, Q. (2016). Comparison of physicochemical characteristics of starch isolated from sweet and grain sorghum. Journal of Chemistry, 2016, 1–15.
[2]. Gao, X., Feng, Z., Ding, Y. (2023). Genetic diversity of agronomic traits in 257 sorghum germplasm resources. Southwest China Journal of Agricultural Sciences, 36(1), 1–10.
[3]. Li, S., Liu, M., Liu, F. (2021). Current situation and future prospects of sorghum industry and seed industry development in China. Scientia Agricultura Sinica, 54(3), 471–482.
[4]. Li, Z., Li, Z., Zhou, W. (2021). Evaluation and comprehensive analysis of major agronomic traits of sorghum lines. Molecular Plant Breeding, 19(19), 6503–6511.
[5]. Baolige. (2020). Identification of salt tolerance in sorghum germplasm resources and full-length transcriptome analysis under salt stress [Master’s thesis, Jilin University].
[6]. Sow, S. H. K. P., Wang, X., Borrell, R. S. (2021). Near infrared spectroscopic evaluation of starch properties of diverse sorghum populations. Processes, 9(11), 1942.
[7]. Casimir, A. L. S., Roger, B., Freddy, A. Y. (2025). Agronomic performance of local and improved Sorghum bicolor L. Moench varieties in the Sudanian area, north of Côte d'Ivoire. International Journal of Plant & Soil Science, 37(3), 20–32.
[8]. Wu, S., & Li, S. (2024). Collaboration to address the challenges faced by smallholders in practicing organic agriculture: A case study of the organic sorghum industry in Zunyi City, China. Agriculture, 14(5), 726.
[9]. Dong, Y., & Malitsky, S. (2024). MetaboReport: From metabolomics data analysis to comprehensive reporting. Bioinformatics, Advance online publication.
[10]. Gu, W., Feng, Y., Liu, C. (2025). Transcriptomic and metabolomic unraveling of nitrogen use efficiency in sorghum: The quest for molecular adaptations to low-nitrogen stress. Plant Growth Regulation, Advance online publication.
[11]. Jiang, L., Mao, L., Lin, J. (2024). Pharmacokinetic study of granisetron in human plasma measured by UPLC-MS/MS and its use in healthy Chinese subjects. Pakistan Journal of Pharmaceutical Sciences, 37(3), 475–489.
[12]. Sun, J., LaMei, X., Ansi, A. W. (2025). Metabolic profiling and amino acid evolution in fermented oats: Insights from UPLC-MS/MS and PLS-DA analysis. Food Bioscience, 66, 106172.
[13]. Shao, M., Wang, R., Wen, C. (2025). Quantification of pectolinarin in rat plasma using UPLC-MS/MS and its pharmacokinetic analysis. Biomedical Chromatography, 39(4), e70032.
[14]. Arimboor, R., Chandrasekharan, P. L., Thaliakuzhy, Z. (2025). UPLC-MS/MS profiling of photodegradation of aflatoxin B1 in chili peppers. Journal of Food Science and Technology, Advance online publication.
[15]. González, P. D. A., Vázquez, M. V. A., Perez, O. E. (2024). Determination of antibiotic residues in pork meat from Northeast Mexico by UPLC-MS. CyTA - Journal of Food, 22(1), Article in press.
[16]. Shuo, Y., Yan, S., Zhuonan, C. (2022). Detection of mescaline in human hair samples by UPLC-MS/MS: Application to 19 authentic forensic cases. Journal of Chromatography B, 1195, 123202.
[17]. Chen, Y., Song, B., Huang, M. (2025). Multiresidue analysis of pesticides and dietary risk assessment of Coix seed by UPLC-MS/MS. Journal of Food Composition and Analysis, 140, 107192.
[18]. Xinrui W, Huaqiang L, Jinling Y. (2024). Rapid Characterization of Male and Female Taxus chinensis by Near-Infrared (NIR) Spectroscopy and High-Performance Liquid Chromatography (HPLC) with Orthogonal Partial Least Squares—Discriminant Analysis (OPLS-DA). Analytical Letters, 57(7), 1106–1122.
[19]. Wei, J., Zhang, Z., Li, D. (2015). Study on ionic liquid-assisted extraction of four flavonoid components from Sorghum bicolor. China Journal of Chinese Materia Medica, 40(7), 1305–1310.
[20]. Shen, J., Zhao, Q., Zhang, K. (2024). Insights into inhibitory mechanisms: Unraveling the structure-activity relationship of dietary flavonoids on gut bacterial β-glucuronidase. Journal of Functional Foods, 122, 106510.
[21]. Guo, Z., Dong, G., Liu, X. (2025). Unraveling the mechanisms of antitumor action of Sophora flavescens flavonoids via network pharmacology and molecular simulation. In Silico Pharmacology, 13(1), 48.
[22]. Xue, J., Liu, Y., Chen, Q. (2024). The role of flavonoids from Aurantii Fructus Immaturus in the alleviation of allergic asthma: Theoretical and practical insights. International Journal of Molecular Sciences, 25(24), 13587.
[23]. Dykes, L., & Rooney, W. L. (2006). Sorghum and millet phenols and antioxidants. Journal of Cereal Science, 44(3), 236–251.