


1. Introduction
Autism Spectrum Disorder (ASD) is a neurodevelopmental condition now recognized to affect a substantial portion of the population [1, 2]. Recent estimates indicate that roughly 1% of children worldwide are diagnosed with ASD [3]. In the United States, the identified prevalence of ASD has continued to rise—for example, about 1 in 36 eight-year-old children had ASD in 2020, increasing to approximately 1 in 31 (3.2%) in 2022 according to the latest Centers for Disease Control and Prevention (CDC) surveillance data [4, 5]. This upward trend in diagnoses underscores the growing public health impact of ASD and has spurred interest in potential contributing factors beyond genetics, including the role of the gut microbiome (the community of microorganisms residing in the Gastrointestinal (GI) tract) in ASD pathology [6]. Accumulating evidence suggests that ASD is often accompanied by GI issues and alterations in gut microbial composition, pointing to a possible connection between the brain and gut in this disorder. The following sections review known associations between ASD and the gut microbiota, and explore the microbiota-gut-brain axis as a framework for understanding how intestinal dysbiosis might influence neurodevelopment and behavior in ASD [6, 7].
Multiple studies have observed that children with ASD tend to harbor an imbalanced gut microbiome compared to neurotypical peers [8, 9]. Although no single microbial species change has been universally found across all studies—likely due to differences in diet, age, and other factors, certain recurring patterns have been reported. Notably, many ASD cohorts show a reduction in beneficial anaerobic bacteria such as Bifidobacterium spp. in their fecal microbiota [8, 10]. For instance, several independent studies have found significantly lower abundances of Bifidobacteria in ASD children relative to controls, a genus known to support gut health [8, 9]. On the other hand, some potentially pathogenic or pro-inflammatory taxa appear at higher levels in ASD. Children on the spectrum frequently exhibit an overrepresentation of certain Firmicutes, including clostridial bacteria [9, 10]. Increased abundances of Clostridia have been noted in ASD fecal profiles [9], along with other genera like Sarcina and Parabacteroides that have also been reported to be elevated in ASD patients [9, 10]. These microbial shifts are often accompanied by GI disturbances—indeed, GI symptoms such as constipation, diarrhea, and abdominal pain are common in ASD, affecting approximately 46.8% of individuals according to systematic reviews, with constipation affecting 22.2% and diarrhea affecting 13.0% [11, 12]. The co-occurrence of gut dysbiosis and GI issues in ASD has led researchers to hypothesize a mechanistic link between altered microbiota and the central nervous system. In summary, ASD is associated with notable changes in gut microbiota composition, characterized broadly by a loss of certain beneficial microbes and a proliferation of others, which suggests that gut microbial dysbiosis could be entwined with ASD symptoms and thus warrants examination through the lens of the gut-brain axis.
The microbiota-gut-brain axis refers to the bidirectional communication network linking the gut microbiome and the brain via neural, endocrine, immune, and metabolic pathways [13, 14]. In the context of ASD, this concept is particularly compelling because gut microbiota alterations might influence brain function and behavior through the production of neuromodulatory metabolites, immune regulation, or vagal nerve signaling [14, 15]. Recent datasets profiling the gut microbiome in children with ASD provide evidence of pronounced dysbiosis that could perturb this gut-brain crosstalk. For example, 16S rRNA gene sequencing data from multiple cohorts have revealed clear shifts in the fecal bacterial community of ASD patients compared to neurotypical controls [16, 17]. At the phylum level, studies have shown mixed findings regarding Firmicutes and Bacteroidetes ratios, with some ASD groups showing significantly elevated levels of Firmicutes and decreased relative abundance of Bacteroidetes compared to controls, while others have reported the opposite pattern [9, 10, 18]. These conflicting findings likely reflect methodological differences and population heterogeneity, but consistently point to disrupted microbial balance in ASD. Whole-genome shotgun metagenomic sequencing studies have further demonstrated that ASD individuals often show altered microbial diversity patterns, with some studies reporting reduced species-level richness despite changes at higher taxonomic levels [10, 19]. Such imbalances can have functional consequences, as the ASD-enriched taxa include bacteria capable of producing metabolites that may affect the nervous system. For instance, children with ASD have been found to harbor altered levels of Clostridium species and other potentially pro-inflammatory bacteria, which can produce compounds that may influence gut-brain signaling [19, 20]. Likewise, sulfate-reducing bacteria such as Desulfovibrio have been reported to be altered in some ASD microbiomes, generating metabolites that could affect gut barrier integrity and immune responses [20, 21]. The net effect of these microbial changes is often a pro-inflammatory gut milieu and altered production of neurotransmitter precursors (e.g., short-chain fatty acids, amino-acid metabolites) that travel through the bloodstream or interact with the vagus nerve, thereby affecting brain development and behavior [14, 22]. In summary, the perturbations in gut microbiota observed in ASD—characterized by altered microbial diversity and shifts in potentially beneficial versus pro-inflammatory taxa—are believed to disrupt normal gut–brain biochemical signaling. This provides a biological basis for the gut–brain axis hypothesis in ASD, whereby microbiome dysbiosis could contribute to neurological and behavioral manifestations of the disorder.
In the present study, two publicly available gut-microbiome cohorts were analyzed to identify microbial signatures that distinguish children with autism spectrum disorder from neurotypical peers. One cohort provided shotgun metagenomes from matched fecal samples. DNA was sheared to short fragments, end-repaired, adapter-ligated, and PCR-amplified before Illumina sequencing. Compared with controls, autistic subjects showed broader diversity at the phylum and genus levels but reduced species richness; gene catalogs from the two groups were of comparable scale. The second cohort contained sixteen-S rRNA amplicon profiles summarized as operational taxonomic units by participants. Bacteroidetes and Firmicutes dominated in both groups, with autism associated shifts toward Firmicutes, Proteobacteria, and Actinobacteria and a corresponding decrease in Bacteroidetes. After standard quality control and feature scaling, taxonomic and gene features served as inputs to supervised learning. A logistic-regression baseline supplied interpretable coefficients linking individual taxa and pathways to diagnosis. Two tree-based ensembles—random forest and gradient boosting—modeled non-linear structure and interactions among microbial features. Discrimination was assessed with confusion-matrix-derived metrics alongside threshold-independent ROC analysis, and model importances were compared across datasets to prioritize convergent signals. Together, this pipeline integrates complementary data types and algorithms to test separability of cases and controls, quantify predictive utility, and nominate biologically plausible hypotheses for future wet-lab validation.
2. Materials and methods
2.1. Datasets
Two publicly available gut microbiome datasets were analyzed in studies examining fecal samples from children diagnosed with ASD compared to neurotypical controls [9]. The first dataset, ASD meta abundance, contains 5,619 rows and 61 columns, where each row represents a bacterial taxon and each column represents an individual fecal sample. The second dataset, GSE113690 16S rRNA OTU dataset, contains 1,322 rows and 256 columns, where each row represents an Operational Taxonomic Unit (OTU) and each column represents an individual sample from either ASD or control groups.
2.2. ASD classification models
To investigate which gut microbiota profiles distinguish ASD from neurotypical controls, a few supervised classification algorithms, including logistic regression, random forest, and gradient boosting classifier, were implemented using the two datasets above as feature inputs.
2.3. Logistic Regression
Logistic Regression (LR) was used as a baseline linear model for classification. Specifically, a logistic function models the probability of ASD diagnosis as a weighted sum of the microbial features. The model’s coefficients provide an interpretable indication of which bacteria are positively or negatively associated with ASD.
2.4. Random Forest
Random Forest (RF) ensemble was also used to leverage non-linear relationships among microbial features. RF constructs an ensemble of decision trees using bootstrapped subsets of the data and aggregates their votes for the final prediction. This method is well-suited for microbiome classification and is robust to noise and overfitting, especially with an abundance of correlated features.
2.5. Gradient boosting classifier
Furthermore, a gradient boosting classifier (GradientBoosting) was applied to the classification task. Gradient Boosting is an ensemble learning technique that builds additive decision trees sequentially, where each new tree attempts to correct the residual errors made by the previous ensemble.
2.6. Confusion matrix
A confusion matrix is a 2×2 table summarizing a classifier’s predictions versus actual outcomes. It enumerates True Positives (TP) and True Negatives (TN) (correctly predicted ASD and non-ASD cases, respectively) as well as False Positives (FP) and False Negatives (FN) (incorrect predictions). This matrix provides a complete snapshot of performance, forming the basis for derived metrics. Accuracy is defined as follows:
2.7. Precision and recall
From the confusion matrix, precision and recall are key performance measures. Precision, or positive predictive value, is the proportion of positive predictions that were actually correct:
It reflects how reliable the model’s ASD predictions are. Recall, or sensitivity, is the proportion of actual positives correctly identified:
Recall measures the model’s ability to catch ASD cases. High recall means few ASD cases go undetected, whereas high precision means few non-ASD are incorrectly flagged as ASD.
2.8. F1 score
The F1 score is the harmonic mean of precision and recall, offering a single metric balancing both. It is defined as follows:
F1 quantifies how well the model is simultaneously identifying ASD cases and avoiding false alarms.
2.9. ROC curve and AUC
The Receiver Operating Characteristic (ROC) curve plots the true positive rate (recall) against the false positive rate:
Across different classification thresholds, the Area Under the ROC Curve (AUC) quantifies the overall ability of the model to discriminate between classes, independent of any particular threshold. AUC can be interpreted as the probability that a randomly chosen ASD case is ranked higher by the classifier than a randomly chosen control case. An AUC of 0.5 indicates no better-than-chance performance, while 1.0 indicates perfect separation.
3. Results
The first dataset contains metagenomic sequencing data of gut microbiota from children with Autism Spectrum Disorder (ASD) and healthy controls (30 ASD vs. 30 controls). Microbial DNA was extracted from fecal samples, fragmented, and sequenced using Illumina technology. The dataset reports microbial abundance profiles across taxonomic levels (phylum, genus, species), with 1,312,364 analytes detected in ASD samples and 1,335,835 analytes in controls.
Table 1 shows relative abundances of five of the bacterial taxa in control (B-prefixed) stool samples. Each row represents bacteria taxonomy, with genus and species, and each column represents healthy control subjects (sample IDs prefixed with "B"). Each cell represents the raw read abundance per sample, with columns corresponding to individual participants.
|
Taxonomy |
B1 |
B2 |
B3 |
B5 |
B6 |
B7 |
B8 |
B13 |
B14 |
B28 |
… |
B120 |
B127 |
B132 |
B141 |
B142 |
B143 |
B152 |
|
g__Faecalibacterium; |
4,269 |
4,397 |
4,499 |
6,126 |
7,020 |
5,404 |
4,404 |
5,811 |
3,360 |
4,141 |
… |
4,471 |
5,868 |
6,561 |
4,910 |
4,492 |
2,812 |
5,303 |
|
g__Hungatella; |
1,217 |
6,238 |
2,325 |
5,004 |
2,829 |
2,192 |
2,921 |
4,303 |
2,793 |
3,671 |
… |
2,126 |
4,429 |
2,598 |
4,222 |
4,925 |
5,753 |
1,261 |
|
g__Clostridium; |
3,853 |
4,624 |
3,842 |
4,399 |
3,916 |
3,355 |
5,165 |
4,453 |
1,999 |
3,974 |
… |
4,085 |
6,041 |
6,188 |
3,960 |
4,403 |
2,841 |
2,746 |
|
g__Butyricimonas; |
1,624 |
1 |
703 |
43 |
46 |
1,505 |
32 |
1,474 |
2 |
52 |
… |
2,065 |
21 |
27 |
55 |
35 |
8 |
884 |
|
g__Alistipes; |
2,452 |
3 |
819 |
2,761 |
691 |
2,768 |
25 |
1,095 |
13 |
4 |
… |
90 |
22 |
30 |
1,027 |
2,641 |
4 |
1,587 |
Table 2 shows relative abundances of five of the bacterial taxa in ASD (A-prefixed) stool samples. Each row represents bacteria taxonomy, with genus and species, and each column represents Autism Spectrum Disorder (sample IDs prefixed with "A"). Each cell represents the raw read abundance per sample, with columns corresponding to individual participants.
|
Taxonomy |
A3 |
A5 |
A6 |
A9 |
A31 |
A51 |
A52 |
A53 |
A54 |
A59 |
… |
A101 |
A109 |
A113 |
A114 |
A115 |
A142 |
A144 |
|
g__Faecalibacterium; |
4,998 |
5,060 |
2,905 |
5,745 |
4,822 |
3,889 |
4,646 |
6,337 |
5,064 |
6,359 |
… |
3,833 |
3,771 |
5,489 |
6,762 |
3,045 |
6,205 |
6,048 |
|
g__Hungatella; |
5,803 |
5,612 |
4,109 |
1,432 |
2,652 |
4,175 |
3,891 |
894 |
4,903 |
2,970 |
… |
6,849 |
4,390 |
2,091 |
1,638 |
4,613 |
2,601 |
1,892 |
|
g__Clostridium; |
3,793 |
2,795 |
1,355 |
5,558 |
5,383 |
3,505 |
5,541 |
4,429 |
4,121 |
3,258 |
… |
4,586 |
1,014 |
4,100 |
4,336 |
2,301 |
6,372 |
4,020 |
|
g__Butyricimonas; |
64 |
1,385 |
725 |
1,553 |
40 |
53 |
33 |
175 |
58 |
1,636 |
… |
3,285 |
30 |
54 |
1,168 |
50 |
38 |
49 |
|
g__Alistipes; |
15 |
20 |
723 |
620 |
3,261 |
43 |
83 |
37 |
43 |
1,114 |
… |
3,159 |
61 |
2,606 |
2,821 |
21 |
2,276 |
3 |
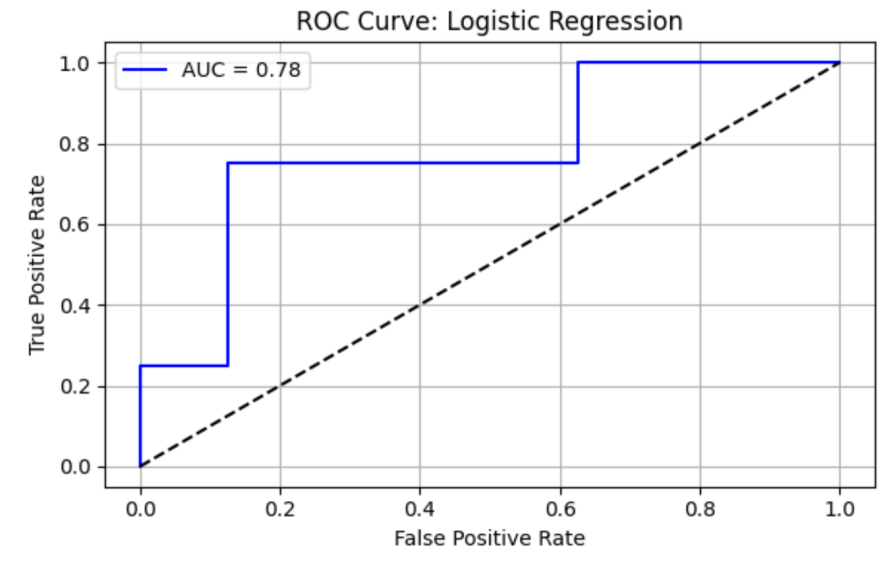
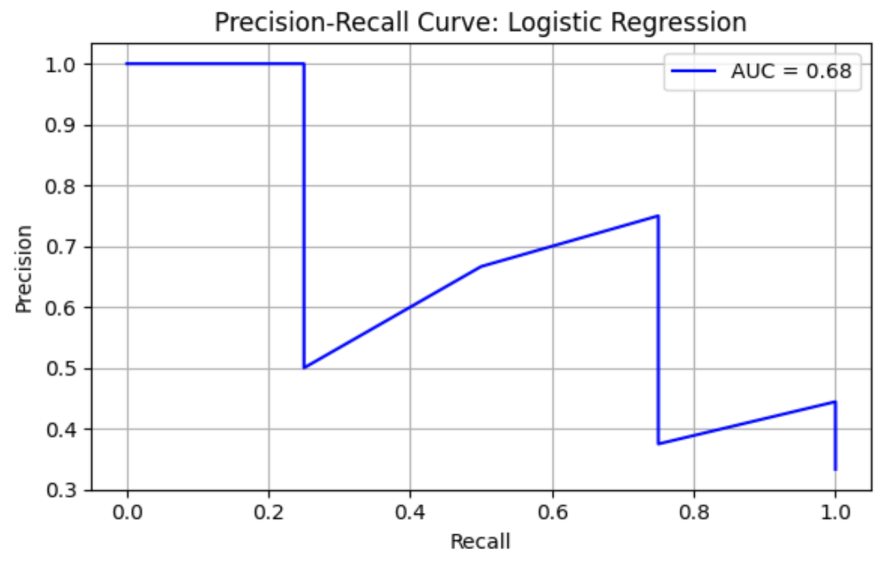
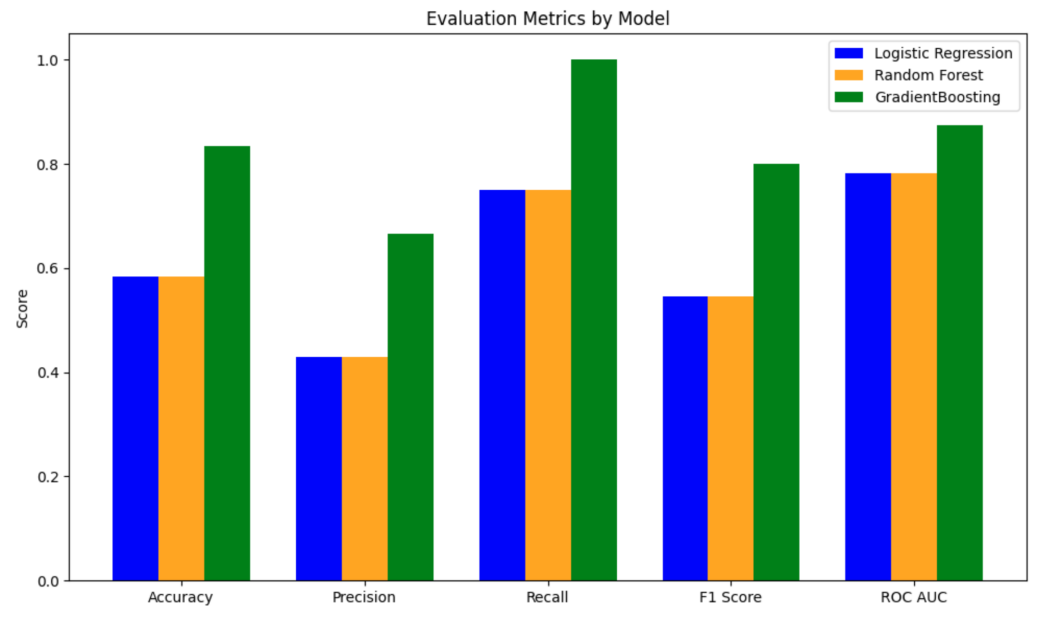
Logistic Regression (LR) model shows precision = 0.43, recall = 0.75, F1 = 0.55, AUC-ROC = 0.78125. ROC curve and Precision-Recall curve are as follows (Figure 1 and Figure 2).
The top three most important genus are Porphyromonas, species Porphyromonas macacae (importance value = 0.028017), followed by Prevotella, species Prevotella sp. oral taxon 299 (importance value = 0.025634), and Prevotella, species Prevotella amnii (importance value = 0.025554) (Table 3).
|
Full Name |
Importance |
Norm Importance |
|
g__Porphyromonas; s__Porphyromonas macacae |
0.028017 |
1.000000 |
|
g__Prevotella; s__Prevotella sp. oral taxon 299 |
0.025634 |
0.914935 |
|
g__Prevotella; s__Prevotella amnii |
0.025554 |
0.912085 |
|
g__Unclassified; s__Bacteroidales bacterium KHT7 |
0.025151 |
0.897702 |
|
g__Prevotella; s__Prevotella sp. P5-125 |
0.024578 |
0.877273 |
|
g__Prevotella; s__Prevotella pallens |
0.024077 |
0.859382 |
|
g__Prevotella; s__Prevotella sp. CAG:1185 |
0.023658 |
0.844413 |
|
g__Parabacteroides; s__Parabacteroides sp. CAG:409 |
0.023558 |
0.840836 |
|
g__Virgibacillus; s__Virgibacillus salinus |
0.023544 |
0.840357 |
|
g__Bacteroides; s__Bacteroides caccae CAG:21 |
0.023478 |
0.837992 |
The table shows the top 10 bacterial genera and species contributing to the LR model used to distinguish ASD from healthy controls. "Importance" indicates the raw contribution of each feature to model performance, while "Norm Importance" represents the normalized importance relative to the most influential taxon. Higher values indicate greater relative importance in model prediction.
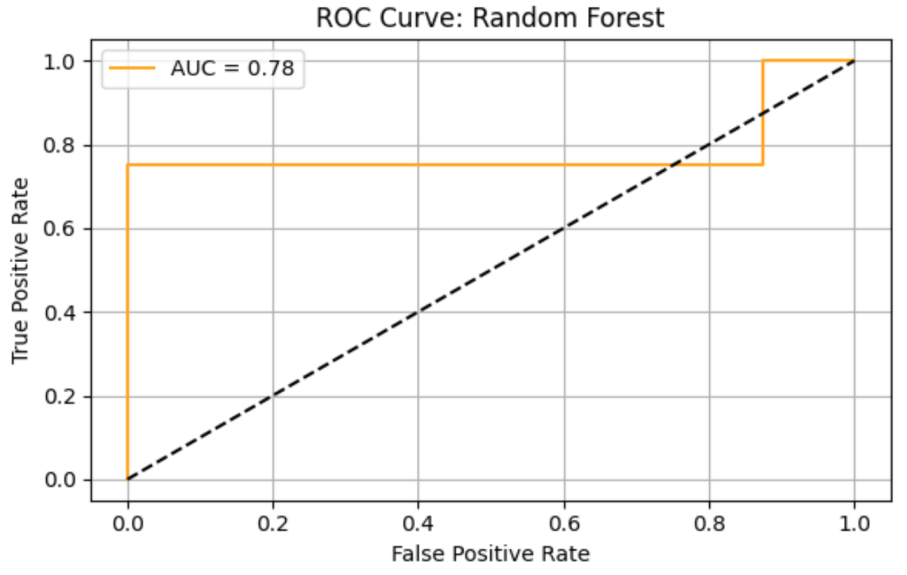
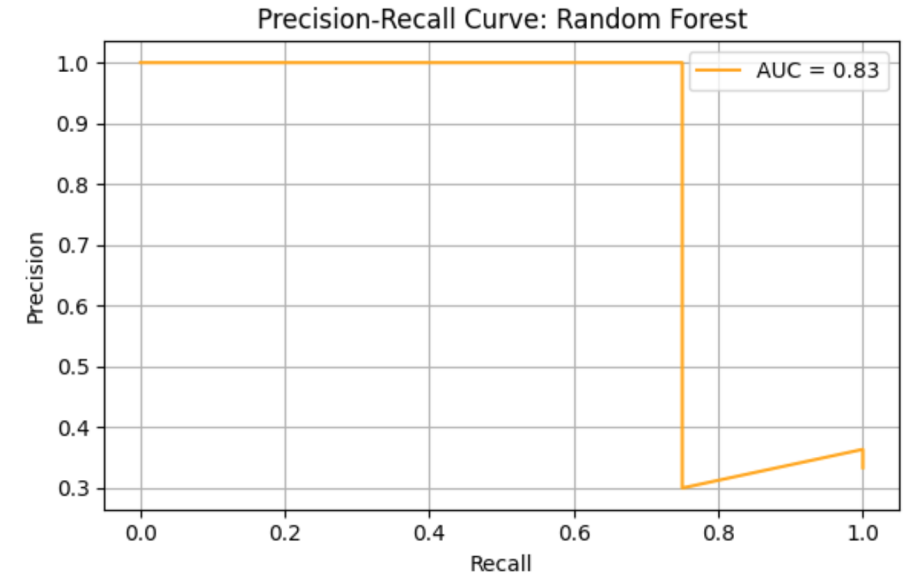
Random Forrest (RF) model shows precision = 0.43, recall = 0.75, F1 = 0.55, AUC-ROC = 0.78125. ROC curve and Precision-Recall curve are as follows (Figure 3 and Figure 4).
The top three most important genus are Prevotella, species Prevotella ruminicola (importance value = 0.028678), followed by Bacteroides, species Bacteroides finegoldii (importance value = 0.022608), and Prevotella, Prevotella sp. 109 (importance value = 0.020872) (Table 4).
|
Full Name |
Importance |
Norm Importance |
|
g__Prevotella;s__Prevotella ruminicola |
0.028678 |
1.000000 |
|
g__Bacteroides;s__Bacteroides finegoldii |
0.022608 |
0.788361 |
|
g__Prevotella;s__Prevotella sp. 109 |
0.020872 |
0.727813 |
|
g__Bacteroides;s__Bacteroides sp. CAG:770 |
0.015970 |
0.556863 |
|
g__Prevotella;s__Prevotella sp. CAG:279 |
0.015749 |
0.549163 |
|
g__Unclassified;s__Bacteroidaceae bacterium MS4 |
0.013588 |
0.473834 |
|
g__Prevotella;s__Prevotella sp. CAG:255 |
0.013431 |
0.468360 |
|
g__Prevotella;s__Prevotella sp. CAG:1058 |
0.013371 |
0.466242 |
|
g__Bacteroides;s__Bacteroides acidifaciens |
0.013113 |
0.457257 |
|
g__Barnesiella;s__Barnesiella viscericola |
0.012606 |
0.439563 |
The table lists the top microbial genera and species contributing to the RF model used to classify ASD and healthy control samples. "Importance" indicates the raw contribution of each feature to model performance, while "Norm Importance" represents the normalized importance relative to the most influential taxon. Higher values indicate greater relative importance in model prediction.
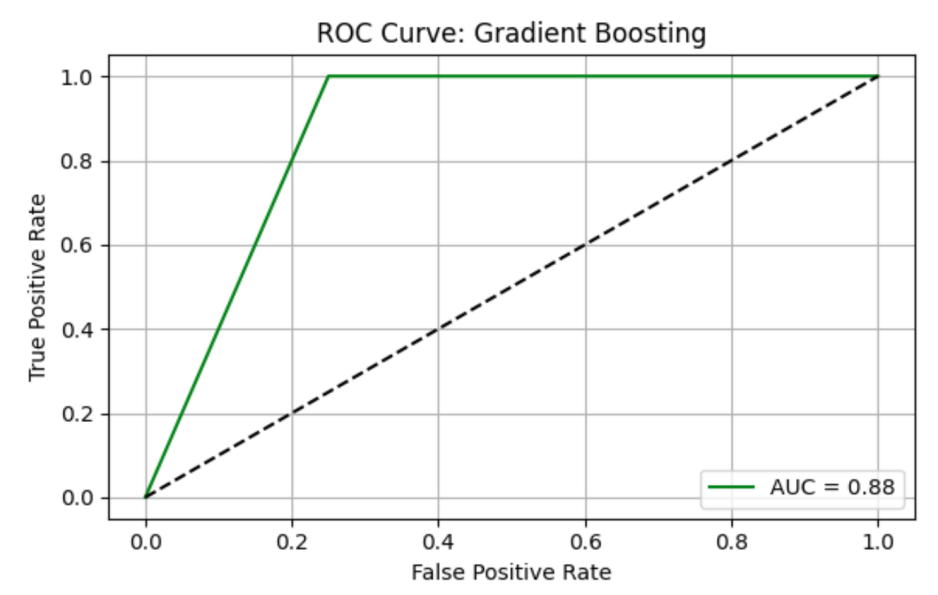
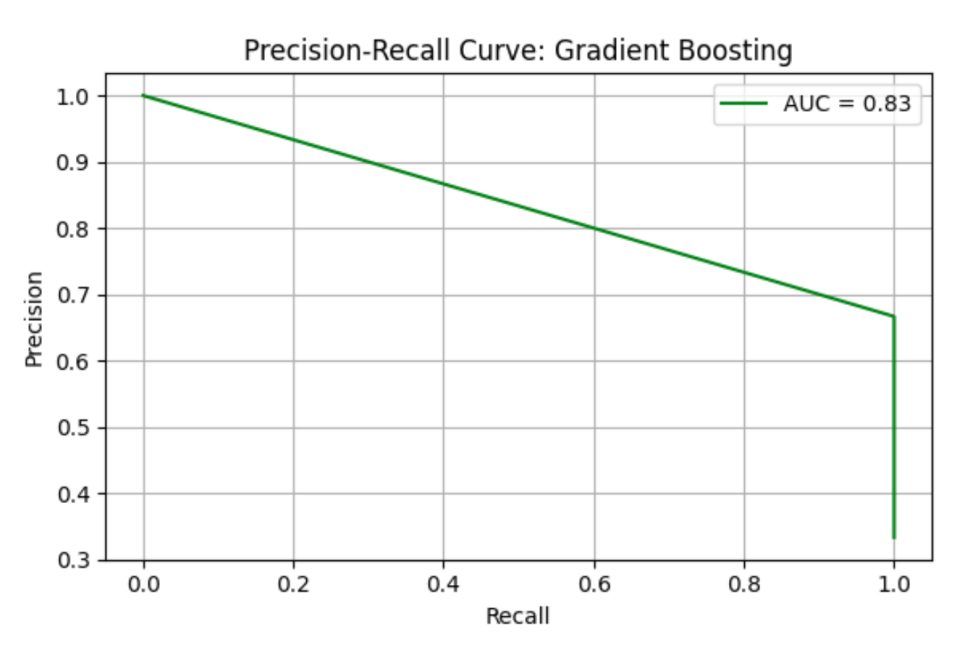
Gradient Boosting (GB) model shows precision = 0.67, recall = 1.00, F1 = 0.80, AUC-ROC = 0.87500. ROC curve and Precision-Recall curve are as follows (Figure 5 and Figure 6).
The top three most important genus are Prevotella, species Prevotella sp. 109 (importance value = 0.778462), followed by Prevotella, species Prevotella ruminicola (importance value = 0.078688), and Bacteroides, Bacteroides thetaiotaomicron (importance value = 0.055255) (Table 5).
|
Full Name |
Importance |
Norm Importance |
|
g__Prevotella;s__Prevotella sp. 109 |
0.778462 |
1.000000 |
|
g__Prevotella;s__Prevotella ruminicola |
0.078688 |
0.101081 |
|
g__Bacteroides;s__Bacteroides thetaiotaomicron... |
0.055255 |
0.070980 |
|
g__Lactobacillus;s__Lactobacillus plantarum |
0.024748 |
0.031791 |
|
g__Jeotgalibacillus;s__Jeotgalibacillus malays... |
0.011714 |
0.015048 |
|
g__Parabacteroides;s__Parabacteroides sp. CAG:2 |
0.009493 |
0.012194 |
|
g__Ruminococcus;s__Ruminococcus sp. CAG:624 |
0.007708 |
0.009901 |
|
g__Tolypothrix;s__Tolypothrix campylonemoides |
0.006267 |
0.008051 |
|
g__Halothece;s__Halothece sp. PCC 7418 |
0.005102 |
0.006553 |
|
g__Diplosphaera;s__Diplosphaera colitermitum |
0.004156 |
0.005339 |
The table lists the top microbial genera and species contributing to the GB model used to classify ASD and healthy control samples. "Importance" indicates the raw contribution of each feature to model performance, while "Norm Importance" represents the normalized importance relative to the most influential taxon. Higher values indicate greater relative importance in model prediction.
Overall, the GB model has the best performance, with an AUC-ROC = 0.87500, and LR and RF models performed the same (AUC-ROC = 0.78125). The top three most important genus from the LR, RF and GB models are Prevotella (appearance frequency in top 10 importance from the three models = 12 out of 30), followed by Bacteroides (appearance frequency = 6 out of 30), and Parabacteroides (appearance frequency = 2 out of 30) (Figure 7).
The second dataset contains 16S rRNA sequencing data of gut microbiota from children with Autism Spectrum Disorder (ASD) compared with healthy controls. A total of 1,322 Operational Taxonomic Units (OTUs) were identified from the sequence data. The dominant phyla in both groups were Bacteroidetes and Firmicutes, but their relative abundances differed significantly between ASD and controls.
Table 6 shows the abundance profiles of selected bacterial taxa in ASD (A group) samples. Each row represents a bacterial taxon, and each column represents individual ASD samples (A1-A95). Cell values indicate raw abundance counts.
|
Short_Taxonomy |
A1 |
A10 |
A100 |
A101 |
A102 |
A105 |
A106 |
A108 |
A109 |
… |
A88 |
A89 |
A9 |
A90 |
A91 |
A92 |
A93 |
A95 |
|
Lachnospiraceae_bacterium_ |
0 |
0 |
0 |
0 |
0 |
0 |
0 |
0 |
0 |
… |
0 |
0 |
0 |
0 |
0 |
0 |
0 |
0 |
|
Sphingopyxis_granuli |
0 |
0 |
0 |
0 |
0 |
0 |
0 |
0 |
0 |
… |
0 |
0 |
0 |
0 |
0 |
0 |
0 |
0 |
|
Faecalicoccus |
0 |
0 |
0 |
0 |
0 |
0 |
2 |
0 |
0 |
… |
0 |
0 |
0 |
0 |
0 |
0 |
0 |
0 |
|
Streptococcus_anginosus_ |
0 |
0 |
0 |
0 |
0 |
0 |
0 |
0 |
1 |
… |
0 |
0 |
0 |
0 |
1 |
0 |
0 |
1 |
|
Mollicutes_RF9 |
0 |
0 |
1 |
0 |
0 |
1 |
3 |
2 |
0 |
… |
0 |
0 |
0 |
0 |
0 |
0 |
1 |
1 |
Table 7 shows Abundance profiles of selected bacterial taxa in control (B group) samples. Each row represents a bacterial taxon, and each column represents individual control samples (B1-B59). Cell values indicate raw abundance counts.
|
Short_Taxonomy |
B1 |
B10 |
B100 |
B101 |
B103 |
B104 |
B105 |
B106 |
B107 |
B108 |
… |
B52 |
B54 |
B55 |
B56 |
B57 |
B58 |
B59 |
|
Lachnospiraceae_bacterium_ |
0 |
0 |
0 |
0 |
0 |
0 |
0 |
0 |
0 |
0 |
… |
0 |
0 |
0 |
0 |
0 |
0 |
0 |
|
Sphingopyxis_granuli |
0 |
0 |
0 |
0 |
0 |
0 |
0 |
0 |
0 |
0 |
… |
0 |
0 |
0 |
0 |
0 |
0 |
0 |
|
Faecalicoccus |
0 |
0 |
0 |
0 |
0 |
0 |
0 |
0 |
1 |
0 |
… |
0 |
0 |
0 |
0 |
0 |
0 |
0 |
|
Streptococcus_anginosus_ |
0 |
0 |
0 |
0 |
0 |
0 |
0 |
0 |
0 |
0 |
… |
0 |
0 |
0 |
0 |
0 |
0 |
0 |
|
Mollicutes_RF9 |
0 |
0 |
0 |
0 |
0 |
0 |
0 |
0 |
0 |
0 |
… |
0 |
0 |
0 |
0 |
0 |
0 |
0 |
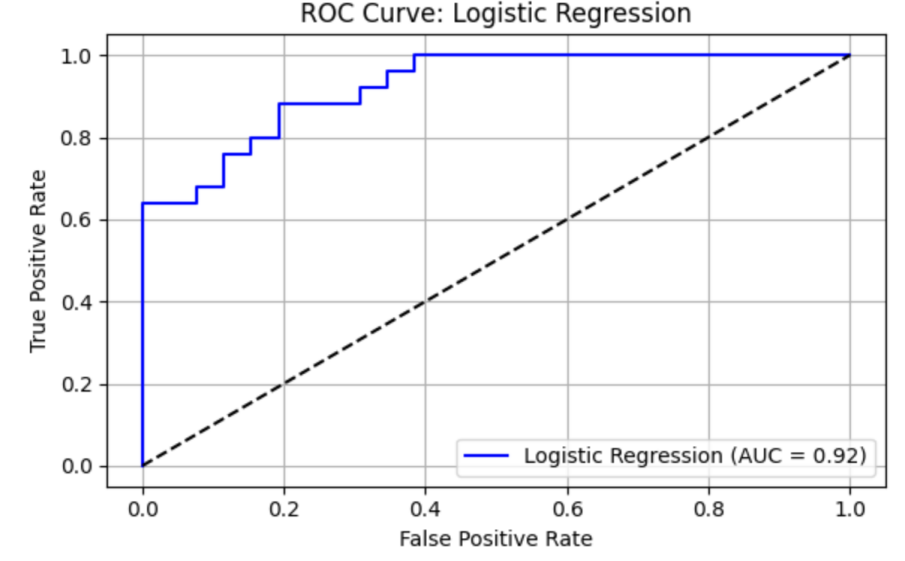
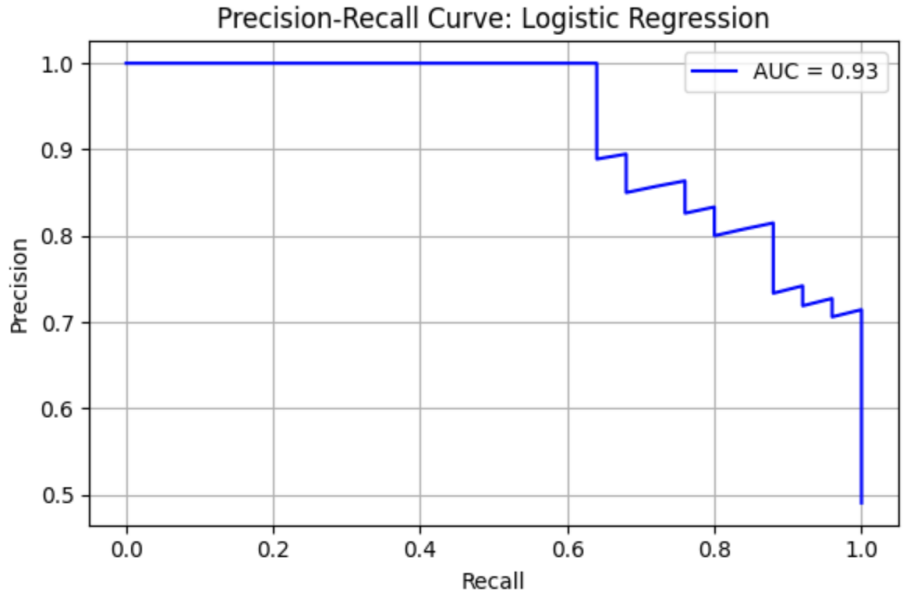
LR model shows precision = 0.81, recall = 0.88, F1 = 0.85, AUC-ROC = 0.92462. ROC curve and Precision-Recall curve are as follows (Figure 8 and Figure 9).
The top three most important genus are Alistipes (importance value = 0.036909), followed by Acidaminococcus (importance value = 0.034989), and Uminiclostridium (importance value = 0.034476) (Table 8).
|
Full Name |
Importance |
Norm Importance |
|
d__Bacteria;_k__norank;_p__Bacteroidetes;_c__Bacteroidia;_o__Bacteroidales; |
0.036909 |
1.000000 |
|
d__Bacteria;_k__norank;_p__Firmicutes;_c__Negativicutes;_o__Selenomonadales; |
0.034989 |
0.947988 |
|
d__Bacteria;_k__norank;_p__Firmicutes;_c__Clostridia;_o__Clostridiales; |
0.034476 |
0.934080 |
|
d__Bacteria;_k__norank;_p__Firmicutes;_c__Clostridia;_o__Clostridiales; |
0.030622 |
0.829654 |
|
d__Bacteria;_k__norank;_p__Bacteroidetes;_c__Bacteroidia;_o__Bacteroidales; |
0.029501 |
0.799294 |
|
d__Bacteria;_k__norank;_p__Bacteroidetes;_c__Bacteroidia;_o__Bacteroidales; |
0.028867 |
0.782114 |
|
d__Bacteria;_k__norank;_p__Firmicutes;_c__Clostridia;_o__Clostridiales; |
0.028247 |
0.765324 |
|
d__Bacteria;_k__norank;_p__Firmicutes;_c__Clostridia;_o__Clostridiales;_f__Lachnospiraceae; |
0.027654 |
0.749243 |
|
d__Bacteria;_k__norank;_p__Firmicutes;_c__Clostridia;_o__Clostridiales;_f__Ruminococcaceae; |
0.026571 |
0.719921 |
|
d__Bacteria;_k__norank;_p__Proteobacteria;_c__Deltaproteobacteria;_o__Desulfovibrionales; |
0.024331 |
0.659230 |
The table lists the most important Operational Taxonomic Units (OTUs) identified from ASD and healthy control gut microbiome samples. "Importance" reflects the absolute contribution of each taxon to the LR classifier, while "Norm Importance" represents the relative importance normalized to the highest-ranked feature. Key taxa include members of the phyla Bacteroidetes (e.g., Alistipes, Prevotella, Parabacteroides) and Firmicutes (e.g., Ruminococcus, Lachnospira, Eubacterium), suggesting that both phyla contribute substantially to distinguishing ASD from controls.
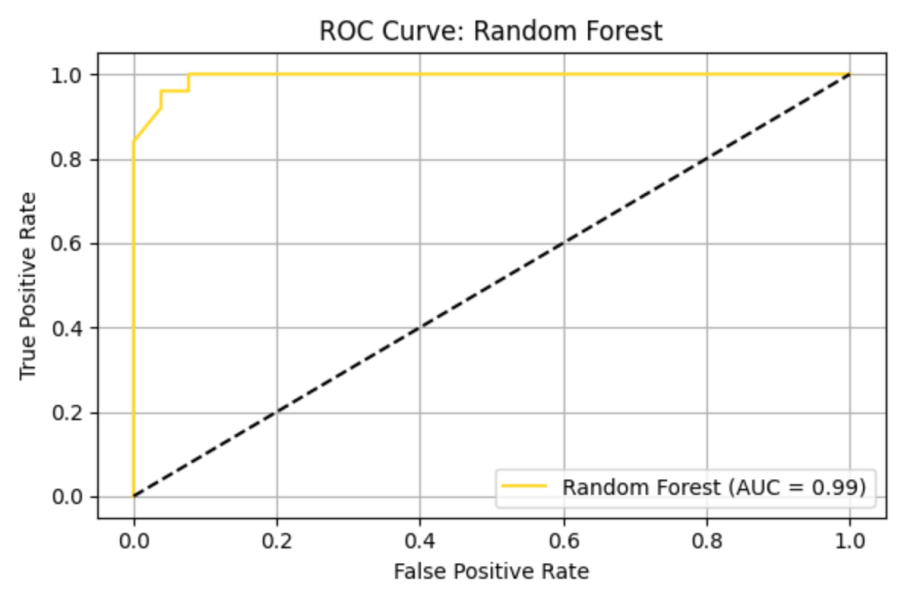
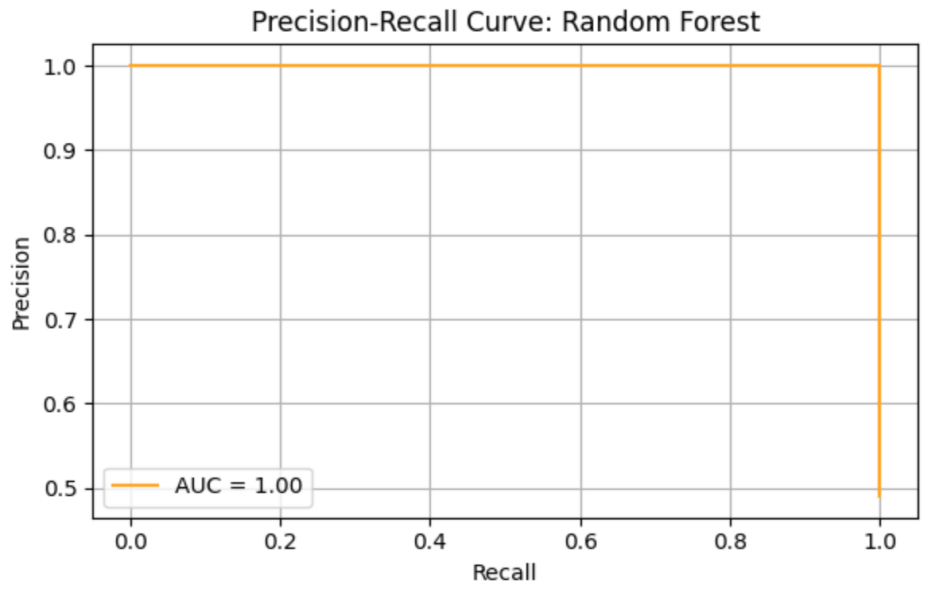
RF model shows precision = 0.93, recall = 1.00, F1 = 0.96, AUC-ROC = 0.99638. ROC curve and Precision-Recall curve are as follows (Figure 10 and Figure 11).
The top three most important genus are Lachnoclostridium (importance value = 0.021960), followed by Ruminococcaceae_UCG-014 (importance value = 0.020574), and Barnesiella (importance value = 0.018044) (Table 9).
|
Full Name |
Importance |
Norm Importance |
|
d__Bacteria;_k__norank;_p__Firmicutes;_c__Clostridia; |
0.021960 |
1.000000 |
|
d__Bacteria;_k__norank;_p__Firmicutes;_c__Clostridia; |
0.020574 |
0.936892 |
|
d__Bacteria;_k__norank;_p__Bacteroidetes;_c__Bacteroidia;_o__Bacteroidales; |
0.018044 |
0.821664 |
|
d__Bacteria;_k__norank;_p__Bacteroidetes;_c__Bacteroidia;_o__Bacteroidales; |
0.016655 |
0.758433 |
|
d__Bacteria;_k__norank;_p__Proteobacteria;_c__Betaproteobacteria;_o__Burkholderiales; |
0.014245 |
0.648698 |
|
d__Bacteria;_k__norank;_p__Firmicutes;_c__Clostridia;_o__Clostridiales; |
0.013887 |
0.632373 |
|
d__Bacteria;_k__norank;_p__Firmicutes;_c__Clostridia;_o__Clostridiales; |
0.013879 |
0.631997 |
|
d__Bacteria;_k__norank;_p__Firmicutes;_c__Clostridia;_o__Clostridiales; |
0.012114 |
0.551630 |
|
d__Bacteria;_k__norank;_p__Bacteroidetes;_c__Bacteroidia;_o__Bacteroidales; |
0.011761 |
0.535584 |
|
d__Bacteria;_k__norank;_p__Firmicutes;_c__Clostridia;_o__Clostridiales; |
0.011373 |
0.517922 |
The table displays the most influential Operational Taxonomic Units (OTUs) identified in ASD versus healthy control samples. "Importance" indicates the contribution of each feature to the RF classifier, while "Norm Importance" normalizes this score relative to the highest-ranked feature. The top-ranked taxa belong primarily to Firmicutes (e.g., Lachnoclostridium, Ruminococcaceae UCG-014) and Bacteroidetes (e.g., Barnesiella, Prevotella), with additional contributions from Proteobacteria (Comamonadaceae). These results highlight the multi-phylum microbial signals that the RF model leverages to distinguish ASD from control gut microbiomes.
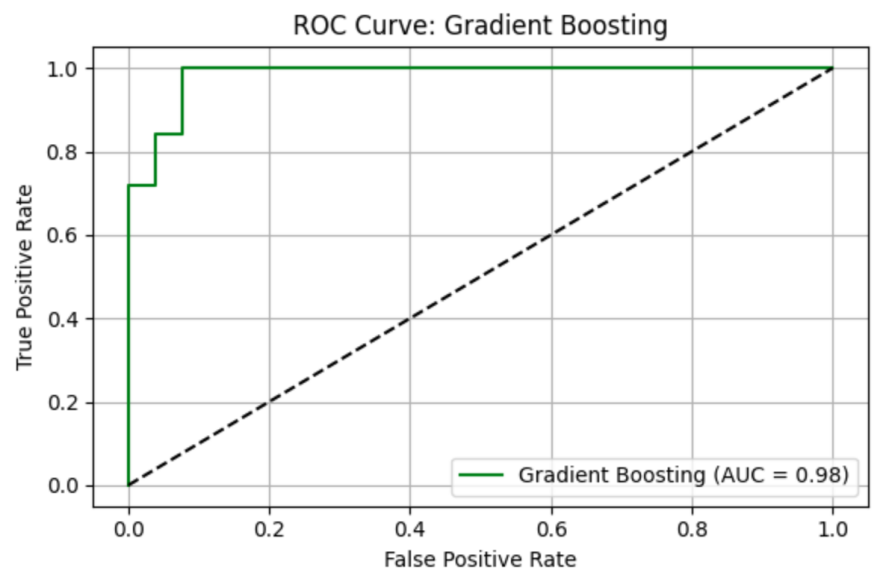
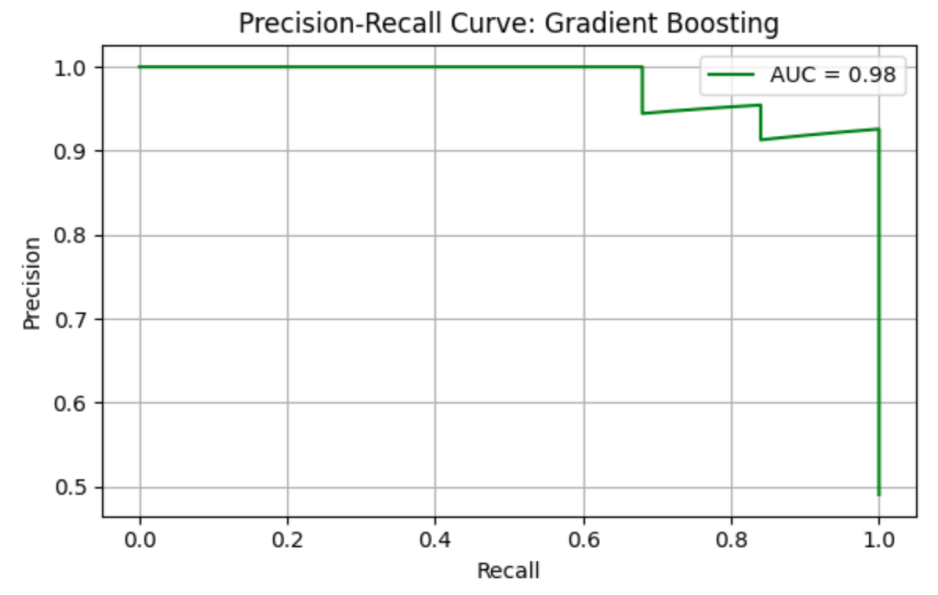
GB model shows precision = 0.93, recall = 1.00, F1 = 0.96, AUC-ROC = 0.98308. ROC curve and Precision-Recall curve are as follows (Figure 12 and Figure 13).
The top three most important genus are Prevotella_2 (importance value = 0.356231), followed by Anaerotruncus (importance value = 0.091146), and Megasphaera (importance value = 0.058656) (Table 10).
|
Full Name |
Importance |
Norm Importance |
|
d__Bacteria;_k__norank;_p__Bacteroidetes;_c__Bacteroidia;_o__Bacteroidales; |
0.356231 |
1.000000 |
|
d__Bacteria;_k__norank;_p__Firmicutes;_c__Clostridia;_o__Clostridiales; |
0.091146 |
0.255862 |
|
d__Bacteria;_k__norank;_p__Firmicutes;_c__Negativicutes;_o__Selenomonadales; |
0.058656 |
0.164656 |
|
d__Bacteria;_k__norank;_p__Firmicutes;_c__Clostridia;_o__Clostridiales;_f__Lachnospiraceae; |
0.049170 |
0.138029 |
|
d__Bacteria;_k__norank;_p__Firmicutes;_c__Clostridia;_o__Clostridiales; |
0.046248 |
0.129826 |
|
d__Bacteria;_k__norank;_p__Firmicutes;_c__Clostridia;_o__Clostridiales;_f__Lachnospiraceae; |
0.033643 |
0.094441 |
|
d__Bacteria;_k__norank;_p__Fusobacteria;_c__Fusobacteriia;_o__Fusobacteriales; |
0.032311 |
0.090702 |
|
d__Bacteria;_k__norank;_p__Firmicutes;_c__Clostridia;_o__Clostridiales;_f__Ruminococcaceae; |
0.026538 |
0.074498 |
|
d__Bacteria;_k__norank;_p__Bacteroidetes;_c__Bacteroidia;_o__Bacteroidales; |
0.023210 |
0.065153 |
|
d__Bacteria;_k__norank;_p__Firmicutes;_c__Clostridia;_o__Clostridiales;_f__Lachnospiraceae; |
0.021597 |
0.060627 |
The table highlights the most influential Operational Taxonomic Units (OTUs) identified for differentiating ASD and healthy control samples in the GB model. "Importance" indicates the raw contribution of each taxon to the classifier, while "Norm Importance" is normalized relative to the highest-ranked feature. The strongest feature was Prevotella (phylum Bacteroidetes), followed by multiple taxa within Firmicutes (e.g., Anaerotruncus, Megasphaera, Lachnoclostridium, Clostridium scindens), and additional contributions from Fusobacteria. This pattern suggests that GB placed the greatest weight on specific taxa-level shifts, especially within Prevotella and Lachnospiraceae, to achieve its high classification accuracy.
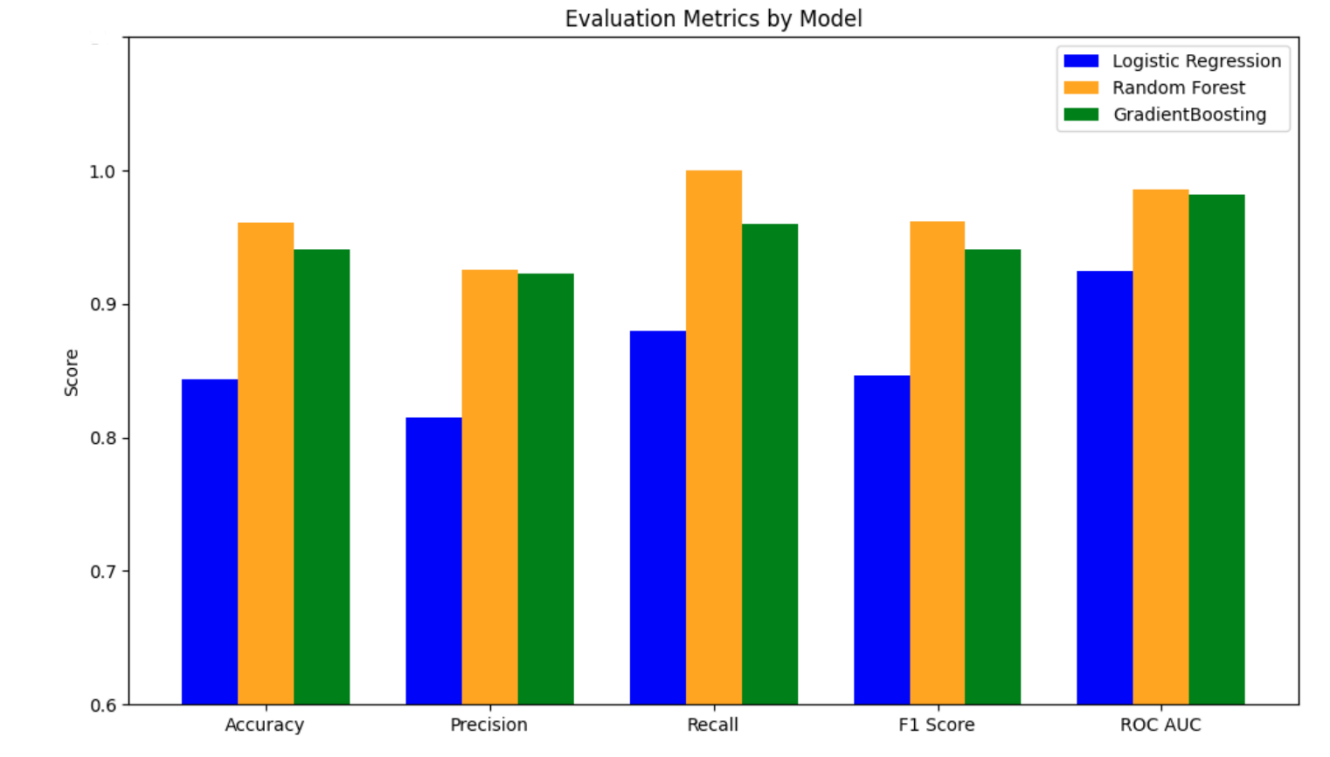
Overall, the RF model has the best performance, with an AUC-ROC = 0.995, followed by the GB model (AUC-ROC = 0.983) and the LR model (AUC-ROC = 0.925). The top three most important genus from the LR, RF and GB models are Lachnoclostridium (appearance frequency in top 10 importance from the three models = 4 out of 30), followed by Prevotella (appearance frequency = 4 out of 30), and Eubacterium (appearance frequency = 2 out of 30) (Figure 14).
In summary, considering both datasets, Prevotella is the most important genus, followed by Bacteroides, Parabacteroides, and Lachnoclostridium.
4. Discussion
In the present study, we identified Prevotella as the most consistent microbial marker distinguishing ASD from controls, appearing 16 times across models and datasets (12 occurrences in gut abundance dataset: LR = 5, RF = 5, GB = 2; 4 occurrences in 16S dataset: LR = 1, RF = 2, GB = 1). Bacteroides ranked second with 6 total occurrences (LR = 2, RF = 3, GB = 1), while Parabacteroides appeared 2 times (LR = 1, GB = 1). In contrast, Lachnoclostridium showed dataset-dependent relevance, detected 4 times exclusively in the 16S dataset (LR = 1, RF = 1, GB = 2). Gradient Boosting achieved the highest predictive performance (AUC-ROC = 0.88; F1 = 0.80), indicating strong classification ability. These findings suggest Prevotella-driven gut dysbiosis as a robust feature of ASD microbiome profiles.
Prevotella
In our analyses, Prevotella consistently emerged as a key genus differentiating ASD from controls. It appeared 12 times in models using the ASD gut abundance dataset (LR = 5, RF = 5, GB = 2) and 4 times in models using the 16S rRNA dataset (LR = 1, RF = 2, GB = 1), making it one of the most frequently selected taxa across all three machine learning approaches [23, 24].
Several studies report Prevotella significantly enriched in the gut microbiota of ASD children compared to neurotypical controls [25], which is consistent with our findings. A 16S rRNA study in Chinese cohorts also observed elevated Prevotella, suggesting that higher levels may contribute to ASD-related gut dysbiosis. Mechanistically, Prevotella can function as an intestinal pathobiont, triggering mucosal inflammation and upregulating cytokines such as Interleukin-6 (IL-6) and IL-8 through TLR4-mediated pathways, leading to chronic inflammation that affects the gut-brain axis and may worsen ASD symptoms [26]. In addition, Prevotella species produce short-chain fatty acids including propionate, a neuroactive metabolite that, when in excess, has been linked to autism-like behaviors in rodent models [27].
Conversely, other studies identify Prevotella depletion in ASD, suggesting it can play a protective role [28]. Kang et al. reported significantly lower Prevotella abundance in autistic children versus neurotypical peers. Restoration of Prevotella through microbiota interventions shifted the ASD gut microbiome toward a more neurotypical composition and reduced symptom severity [19]. This protective effect is likely mediated by the production of beneficial SCFAs like acetate and butyrate, which strengthen both the gut and blood-brain barriers and reduce systemic inflammation [29]. Furthermore, a clinical trial using Fecal Microbiota Transfer Therapy (FMT) demonstrated that increasing Prevotella abundance led to sustained improvements in GI function and behavior in ASD children [19].
The conflicting results across studies likely stem from differences in diet, geography, and microbial strain diversity [30-33]. Western ASD populations often consume low-fiber diets, leading to markedly lower Prevotella, while cohorts from regions with high fiber intake, such as parts of Asia, frequently report higher levels in ASD. Moreover, strain-level variation within Prevotella may result in some species exhibiting pro-inflammatory effects while others are beneficial, explaining why the genus can appear either enriched or depleted depending on population and environmental factors [25, 28].
Bacteroides
In our ASD gut microbiome dataset, Bacteroides appeared as a top-ranking feature in 6 model runs: Logistic Regression = 2, Random Forest = 3, and Gradient Boosting = 1, indicating moderate importance in distinguishing ASD from control samples.
Consistent with our results, the genus Bacteroides is frequently reported at higher relative abundance in children with ASD compared to neurotypical controls [7]. Multiple studies have found Bacteroides to be over-represented in ASD fecal samples, consistent with meta-analyses showing elevated Bacteroides in ASD populations [7]. One mechanism linking Bacteroides to increased ASD risk is propionate production [27]. Bacteroides spp. are major producers of propionic acid, and excess propionate can cross the blood-brain barrier and induce neurobehavioral changes characteristic of ASD in rodent models [27]. Another mechanism involves endotoxin-mediated inflammation [31]. Being Gram-negative bacteria, Bacteroides shed Lipopolysaccharides (LPS), which are potent endotoxins that can strongly activate immune pathways, potentially causing systemic inflammation that disrupts neurodevelopment [31].
Some studies report higher Bacteroides levels in neurotypical controls, suggesting a protective role [16]. An analysis found significantly lower mucosa-associated Bacteroides in ASD patients compared to controls, indicating that increased Bacteroides abundance may sometimes reflect a healthy gut ecosystem [16]. A key protective mechanism involves gut barrier and metabolite modulation [34]. Colonization by Bacteroides fragilis in ASD mouse models strengthens the intestinal barrier and corrects abnormal metabolite profiles, leading to improvements in communication and anxiety-like behaviors [34]. Bacteroides fragilis also metabolizes harmful neuroactive compounds, reducing their systemic levels and ameliorating ASD-like symptoms [34]. Another mechanism is immunoregulation through production of polysaccharide A, which promotes regulatory T-cell development and anti-inflammatory IL-10 secretion, countering the heightened pro-inflammatory state frequently observed in ASD [35]. Clinical studies using Bacteroides fragilis have demonstrated reductions in gastrointestinal dysfunction and ASD symptom severity [36].
Differences in Bacteroides patterns across studies likely result from population and diet variations [30]. Western high-fat, high-protein diets favor Bacteroides, whereas high-fiber diets suppress its abundance, leading to variability in associations with ASD [30]. Methodological differences also play a role, as some studies detect Bacteroides elevation in stool samples while intestinal biopsy samples show decreases, highlighting the importance of sampling sites [20]. In addition, variation in sequencing platforms and bioinformatics pipelines can lead to discrepancies in taxa detection and interpretation [7].
4.1. Parabacteroides
In our ASD gut microbiome dataset, Parabacteroides was identified as a top feature in 2 model runs: Logistic Regression = 1, Random Forest = 0, and Gradient Boosting = 1, suggesting a low-to-moderate role in distinguishing ASD from controls.
Several studies report that Parabacteroides levels are significantly altered in children with ASD compared to neurotypical peers [16]. Machine-learning analyses across multiple cohorts have highlighted Parabacteroides as one of the genera associated with ASD-related microbiome changes. One mechanism involves pro-inflammatory metabolite production [37]. Certain Parabacteroides species produce succinate, which functions as a pro-inflammatory signal that drives immune cells toward a pro-inflammatory phenotype and stimulates cytokine release, including IL-1β and IL-6, thereby promoting gut and systemic inflammation [37]. Another mechanism involves endotoxin diversity, as some Parabacteroides strains carry genes that alter LPS structure, potentially amplifying gut immune dysregulation linked to ASD.
In contrast, other evidence shows Parabacteroides may have protective functions in maintaining gut health [7]. A key protective mechanism is anti-inflammatory immune modulation [38]. Parabacteroides distasonis (P. distasonis) produces secondary bile acids that inhibit inflammatory T-cell differentiation and enhance regulatory T-cell activity through specific receptor pathways, shifting the immune response toward an anti-inflammatory state [38]. Another mechanism is immune homeostasis maintenance, as certain Parabacteroides species produce LPS variants that act as immune modulators, helping prevent excessive immune activation associated with neuroinflammation.
Differences in Parabacteroides findings across studies stem from cohort and methodological variability [7]. Regional dietary patterns, including fiber content and fermented food intake, strongly influence Parabacteroides abundance [30]. Additionally, health status, medication use, and antibiotic exposure vary across studies, adding confounding factors [7]. As a moderately low-abundance genus, detection of Parabacteroides is sensitive to sequencing depth, primer selection, and bioinformatics thresholds. These methodological limitations contribute to inconsistent reports of Parabacteroides being either enriched or depleted in ASD [7].
4.2. Lachnoclostridium
In our analyses, Lachnoclostridium was not a top feature in the general ASD abundance dataset (0 occurrences), but it appeared 4 times in the 16S rRNA-based dataset (LR = 1, RF = 1, GB = 2). This suggests that Lachnoclostridium's importance may depend on the dataset used and the feature selection approach, indicating its potential relevance under certain microbiome analysis conditions.
Some studies have found Lachnoclostridium, a genus in the Lachnospiraceae family, to be altered in children with ASD, especially those with gastrointestinal symptoms [16]. Elevated Lachnoclostridium abundance has been reported in certain ASD cohorts, indicating a possible association with the disorder [9]. One mechanism involves altered tryptophan metabolism, as increased Lachnoclostridium correlates with changes in tryptophan metabolites, suggesting disruption of serotonin pathways critical for neurodevelopment [39]. Another mechanism relates to metabolic dysfunction, as Lachnoclostridium abundance has been linked with altered fatty acid profiles in ASD children, potentially contributing to neurodevelopmental dysfunction through metabolic stress [9].
Conversely, other studies report decreased Lachnoclostridium in ASD, implying a protective role when present at normal levels [16]. In these cases, higher Lachnoclostridium abundance in neurotypical children may reflect a healthier gut ecosystem supporting neurodevelopment. One protective mechanism is beneficial SCFA production, as Lachnoclostridium species ferment dietary fibers into butyrate, an anti-inflammatory short-chain fatty acid that strengthens intestinal epithelial integrity and positively influences brain function [26]. A second mechanism involves antioxidant functions, as these bacteria contribute to metabolic processes that produce compounds reducing oxidative stress and protecting neuronal tissues [16].
Conflicting findings on Lachnoclostridium likely arise from population and dietary differences [9]. Different dietary patterns are associated with varying Lachnoclostridium levels across populations [16]. Technical factors also influence results, as gut microbiota composition evolves with age, and methodological differences in sequencing platforms, primer selection, and sample type can alter detection accuracy [39]. Additionally, confounding factors such as gastrointestinal symptoms or medication use, both common in ASD, may independently affect Lachnoclostridium abundance [9]. These factors contribute to reports of both increases and decreases in this genus across studies.
5. Limitations
Major gaps remain in understanding the role of the microbiota in ASD. Causality is unclear: it is not known whether gut dysbiosis contributes to ASD pathogenesis or is instead a consequence of ASD-related factors (such as restricted diets, selective eating, or genetic influences). Findings on specific microbial taxa have been inconsistent across studies and populations. In fact, gut microbiome studies in ASD rarely agree on the same set of differentially abundant bacteria. Differences in sequencing methods, dietary habits, and cohort demographics (including the use of neurotypical versus sibling controls) likely contribute to these inconsistencies. Another open question is the role of low-abundance or previously under-recognized microbes (including anaerobes, fungi, and bacteriophages) in ASD. Most studies to date focus on common bacterial taxa, yet recent machine-learning analyses have pointed to less prominent genera (such as Turicibacter or Catenibacterium) as potential ASD biomarkers.To capture the complex biology, researchers are increasingly employing multi-omics and integrative approaches. Emerging studies combine 16S rRNA gene sequencing with metagenomics, metabolomics, and host transcriptomics to identify functional pathways linking the microbiome to host neurobiology [6]. For example, a 2023 multi-cohort analysis found that ASD-associated microbiota changes (in genera like Bifidobacterium, Prevotella, and Desulfovibrio) correlated with altered microbial metabolism of amino acids and fatty acids as well as with differences in host brain gene expression and inflammation profiles [6]. Advanced computational models have also shown promise in classifying ASD versus neurotypical status based on gut microbial profiles, though with moderate accuracy (area-under-curve ~75-80%). These approaches underscore that the gut microbiome is strongly associated with ASD, but also highlight its complexity. Going forward, longitudinal studies and controlled trials (e.g. dietary or microbiota-targeted interventions) are needed to determine if microbiome changes can causally influence neurodevelopmental outcomes in ASD.
6. Conclusion
In conclusion, this study demonstrates that children with ASD harbor a distinct gut microbiome profile compared to neurotypical peers, and that these differences can be leveraged for predictive modeling. Across two complementary datasets, ASD gut samples showed altered diversity and composition—for instance, higher relative abundances of certain genera (e.g., Prevotella, Bacteroides) alongside a reduction in beneficial microbes like Bifidobacterium, indicative of dysbiosis [6, 25]. Using these microbial features, supervised classifiers were able to distinguish ASD cases from controls with high accuracy (exceeding 80% and an AUROC ~0.9 in cross-validation), underscoring the robust signal inherent in the gut microbiome. Notably, Prevotella emerged as a key discriminative genus, consistently selected by multiple models, appearing 16 times out of 60 different genera being abundant across the three models in both datasets, in line with reports of its elevated levels in ASD cohorts [25]. Likewise, an overrepresentation of pro-inflammatory or opportunistic taxa (e.g., certain Clostridia and Parabacteroides) and a loss of neuroprotective, short-chain fatty acid producers in ASD further support a pro-inflammatory gut milieu in the disorder [7]. Together, these findings underscore the involvement of the microbiota–gut–brain axis in ASD pathophysiology, suggesting that gut microbial shifts may influence neurodevelopmental outcomes and behavioral symptoms in affected children.
Looking ahead, future studies should validate these candidate microbial biomarkers in larger, diverse cohorts and investigate the causal mechanisms linking gut microbes to ASD. Controlled intervention trials modulating the microbiome are especially warranted. For example, transplanting beneficial bacteria or whole microbiota has shown promise—an open-label fecal microbiota transfer therapy yielded sustained improvements in gastrointestinal and autism symptoms [19]—and a recent probiotic trial using Bacteroides fragilis reported significant and safe improvements in abnormal behavior and gastrointestinal symptoms in children with ASD [36]. Such efforts, alongside longitudinal and multi-omics approaches, will be crucial to confirm whether correcting dysbiosis can mitigate core ASD symptoms and to identify novel microbiome-targeted therapeutics.
References
[1]. Lord, C., Elsabbagh, M., Baird, G., & Veenstra-Vanderweele, J. (2020). Autism spectrum disorder.The Lancet, 392(10146), 508-520. https: //doi.org/10.1016/S0140-6736(18)31129-2
[2]. American Psychiatric Association. (2013). Diagnostic and statistical manual of mental disorders (5th ed.). American Psychiatric Publishing. https: //doi.org/10.1176/appi.books.9780890425596
[3]. Zeidan, J., Fombonne, E., Scorah, J., Ibrahim, A., Durkin, M. S., Saxena, S., Yusuf, A., Shih, A., & Elsabbagh, M. (2022). Global prevalence of autism: A systematic review update.Autism Research, 15(5), 778-790. https: //doi.org/10.1002/aur.2696
[4]. Maenner, M. J., Shaw, K. A., Bakian, A. V., Bilder, D. A., Durkin, M. S., Esler, A., Furnier, S. M., Hallas, L., Hall-Lande, J., Hudson, A., Hughes, M. M., Patrick, M., Pierce, K., Poynter, J. N., Salinas, A., Shenouda, J., Vehorn, A., Warren, Z., Constantino, J. N., ... Cogswell, M. E. (2023). Prevalence and characteristics of autism spectrum disorder among children aged 8 years—Autism and developmental disabilities monitoring network, 11 sites, United States, 2020.MMWR Surveillance Summaries, 72(2), 1-14. https: //www.cdc.gov/mmwr/volumes/72/ss/ss7202a1.htm
[5]. Shaw, K. A., Bilder, D. A., Maenner, M. J., Bakian, A. V., Durkin, M. S., Fitzgerald, R. T., Furnier, S. M., Hughes, M. M., Esler, A., Pettygrove, S., Salinas, A., Shenouda, J., Zahorodny, W., Cogswell, M. E., & DiRienzo, M. (2025). Prevalence and early identification of autism spectrum disorder among children aged 4 and 8 years—Autism and developmental disabilities monitoring network, 16 sites, United States, 2022.MMWR Surveillance Summaries, 74(2), 1-26. https: //www.cdc.gov/mmwr/volumes/74/ss/ss7402a1.htm
[6]. Morton, J. T., Jin, D. M., Mills, R. H., Shao, Y., Rahman, G., McDonald, D., Zhu, Q., Balaban, M., Jiang, Y., Cantrell, K., Gonzalez, A., Carmel, J., Frankiensztajn, L. M., Shortt, E., Hendren, R. L., Dorsey, E. A., Garfunkel, L. C., Carlson, M., Neubauer, L. A., ... Knight, R. (2023). Multi-level analysis of the gut–brain axis shows autism spectrum disorder-associated molecular and microbial profiles.Nature Neuroscience, 26(7), 1208-1217. https: //www.nature.com/articles/s41593-023-01361-0
[7]. Iglesias-Vázquez, L., Van Ginkel Riba, G., Arija, V., & Canals, J. (2020). Composition of gut microbiota in children with autism spectrum disorder: A systematic review and meta-analysis.Nutrients, 12(3), 792. https: //doi.org/10.3390/nu12030792
[8]. Xu, M., Xu, X., Li, J., & Li, F. (2019). Association between gut microbiota and autism spectrum disorder: A systematic review and meta-analysis.Frontiers in Psychiatry, 10, 473. https: //doi.org/10.3389/fpsyt.2019.00473
[9]. Dan, Z., Mao, X., Liu, Q., Guo, M., Zhuang, Y., Liu, Z., Chen, K., Chen, J., Xu, R., Tang, J., Qin, L., Xu, Z., Zhu, Y., Liu, X., Tang, W., Liu, L., Wang, X., Wang, J., Zhao, L., ... Xu, R. (2020). Altered gut microbial profile is associated with abnormal metabolism activity of Autism Spectrum Disorder.Gut Microbes, 11(5), 1246-1267. https: //doi.org/10.1080/19490976.2020.1747329
[10]. Strati, F., Cavalieri, D., Albanese, D., De Felice, C., Donati, C., Hayek, J., Jousson, O., Leoncini, S., Renzi, D., Calabrò, A., & De Filippo, C. (2017). New evidences on the altered gut microbiota in autism spectrum disorders.Microbiome, 5(1), 24. https: //doi.org/10.1186/s40168-017-0242-1
[11]. McElhanon, B. O., McCracken, C., Karpen, S., & Sharp, W. G. (2014). Gastrointestinal symptoms in autism spectrum disorder: A meta-analysis.Pediatrics, 133(5), 872-883. https: //doi.org/10.1542/peds.2013-3995
[12]. Holingue, C., Newill, C., Lee, L. C., Pasricha, P. J., & Daniele Fallin, M. (2017). Gastrointestinal symptoms in autism spectrum disorder: A review of the literature on ascertainment and prevalence.Autism Research, 11(1), 24-36. https: //doi.org/10.1002/aur.1854
[13]. Cryan, J. F., O'Riordan, K. J., Cowan, C. S., Sandhu, K. V., Bastiaanssen, T. F., Boehme, M., Codagnone, M. G., Cussotto, S., Fulling, C., Golubeva, A. V., Guzzetta, K. E., Jaggar, M., Long‐Smith, C. M., Lyte, J. M., Martin, J. A., Molinero‐Perez, A., Moloney, G., Morelli, E., Morillas, E., ... Dinan, T. G. (2019). The microbiota-gut-brain axis.Physiological Reviews, 99(4), 1877-2013. https: //doi.org/10.1152/physrev.00018.2018
[14]. Mayer, E. A., Nance, K., & Chen, S. (2022). The gut–brain axis.Annual Review of Medicine, 73, 439-453. https: //doi.org/10.1146/annurev-med-042320-014032
[15]. Vuong, H. E., & Hsiao, E. Y. (2017). Emerging roles for the gut microbiome in autism spectrum disorder.Biological Psychiatry, 81(5), 411-423. https: //doi.org/10.1016/j.biopsych.2016.08.024
[16]. Wang, L., Christophersen, C. T., Sorich, M. J., Gerber, J. P., Angley, M. T., & Conlon, M. A. (2013). Increased abundance of Sutterella spp. and Ruminococcus torques in feces of children with autism spectrum disorder.Molecular Autism, 4(1), 42. https: //doi.org/10.1186/2040-2392-4-42
[17]. Stilling, R. M., Dinan, T. G., & Cryan, J. F. (2014). Microbial genes, brain & behaviour–epigenetic regulation of the gut–brain axis.Genes, Brain and Behavior, 13(1), 69-86. https: //doi.org/10.1111/gbb.12109
[18]. Ma, B., Liang, J., Dai, M., Wang, J., Luo, J., Zhang, Z., & Liu, J. (2019). Altered gut microbiota in Chinese children with autism spectrum disorders.Frontiers in Cellular and Infection Microbiology, 9, 40. https: //doi.org/10.3389/fcimb.2019.00040
[19]. Liu, S., Li, E., Sun, Z., Fu, D., Duan, G., Jiang, M., Yu, Y., Mei, L., Yang, P., Tang, Y., Zheng, S., Liang, T., Zhao, J., Jia, L., & Jin, M. (2019). Altered gut microbiota and short chain fatty acids in Chinese children with autism spectrum disorder.Scientific Reports, 9(1), 287. https: //doi.org/10.1038/s41598-018-36430-z
[20]. Zhang, M., Ma, W., Zhang, J., He, Y., & Wang, J. (2018). Analysis of gut microbiota profiles and microbe-disease associations in children with autism spectrum disorders in China.Scientific Reports, 8(1), 13981. https: //doi.org/10.1038/s41598-018-32219-2
[21]. Kang, D. W., Adams, J. B., Gregory, A. C., Borody, T., Chittick, L., Fasano, A., Khoruts, A., Geis, E., Maldonado, J., McDonough-Means, S., Pollard, E. L., Roux, S., Sadowsky, M. J., Lipson, K. S., Sullivan, M. B., Caporaso, J. G., & Krajmalnik-Brown, R. (2017). Microbiota Transfer Therapy alters gut ecosystem and improves gastrointestinal and autism symptoms: an open-label study.Microbiome, 5(1), 10. https: //doi.org/10.1186/s40168-016-0225-7
[22]. Finegold, S. M., Dowd, S. E., Gontcharova, V., Liu, C., Henley, K. E., Wolcott, R. D., Youn, E., Summanen, P. H., Granpeesheh, D., Dixon, D., Liu, M., Molitoris, D. R., & Green III, J. A. (2010). Pyrosequencing study of fecal microflora of autistic and control children.Anaerobe, 16(4), 444-453. https: //doi.org/10.1016/j.anaerobe.2010.06.008
[23]. Adams, J. B., Johansen, L. J., Powell, L. D., Quig, D., & Rubin, R. A. (2011). Gastrointestinal flora and gastrointestinal status in children with autism–comparisons to typical children and correlation with autism severity.BMC Gastroenterology, 11(1), 22. https: //doi.org/10.1186/1471-230X-11-22
[24]. Coretti, L., Paparo, L., Riccio, M. P., Amato, F., Cuomo, M., Natale, A., Klain, M., Costacurta, M., Nocerino, R., Perna, F., Greco, L., Gilbert, J. A., & Bravaccio, C. (2018). Gut microbiota features in young children with autism spectrum disorders.Frontiers in Microbiology, 9, 3146. https: //doi.org/10.3389/fmicb.2018.03146
[25]. Niu, X., Liu, Z., Yang, J., Gong, J., Chen, X., Cao, Q., Li, Z., Ran, R., & Li, T. (2023). Machine learning algorithms applied to predict autism spectrum disorder based on gut microbiome composition.Biomedicines, 11(10), 2633. https: //doi.org/10.3390/biomedicines11102633
[26]. Iglesias-Vázquez, L., Canals, J., Ghose, S., Mechó-Lleó, G., Díez-Ahijado, S., Voltas, N., & Arija, V. (2024). A robust microbiome signature for autism spectrum disorder across different studies using machine learning.Scientific Reports, 14(1), 403. https: //doi.org/10.1038/s41598-023-50601-7
[27]. Zou, R., Xu, F., Wang, Y., Duan, M., Guo, M., Zhang, Q., ... & Zheng, H. (2020). Changes in the gut microbiota of children with autism spectrum disorder.Autism Research, 13(9), 1614-1625. https: //doi.org/10.1002/aur.2358
[28]. Srikantha, P., & Mohajeri, M. H. (2019). The possible role of the microbiota-gut-brain-axis in autism spectrum disorder.International Journal of Molecular Sciences, 20(9), 2115. https: //doi.org/10.3390/ijms20092115
[29]. MacFabe, D. F., Cain, D. P., Rodriguez-Capote, K., Franklin, A. E., Hoffman, J. E., Boon, F., ... & Ossenkopp, K. P. (2007). Neurobiological effects of intraventricular propionic acid in rats: Possible role of short chain fatty acids on the pathogenesis and characteristics of autism spectrum disorders.Behavioural Brain Research, 176(1), 149-169. https: //doi.org/10.1016/j.bbr.2006.07.025
[30]. Kang, D. W., Park, J. G., Ilhan, Z. E., Wallstrom, G., Labaer, J., Adams, J. B., & Krajmalnik-Brown, R. (2013). Reduced incidence of Prevotella and other fermenters in intestinal microflora of autistic children.PLoS One, 8(7), e68322. https: //doi.org/10.1371/journal.pone.0068322
[31]. Precup, G., & Vodnar, D. C. (2019). Gut Prevotella as a possible biomarker of diet and its eubiotic versus dysbiotic roles: A comprehensive literature review.British Journal of Nutrition, 122(2), 131-140. https: //doi.org/10.1017/S0007114519000680
[32]. Gorvitovskaia, A., Holmes, S. P., & Huse, S. M. (2016). Interpreting Prevotella and Bacteroides as biomarkers of diet and lifestyle.Microbiome, 4, 15. https: //doi.org/10.1186/s40168-016-0160-7
[33]. Abdelli, L. S., Samsam, A., & Naser, S. A. (2019). Propionic acid induces gliosis and neuroinflammation through modulation of PTEN/AKT pathway in autism spectrum disorder.Scientific Reports, 9(1), 8824. https: //doi.org/10.1038/s41598-019-45348-z
[34]. Hsiao, E. Y., McBride, S. W., Hsien, S., Sharon, G., Hyde, E. R., McCue, T., ... & Mazmanian, S. K. (2013). Microbiota modulate behavioral and physiological abnormalities associated with neurodevelopmental disorders.Cell, 155(7), 1451-1463. https: //doi.org/10.1016/j.cell.2013.11.024
[35]. Mazmanian, S. K., Round, J. L., & Kasper, D. L. (2008). A microbial symbiosis factor prevents inflammatory disease.Nature, 453(7195), 620-625. https: //doi.org/10.1038/nature07008
[36]. Lin, C.-h., Zeng, T., Lu, C.-w., Li, D.-y., Liu, Y.-y., Li, B.-m., Chen, S.-q., & Deng, Y.-h. (2024). Efficacy and safety of Bacteroides fragilis BF839 for pediatric autism spectrum disorder: A randomized clinical trial.Frontiers in Nutrition, 11. https: //doi.org/10.3389/fnut.2024.1447059
[37]. Fernández-Veledo, S., & Vendrell, J. (2019). Gut microbiota-derived succinate: Friend or foe in human metabolic diseases?Reviews in Endocrine and Metabolic Disorders, 20(4), 439-447. https: //doi.org/10.1007/s11154-019-09513-z
[38]. Song, X., Sun, X., Oh, S. F., Wu, M., Zhang, Y., Zheng, W., ... & Kasper, D. L. (2020). Microbial bile acid metabolites modulate gut RORγ+ regulatory T cell homeostasis.Nature, 577(7790), 410-415. https: //doi.org/10.1038/s41586-019-1865-0
[39]. Gao, K., Mu, C.-L., Farzi, A., & Zhu, W. (2020). Tryptophan metabolism: A link between the gut microbiota and brain.Advances in Nutrition, 11(3), 709–723. https: //doi.org/10.1093/advances/nmz127
Cite this article
Li,Y. (2025). Convergent gut microbiome signatures of Autism Spectrum Disorder across independent pediatric cohort. Journal of Food Science, Nutrition and Health,4(2),80-98.
Data availability
The datasets used and/or analyzed during the current study will be available from the authors upon reasonable request.
Disclaimer/Publisher's Note
The statements, opinions and data contained in all publications are solely those of the individual author(s) and contributor(s) and not of EWA Publishing and/or the editor(s). EWA Publishing and/or the editor(s) disclaim responsibility for any injury to people or property resulting from any ideas, methods, instructions or products referred to in the content.
About volume
Journal:Journal of Food Science, Nutrition and Health
© 2024 by the author(s). Licensee EWA Publishing, Oxford, UK. This article is an open access article distributed under the terms and
conditions of the Creative Commons Attribution (CC BY) license. Authors who
publish this series agree to the following terms:
1. Authors retain copyright and grant the series right of first publication with the work simultaneously licensed under a Creative Commons
Attribution License that allows others to share the work with an acknowledgment of the work's authorship and initial publication in this
series.
2. Authors are able to enter into separate, additional contractual arrangements for the non-exclusive distribution of the series's published
version of the work (e.g., post it to an institutional repository or publish it in a book), with an acknowledgment of its initial
publication in this series.
3. Authors are permitted and encouraged to post their work online (e.g., in institutional repositories or on their website) prior to and
during the submission process, as it can lead to productive exchanges, as well as earlier and greater citation of published work (See
Open access policy for details).
References
[1]. Lord, C., Elsabbagh, M., Baird, G., & Veenstra-Vanderweele, J. (2020). Autism spectrum disorder.The Lancet, 392(10146), 508-520. https: //doi.org/10.1016/S0140-6736(18)31129-2
[2]. American Psychiatric Association. (2013). Diagnostic and statistical manual of mental disorders (5th ed.). American Psychiatric Publishing. https: //doi.org/10.1176/appi.books.9780890425596
[3]. Zeidan, J., Fombonne, E., Scorah, J., Ibrahim, A., Durkin, M. S., Saxena, S., Yusuf, A., Shih, A., & Elsabbagh, M. (2022). Global prevalence of autism: A systematic review update.Autism Research, 15(5), 778-790. https: //doi.org/10.1002/aur.2696
[4]. Maenner, M. J., Shaw, K. A., Bakian, A. V., Bilder, D. A., Durkin, M. S., Esler, A., Furnier, S. M., Hallas, L., Hall-Lande, J., Hudson, A., Hughes, M. M., Patrick, M., Pierce, K., Poynter, J. N., Salinas, A., Shenouda, J., Vehorn, A., Warren, Z., Constantino, J. N., ... Cogswell, M. E. (2023). Prevalence and characteristics of autism spectrum disorder among children aged 8 years—Autism and developmental disabilities monitoring network, 11 sites, United States, 2020.MMWR Surveillance Summaries, 72(2), 1-14. https: //www.cdc.gov/mmwr/volumes/72/ss/ss7202a1.htm
[5]. Shaw, K. A., Bilder, D. A., Maenner, M. J., Bakian, A. V., Durkin, M. S., Fitzgerald, R. T., Furnier, S. M., Hughes, M. M., Esler, A., Pettygrove, S., Salinas, A., Shenouda, J., Zahorodny, W., Cogswell, M. E., & DiRienzo, M. (2025). Prevalence and early identification of autism spectrum disorder among children aged 4 and 8 years—Autism and developmental disabilities monitoring network, 16 sites, United States, 2022.MMWR Surveillance Summaries, 74(2), 1-26. https: //www.cdc.gov/mmwr/volumes/74/ss/ss7402a1.htm
[6]. Morton, J. T., Jin, D. M., Mills, R. H., Shao, Y., Rahman, G., McDonald, D., Zhu, Q., Balaban, M., Jiang, Y., Cantrell, K., Gonzalez, A., Carmel, J., Frankiensztajn, L. M., Shortt, E., Hendren, R. L., Dorsey, E. A., Garfunkel, L. C., Carlson, M., Neubauer, L. A., ... Knight, R. (2023). Multi-level analysis of the gut–brain axis shows autism spectrum disorder-associated molecular and microbial profiles.Nature Neuroscience, 26(7), 1208-1217. https: //www.nature.com/articles/s41593-023-01361-0
[7]. Iglesias-Vázquez, L., Van Ginkel Riba, G., Arija, V., & Canals, J. (2020). Composition of gut microbiota in children with autism spectrum disorder: A systematic review and meta-analysis.Nutrients, 12(3), 792. https: //doi.org/10.3390/nu12030792
[8]. Xu, M., Xu, X., Li, J., & Li, F. (2019). Association between gut microbiota and autism spectrum disorder: A systematic review and meta-analysis.Frontiers in Psychiatry, 10, 473. https: //doi.org/10.3389/fpsyt.2019.00473
[9]. Dan, Z., Mao, X., Liu, Q., Guo, M., Zhuang, Y., Liu, Z., Chen, K., Chen, J., Xu, R., Tang, J., Qin, L., Xu, Z., Zhu, Y., Liu, X., Tang, W., Liu, L., Wang, X., Wang, J., Zhao, L., ... Xu, R. (2020). Altered gut microbial profile is associated with abnormal metabolism activity of Autism Spectrum Disorder.Gut Microbes, 11(5), 1246-1267. https: //doi.org/10.1080/19490976.2020.1747329
[10]. Strati, F., Cavalieri, D., Albanese, D., De Felice, C., Donati, C., Hayek, J., Jousson, O., Leoncini, S., Renzi, D., Calabrò, A., & De Filippo, C. (2017). New evidences on the altered gut microbiota in autism spectrum disorders.Microbiome, 5(1), 24. https: //doi.org/10.1186/s40168-017-0242-1
[11]. McElhanon, B. O., McCracken, C., Karpen, S., & Sharp, W. G. (2014). Gastrointestinal symptoms in autism spectrum disorder: A meta-analysis.Pediatrics, 133(5), 872-883. https: //doi.org/10.1542/peds.2013-3995
[12]. Holingue, C., Newill, C., Lee, L. C., Pasricha, P. J., & Daniele Fallin, M. (2017). Gastrointestinal symptoms in autism spectrum disorder: A review of the literature on ascertainment and prevalence.Autism Research, 11(1), 24-36. https: //doi.org/10.1002/aur.1854
[13]. Cryan, J. F., O'Riordan, K. J., Cowan, C. S., Sandhu, K. V., Bastiaanssen, T. F., Boehme, M., Codagnone, M. G., Cussotto, S., Fulling, C., Golubeva, A. V., Guzzetta, K. E., Jaggar, M., Long‐Smith, C. M., Lyte, J. M., Martin, J. A., Molinero‐Perez, A., Moloney, G., Morelli, E., Morillas, E., ... Dinan, T. G. (2019). The microbiota-gut-brain axis.Physiological Reviews, 99(4), 1877-2013. https: //doi.org/10.1152/physrev.00018.2018
[14]. Mayer, E. A., Nance, K., & Chen, S. (2022). The gut–brain axis.Annual Review of Medicine, 73, 439-453. https: //doi.org/10.1146/annurev-med-042320-014032
[15]. Vuong, H. E., & Hsiao, E. Y. (2017). Emerging roles for the gut microbiome in autism spectrum disorder.Biological Psychiatry, 81(5), 411-423. https: //doi.org/10.1016/j.biopsych.2016.08.024
[16]. Wang, L., Christophersen, C. T., Sorich, M. J., Gerber, J. P., Angley, M. T., & Conlon, M. A. (2013). Increased abundance of Sutterella spp. and Ruminococcus torques in feces of children with autism spectrum disorder.Molecular Autism, 4(1), 42. https: //doi.org/10.1186/2040-2392-4-42
[17]. Stilling, R. M., Dinan, T. G., & Cryan, J. F. (2014). Microbial genes, brain & behaviour–epigenetic regulation of the gut–brain axis.Genes, Brain and Behavior, 13(1), 69-86. https: //doi.org/10.1111/gbb.12109
[18]. Ma, B., Liang, J., Dai, M., Wang, J., Luo, J., Zhang, Z., & Liu, J. (2019). Altered gut microbiota in Chinese children with autism spectrum disorders.Frontiers in Cellular and Infection Microbiology, 9, 40. https: //doi.org/10.3389/fcimb.2019.00040
[19]. Liu, S., Li, E., Sun, Z., Fu, D., Duan, G., Jiang, M., Yu, Y., Mei, L., Yang, P., Tang, Y., Zheng, S., Liang, T., Zhao, J., Jia, L., & Jin, M. (2019). Altered gut microbiota and short chain fatty acids in Chinese children with autism spectrum disorder.Scientific Reports, 9(1), 287. https: //doi.org/10.1038/s41598-018-36430-z
[20]. Zhang, M., Ma, W., Zhang, J., He, Y., & Wang, J. (2018). Analysis of gut microbiota profiles and microbe-disease associations in children with autism spectrum disorders in China.Scientific Reports, 8(1), 13981. https: //doi.org/10.1038/s41598-018-32219-2
[21]. Kang, D. W., Adams, J. B., Gregory, A. C., Borody, T., Chittick, L., Fasano, A., Khoruts, A., Geis, E., Maldonado, J., McDonough-Means, S., Pollard, E. L., Roux, S., Sadowsky, M. J., Lipson, K. S., Sullivan, M. B., Caporaso, J. G., & Krajmalnik-Brown, R. (2017). Microbiota Transfer Therapy alters gut ecosystem and improves gastrointestinal and autism symptoms: an open-label study.Microbiome, 5(1), 10. https: //doi.org/10.1186/s40168-016-0225-7
[22]. Finegold, S. M., Dowd, S. E., Gontcharova, V., Liu, C., Henley, K. E., Wolcott, R. D., Youn, E., Summanen, P. H., Granpeesheh, D., Dixon, D., Liu, M., Molitoris, D. R., & Green III, J. A. (2010). Pyrosequencing study of fecal microflora of autistic and control children.Anaerobe, 16(4), 444-453. https: //doi.org/10.1016/j.anaerobe.2010.06.008
[23]. Adams, J. B., Johansen, L. J., Powell, L. D., Quig, D., & Rubin, R. A. (2011). Gastrointestinal flora and gastrointestinal status in children with autism–comparisons to typical children and correlation with autism severity.BMC Gastroenterology, 11(1), 22. https: //doi.org/10.1186/1471-230X-11-22
[24]. Coretti, L., Paparo, L., Riccio, M. P., Amato, F., Cuomo, M., Natale, A., Klain, M., Costacurta, M., Nocerino, R., Perna, F., Greco, L., Gilbert, J. A., & Bravaccio, C. (2018). Gut microbiota features in young children with autism spectrum disorders.Frontiers in Microbiology, 9, 3146. https: //doi.org/10.3389/fmicb.2018.03146
[25]. Niu, X., Liu, Z., Yang, J., Gong, J., Chen, X., Cao, Q., Li, Z., Ran, R., & Li, T. (2023). Machine learning algorithms applied to predict autism spectrum disorder based on gut microbiome composition.Biomedicines, 11(10), 2633. https: //doi.org/10.3390/biomedicines11102633
[26]. Iglesias-Vázquez, L., Canals, J., Ghose, S., Mechó-Lleó, G., Díez-Ahijado, S., Voltas, N., & Arija, V. (2024). A robust microbiome signature for autism spectrum disorder across different studies using machine learning.Scientific Reports, 14(1), 403. https: //doi.org/10.1038/s41598-023-50601-7
[27]. Zou, R., Xu, F., Wang, Y., Duan, M., Guo, M., Zhang, Q., ... & Zheng, H. (2020). Changes in the gut microbiota of children with autism spectrum disorder.Autism Research, 13(9), 1614-1625. https: //doi.org/10.1002/aur.2358
[28]. Srikantha, P., & Mohajeri, M. H. (2019). The possible role of the microbiota-gut-brain-axis in autism spectrum disorder.International Journal of Molecular Sciences, 20(9), 2115. https: //doi.org/10.3390/ijms20092115
[29]. MacFabe, D. F., Cain, D. P., Rodriguez-Capote, K., Franklin, A. E., Hoffman, J. E., Boon, F., ... & Ossenkopp, K. P. (2007). Neurobiological effects of intraventricular propionic acid in rats: Possible role of short chain fatty acids on the pathogenesis and characteristics of autism spectrum disorders.Behavioural Brain Research, 176(1), 149-169. https: //doi.org/10.1016/j.bbr.2006.07.025
[30]. Kang, D. W., Park, J. G., Ilhan, Z. E., Wallstrom, G., Labaer, J., Adams, J. B., & Krajmalnik-Brown, R. (2013). Reduced incidence of Prevotella and other fermenters in intestinal microflora of autistic children.PLoS One, 8(7), e68322. https: //doi.org/10.1371/journal.pone.0068322
[31]. Precup, G., & Vodnar, D. C. (2019). Gut Prevotella as a possible biomarker of diet and its eubiotic versus dysbiotic roles: A comprehensive literature review.British Journal of Nutrition, 122(2), 131-140. https: //doi.org/10.1017/S0007114519000680
[32]. Gorvitovskaia, A., Holmes, S. P., & Huse, S. M. (2016). Interpreting Prevotella and Bacteroides as biomarkers of diet and lifestyle.Microbiome, 4, 15. https: //doi.org/10.1186/s40168-016-0160-7
[33]. Abdelli, L. S., Samsam, A., & Naser, S. A. (2019). Propionic acid induces gliosis and neuroinflammation through modulation of PTEN/AKT pathway in autism spectrum disorder.Scientific Reports, 9(1), 8824. https: //doi.org/10.1038/s41598-019-45348-z
[34]. Hsiao, E. Y., McBride, S. W., Hsien, S., Sharon, G., Hyde, E. R., McCue, T., ... & Mazmanian, S. K. (2013). Microbiota modulate behavioral and physiological abnormalities associated with neurodevelopmental disorders.Cell, 155(7), 1451-1463. https: //doi.org/10.1016/j.cell.2013.11.024
[35]. Mazmanian, S. K., Round, J. L., & Kasper, D. L. (2008). A microbial symbiosis factor prevents inflammatory disease.Nature, 453(7195), 620-625. https: //doi.org/10.1038/nature07008
[36]. Lin, C.-h., Zeng, T., Lu, C.-w., Li, D.-y., Liu, Y.-y., Li, B.-m., Chen, S.-q., & Deng, Y.-h. (2024). Efficacy and safety of Bacteroides fragilis BF839 for pediatric autism spectrum disorder: A randomized clinical trial.Frontiers in Nutrition, 11. https: //doi.org/10.3389/fnut.2024.1447059
[37]. Fernández-Veledo, S., & Vendrell, J. (2019). Gut microbiota-derived succinate: Friend or foe in human metabolic diseases?Reviews in Endocrine and Metabolic Disorders, 20(4), 439-447. https: //doi.org/10.1007/s11154-019-09513-z
[38]. Song, X., Sun, X., Oh, S. F., Wu, M., Zhang, Y., Zheng, W., ... & Kasper, D. L. (2020). Microbial bile acid metabolites modulate gut RORγ+ regulatory T cell homeostasis.Nature, 577(7790), 410-415. https: //doi.org/10.1038/s41586-019-1865-0
[39]. Gao, K., Mu, C.-L., Farzi, A., & Zhu, W. (2020). Tryptophan metabolism: A link between the gut microbiota and brain.Advances in Nutrition, 11(3), 709–723. https: //doi.org/10.1093/advances/nmz127