


1. Introduction
Lung cancer exhibits the highest global incidence and mortality, causing 2.481 million deaths in 2022. In China, it remains the most commonly diagnosed malignancy and leading cause of cancer-related mortality [1].Histologically, lung cancer is categorized into non-small cell lung cancer (NSCLC) and small cell lung cancer (SCLC). NSCLC constitutes 80-85% of lung cancer cases and has slower progression than SCLC [2].Early precise diagnosis is therefore critical for prognosis improvement.
Current clinical practice utilizes X-ray and CT for initial screening, but definitive diagnosis necessitates invasive biopsy with histological examination [3].This approach carries risks, is time-consuming, and suffers from subjectivity and inefficiency, potentially delaying treatment. While Computer-Aided Diagnosis (CAD), particularly deep learning, offers promise in medical image analysis, significant challenges persist in lung cancer recognition [4]. Convolutional Neural Networks (CNNs) excel at local feature extraction but inadequately model global dependencies crucial for complex lung textures [5].Transformers effectively capture long-range dependencies but incur high computational costs, especially for high-resolution medical images, and require extensive annotated data, limiting clinical deployment.
To address these limitations, this work proposes leveraging a hybrid Convolutional neural network and transformers architecture (CMT) [6].CMT synergistically integrates CNN’s local perceptual strengths with the Transformer’s global modeling capacity via self-attention. This integration enhances feature representation for lesion identification. Crucially, CMT mitigates the Transformer’s computational burden through integrated convolutions, achieving comparable accuracy with fewer parameters and greater efficiency, accelerating recognition. Furthermore, CMT demonstrates superior data efficiency. Its multi-scale hierarchical feature extraction enables robust performance even with limited, challenging-to-annotate medical datasets, enhancing model generalizability compared to pure Transformer or CNN approaches.
2. Related work
Significant progress has occurred in applying medical image recognition to lung cancer diagnosis, primarily through two methodological paradigms: traditional radiomics-based feature engineering and deep-learning-based end-to-end modeling. Radiomics, formalized by Lambin et al. (2012) [7], utilizes high-throughput extraction of handcrafted features (texture, shape, intensity) from medical images. Its standardized workflow encompasses image preprocessing, lesion segmentation, feature extraction, and modeling analysis [8]. For instance, Zhu et al. (2024) employed Lasso regression to select 19 key texture features from 300 candidates, integrating these with clinical data via logistic regression to create a classifier for solitary pulmonary nodule malignancy, achieving >85% accuracy [9]. However, reliance on manually specified feature sets inherently limits the ability to capture complex spatial relationships within lesions, constraining generalizability and robustness.
Deep learning (DL) approaches emerged circa 2010 to overcome these limitations. Initial applications focused on classification tasks (e.g., breast cancer) using architectures like LeNet [10]. The success of AlexNet in ILSVRC 2012 spurred wider adoption of CNNs in medical imaging [11]. U-Net (2015) became a benchmark segmentation architecture via its symmetric encoder-decoder structure with skip connections, excelling in tasks involving MRI/CT data. Nevertheless, CNNs' constrained local receptive fields impede learning of long-range dependencies, hindering global structural representation.
The advent of Transformers, leveraging self-attention mechanisms, addressed global context modeling. TransUNet (Chen et al., 2021) pioneered integrating Transformers with U-Net, significantly enhancing global modeling and pixel-level segmentation accuracy [12]. Subsequently, Swin UNETR (Hatamizadeh et al., 2021) incorporated a Swin Transformer module utilizing local window-based self-attention to manage computational cost while maintaining superior context modeling, particularly effective for large medical images [13].Despite mitigating global modeling constraints, Transformers demand exceptionally high computational resources and vast annotated datasets—requirements often impractical given the scarcity of annotated medical imaging data.
Hybrid architectures reconciling CNN and Transformer strengths have consequently gained prominence. The CMT model exemplifies this trend, employing a hierarchical structure: convolutional layers for efficient local feature extraction precede Transformer modules capturing long-range dependencies and global structure. This synthesis optimizes the balance between feature extraction accuracy, computational efficiency, and generalization capability. Critically, its modular design enables adaptive processing across diverse image scales and spatial regions, proving advantageous in complex tasks like lung cancer detection. Unlike pure CNNs or Transformers, which typically compromise at least one aspect of computational efficiency, feature extraction power, or generalization, CMT achieves a favorable equilibrium. This balance renders it particularly suitable for medical applications with constrained computational resources or limited training data availability.
3. Method
The lung cancer recognition method proposed in this paper is based on the CMT model.By fusing the complementary strengths of convolutional neural networks(CNNs)and vision Transformers,CMT achieves synergistic optimization of local feature extraction and global context modeling for lung cancer images. This section details the core architectural design,feature fusion mechanism,and key mathematical formulations.
3.1. CMT model architecture
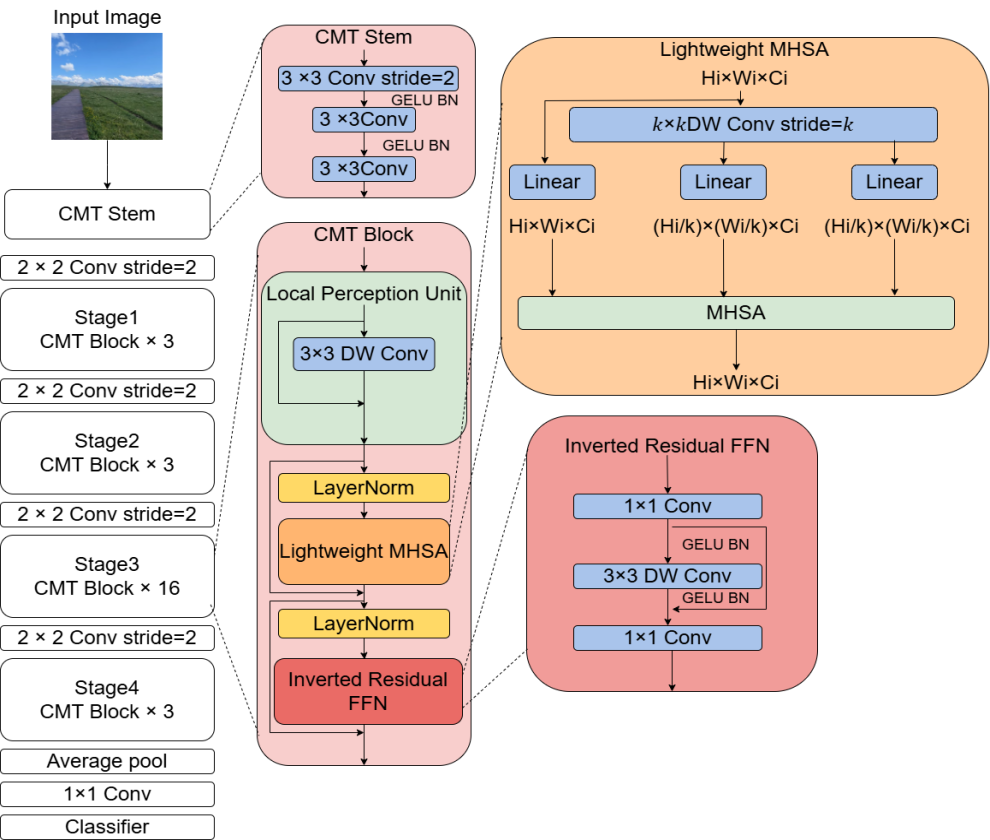
CMT adopts a hierarchical hybrid design (as shown in Fig. 1). This design ingeniously integrates the advantage of CNNs in extracting local features with the capability of Transformers in capturing global dependencies. The overall architecture consists of two parts: a Convolutional Feature Encoder and a Transformer Feature Decoder. The input image is first processed by the convolutional encoder to extract multi-scale local features. Subsequently, a Spatial Reorganization module transforms the feature maps into a sequence of embedding vectors, which are then input into the Transformer decoder for global dependency modeling. The specific workflow is as follows:
1.Convolutional Feature EncoderThe encoder comprises 4 convolutional stages (Stage 1 - 4), each containing several convolutional blocks. To balance computational efficiency and feature representation capability, its design incorporates depthwise separable convolution and residual connections .
Let
The depthwise separable convolution operation
where
The output of the
The addition operation
Through progressive downsampling across stages, assuming the input image size is
2.Spatial Reorganization ModuleTo adapt to the sequential processing paradigm of the Transformer, the three-dimensional feature map
where
Mathematically, for each element
This process preserves the spatial positional information of the feature map because the relative positional relationships of elements are maintained during the transformation to a sequence. Furthermore, by adjusting the dimensionality of the projection matrix
3.Transformer Feature DecoderThe decoder consists of stacked Transformer layers. Each layer contains a Multi-Head Self-Attention (MHSA) mechanism and a Locally-Enhanced Feed-Forward Network (LeFF).
Multi-Head Self-Attention (MHSA)The self-attention mechanism captures global contextual dependencies by computing correlation weights between sequence elements. Let the input sequence be
where
The self-attention computation is expressed as:
where
The multi-head mechanism splits the input into
where
The final multi-head self-attention output is:
where
Locally-Enhanced Feed-Forward Network (LeFF)To prevent pure Transformers from overlooking local details, the LeFF module introduces a depthwise convolution operation to enhance local features. Let the input be
where
The MLP can be represented as:
where
The depthwise convolution operation
3.2. Multi-scale feature fusion
In medical images of lung cancer, lesions often exhibit multi-scale characteristics. Lesions of different sizes and morphologies may coexist within an image. Small cancerous regions may be crucial indicators of early-stage lung cancer, while larger lesions may represent more advanced disease progression. To accurately identify and classify these lesions with diverse scale features, the CMT model introduces a Cross-Stage Feature Aggregation (CSFA) strategy during the decoding phase.
Feature UpsamplingThe feature maps output by the convolutional encoder at different stages possess varying sizes and semantic information. Feature maps from shallower stages retain more image details, such as edges and textures of small lesions in lung images. Feature maps from deeper stages contain higher-level semantic information, such as the overall morphology and structure of lung cancer lesions. To effectively fuse these features from different stages, the output feature maps from each convolutional encoder stage are first upsampled to a uniform size using bilinear interpolation.
Bilinear interpolation is a common image interpolation method that calculates the value of an interpolated point by performing a weighted average of its four surrounding pixels. During feature map upsampling, bilinear interpolation preserves the original information as much as possible while increasing the feature map size. Assuming the feature map output by the
Feature Fusion OperationAfter upsampling the convolutional encoder outputs to a uniform size, these upsampled feature maps are concatenated with the Transformer decoder's output feature map along the channel dimension. Channel concatenation connects different feature maps along the channel axis. Assuming the Transformer decoder's output feature map is
While the concatenated feature map
Advantages of the Fusion StrategyThe Cross-Stage Feature Aggregation (CSFA) strategy combines complementary shallow detail features and deep semantic featuresThis fusion significantly boosts the model's sensitivity to small cancerous regions, improving lung cancer recognition and classification performance.Simultaneously, CSFA reduces computational complexity using 1×1 convolution while preserving multi-scale information, enhancing training and inference efficiency.
3.3. Optimization objective
In lung cancer recognition and classification tasks, the model's optimization objective must consider both classification accuracy and lesion localization precision. The CMT model proposed in this paper employs a weighted combination of Cross-Entropy Loss and Dice Loss as the optimization objective to simultaneously optimize classification accuracy and lesion region overlap.
1. Cross-Entropy Loss (CE Loss)
The Cross-Entropy Loss primarily measures the discrepancy between the predicted class probability distribution and the true label. For a multi-class problem with
The Cross-Entropy Loss function
where
For a batch of
where
2. Dice Loss
The Dice Loss measures the overlap between the predicted segmentation result and the ground truth mask. Let
where
The Dice Loss
Computationally, the prediction and ground truth mask can be represented as binary images, where pixel value 1 indicates the target region and 0 indicates background. Let
3. Weighted Combined Loss Function
To simultaneously optimize classification accuracy and lesion localization precision, we combine the Cross-Entropy Loss and Dice Loss using a weighted sum. Let
Here,
By jointly optimizing the Cross-Entropy Loss and Dice Loss, the model improves classification accuracy while ensuring precise lesion localization. During training, we update the model parameters by minimizing the loss function
Specifically, during backpropagation, the gradient of the loss function
Then, an optimization algorithm (e.g., Stochastic Gradient Descent, Adam) updates the model parameters based on this gradient:
where
3.4. Computational efficiency analysis
Compared to pure Transformer architectures like ViT, CMT significantly reduces the computational complexity of self-attention through pre-downsampling by the convolutional encoder. Assuming an input image size of H×W, the computational complexity of a standard ViT is O((HW)^2). In CMT, after convolutional encoding, the feature map size reduces to H/16×W/16, lowering the complexity to O((HW/256)^2 ). This represents a theoretical reduction in computation by approximately 256^2 times. This efficiency allows CMT to process high-resolution medical images effectively while maintaining global feature modeling capability.
This hybrid architecture, through the synergistic action of CNN's local perception and Transformer's global modeling, achieves a balance between accuracy and efficiency in lung cancer recognition tasks, providing reliable technical support for rapid clinical diagnosis.
4. Experiment and results
4.1. Experimental setup
Experiments in this paper utilized an NVIDIA RTX 4060 GPU, and the entire process of the model training and test was based on the Pytorch framework in Python language, and used batch size as 32, SGD optimizer was used to update the parameters with a momentum of 0.8, and learning rate set as 0.0001, all experiments were saved on wandb.
4.2. Datasets
In order to carry out better experiments and achieve the purpose of comparing results more clearly, the dataset is divided into a training set and a validation set. Stratify the two sets according to different factors, such as gender, smoking status, age ranges, and pneumonia types.
The presented work utilized 350 cases extracted from a hospital data set - 200 for the mutated-gene pneumonia group and 150 for the wild-type pneumonia group.
The training set contained 5,000 mutated gene images and 5,000 wild gene images. Data augmentation was performed using the image rotation technique as well as the flipping technique, making the total number of images in this data set 20,000.
The validation dataset used in this study was obtained from the publicly available NSCLC dataset provided by The Cancer Imaging Archive (TCIA). This dataset provides medical imaging data for non-small cell lung cancer (NSCLC), which is the focus of this study. The TCIA dataset comprises 211 patients: 43 patients were classified as mutated-gene type, 129 as wild-type, and 39 as unknown or not collected. The training and testing processes were performed on the hospital dataset, while validation was conducted on the TCIA dataset. Further detailed information regarding the datasets is presented in Table 1.
|
Item |
Training Dataset (n=350) |
Validation Dataset (n=211) |
|
Gender |
||
|
Male |
170 |
76 |
|
Female |
180 |
135 |
|
Smoking Status |
||
|
Yes |
256 |
163 |
|
No |
94 |
48 |
|
Age Range |
||
|
Min |
40 |
43 |
|
Max |
88 |
87 |
|
Median |
64 |
69 |
|
Pneumonia Type |
||
|
Mutated |
200 |
43 |
|
Wild-type |
150 |
129 |
|
Unknown/Not Collected |
0 |
39 |
[Note: The training dataset description mentions 350 cases but also 10,000 images (5k mutated + 5k wild) augmented to 20k. The table reflects the case counts per the header. The validation dataset uses patient counts from TCIA.]
4.3. Experimental results
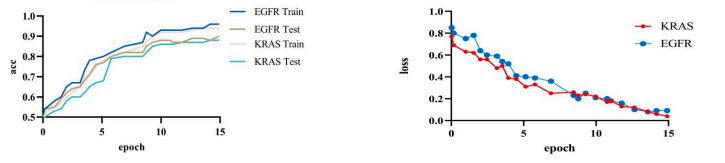
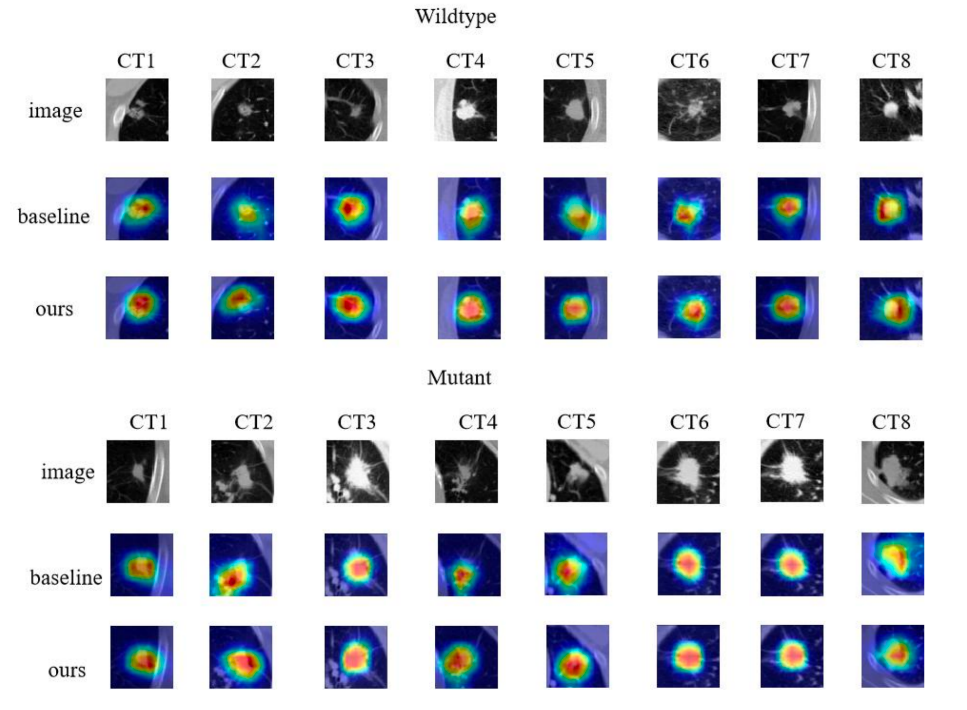
Based on the experiments, our model achieved an accuracy of 92.8% and a loss of 0.15%. We visualized our model and the original model,as shown in the figure2 and figure3.
5. Comparative work
This section presents a comparative analysis of the proposed CMT model with recent mainstream methods in the field of lung cancer identification on the public TCIA dataset. The comprehensive comparison results are shown in Table 2.
|
Ref. |
Method |
Feature |
Acc(%) |
|
Xiao [14] |
EfficientNet-V2 |
Deep features |
80.32 |
|
Wang [15] |
CNN |
Deep features |
75.62 |
|
Xiong[16] |
3D CNN |
Deep features + Clinical features |
75.43 |
|
Nair [17] |
Logistic regression |
Clinical features + Radiomics features |
79.53 |
|
Chen [18] |
Stacked deep model |
Deep features + Clinical features |
83.00 |
|
Silva [19] |
Unsupervised transfer learning model |
Deep features + Clinical features |
68.00 |
|
Zhao [20] |
Denseformer |
Deep features |
81.50 |
|
Wang [21] |
FAIS |
Deep features |
79.90 |
|
Yoon [22] |
Hyun |
Deep features |
78.3 |
|
Ours |
CMT |
Deep features |
92.8 |
The EfficientNet-V2 employs PET/CT imaging for predicting EGFR mutations, with an AUC value of 82.23%. Wang et al. developed an end-to-end deep learning approach with CT image input which was able to reach an AUC value of 81.25% when doing prediction of gene mutation. Xiong et al used a 3D-CNN model for predicting EGFR mutations in lung adenocarcinoma, and achieved an AUC of 82.91% if joined with clinical data, compared with 76.57% of the situations without clinical information, indicating that including clinical information may improve the performance of the network model. In addition, Nair et al. use Logistic Regression to select the best radiomics feature from Enhanced CT images, and achieve an AUC value of 83.92%; while Chen et al. built the stacked deep model to integrate PET/CT and clinical data for predicting EGFR mutations, and got the best AUC of 85%. Furthermore, Silva et al. applied a deep unsupervised transfer learning method to assess EGFR mutations, expanding the evaluation range to nodule region alone and obtaining an AUC of 68%, indicating that CMT is more accurate than recent mainstream methods in distinguishing whether EGFR mutations are present or not based on imaging features.
6. Conclusion
This study proposes a novel hybrid CMT model for lung cancer image recognition, synergistically integrating Convolutional Neural Networks (CNNs) in early layers for local feature extraction and Vision Transformers (ViTs) in later layers for long-range dependency modeling, significantly reducing computational costs compared to pure Transformer models through convolutional down-sampling.
References
[1]. Han B, Zheng R, Zeng H, et al. Cancer incidence and mortality in China, 2022 [J]. Journal of the National Cancer Center, 2024.
[2]. Oser M G, Niederst M J, Sequist L V, et al. Transformation from non-small-cell lung cancer to small-cell lung cancer: molecular drivers and cells of origin [J]. The Lancet Oncology, 2015.
[3]. YUSUKE YOSHIOKA, TAKESHI KATSUDA, TAKAHIRO OCHIYA. Extracellular vesicles and encapusulated miRNAs as emerging cancer biomarkers for novel liquid biopsy [J]. Japanese Journal of Clinical Oncology, 2018.
[4]. SHEN Z Q, CAO P, YANG J Z, et al. WS-LungNet: A two-stage weakly-supervised lung cancer detection and diagnosis network [J/OL]. Computers in Biology and Medicine, 2023, 152: 106385. DOI: 10.1016/j.compbiomed.2022.106385.
[5]. KINOSHITA Y, KIYA H. Convolutional Neural Networks Considering Local and Global Features for Image Enhancement [C]//2019 IEEE International Conference on Image Processing (ICIP). Piscataway: IEEE, 2019: 2526-2530.
[6]. Guo J, Han K, Wu H, et al. Cmt: Convolutional neural networks meet vision transformers [C]//Proceedings of the IEEE/CVF Conference on Computer Vision and Pattern Recognition. 2022: 12175-12185.
[7]. Lambin P, Rios-Velazquez E, Leijenaar R, et al. Radiomics: extracting more information from medical images using advanced feature analysis [J]. European journal of cancer, 2012, 48(4): 441-446.
[8]. Pasini G, Bini F, Russo G, et al. matRadiomics: A Novel and Complete Radiomics Framework, from Image Visualization to Predictive Model [J]. Journal of Imaging, 2022, 8(8): 221.
[9]. Hu P, Chen L, Zhou Z. Machine Learning in the Differentiation of Soft Tissue Neoplasms: Comparison of Fat-Suppressed T2WI and Apparent Diffusion Coefficient (ADC) Features-Based Models [J]. Journal of Digital Imaging, 2021.
[10]. Balasubramaniam S, Velmurugan Y, Jaganathan D, et al. A Modified LeNet CNN for Breast Cancer Diagnosis in Ultrasound Images [J]. Diagnostics, 2023, 13(17): 2827.
[11]. LeCun Y, Bengio Y, Hinton G. Deep learning [J]. Nature, 2015, 521(7553): 436-444.
[12]. Chen J, Lu Y, Yu Q, et al. Transunet: Transformers make strong encoders for medical image segmentation [C]//Computer Vision and Pattern Recognition. 2021.
[13]. Hatamizadeh A, Nath V, Tang Y, et al. Swin UNETR: Swin Transformers for Semantic Segmentation of Brain Tumors in MRI Images [C]//Brainlesion: Glioma, Multiple Sclerosis, Stroke and Traumatic Brain Injuries: 7th International Workshop, BrainLes 2021, Held in Conjunction with MICCAI 2021, Strasbourg, France, September 27, 2021, Proceedings 7. Springer International Publishing, 2022: 272-284.
[14]. Xiao Z, Cai H, Wang Y, et al. Deep learning for predicting epidermal growth factor receptor mutations of non-small cell lung cancer on PET/CT images [J]. Quantitative Imaging in Medicine and Surgery, 2023, 13(3): 1286.
[15]. Wang S, Shi J, Ye Z, et al. Predicting EGFR mutation status in lung adenocarcinoma on computed tomography image using deep learning [J]. European Respiratory Journal, 2019, 53(3).
[16]. Xiong J, Li X, Lu L, et al. Implementation strategy of a CNN model affects the performance of CT assessment of EGFR mutation status in lung cancer patients [J]. IEEE Access, 2019, 7: 64583-64591.
[17]. Nair J K R, Saeed U A, McDougall C C, et al. Radiogenomic models using machine learning techniques to predict EGFR mutations in non-small cell lung cancer [J]. Canadian Association of Radiologists Journal, 2021, 72(1): 109-119.
[18]. Chen S, Han X, Tian G, et al. Using stacked deep learning models based on PET/CT images and clinical data to predict EGFR mutations in lung cancer [J]. Frontiers in Medicine, 2022, 9: 1041034.
[19]. Silva F, Pereira T, Morgado J, et al. EGFR assessment in lung cancer CT images: analysis of local and holistic regions of interest using deep unsupervised transfer learning [J]. IEEE Access, 2021, 9: 58667-58676.
[20]. Zhao S, Li W, Pang T, et al. End-to-end Prediction of EGFR Mutation Status with Denseformer [J]. IEEE Journal of Biomedical and Health Informatics, 2023.
[21]. Wang S, Yu H, Gan Y, et al. Mining whole-lung information by artificial intelligence for predicting EGFR genotype and targeted therapy response in lung cancer: a multicohort study [J]. The Lancet Digital Health, 2022, 4(5): e309-e319.
[22]. Yoon H J, Choi J, Kim E, et al. Deep learning analysis to predict EGFR mutation status in lung adenocarcinoma manifesting as pure ground-glass opacity nodules on CT [J]. Frontiers in Oncology, 2022, 12: 951575.
Cite this article
Zhuang,C.;Qin,H. (2025). Lung Cancer Image Recognition Method Based on CMT Hybrid Model: Integrating Local Perception and Global Modeling. Applied and Computational Engineering,178,10-21.
Data availability
The datasets used and/or analyzed during the current study will be available from the authors upon reasonable request.
Disclaimer/Publisher's Note
The statements, opinions and data contained in all publications are solely those of the individual author(s) and contributor(s) and not of EWA Publishing and/or the editor(s). EWA Publishing and/or the editor(s) disclaim responsibility for any injury to people or property resulting from any ideas, methods, instructions or products referred to in the content.
About volume
Volume title: Proceedings of CONF-CDS 2025 Symposium: Data Visualization Methods for Evaluation
© 2024 by the author(s). Licensee EWA Publishing, Oxford, UK. This article is an open access article distributed under the terms and
conditions of the Creative Commons Attribution (CC BY) license. Authors who
publish this series agree to the following terms:
1. Authors retain copyright and grant the series right of first publication with the work simultaneously licensed under a Creative Commons
Attribution License that allows others to share the work with an acknowledgment of the work's authorship and initial publication in this
series.
2. Authors are able to enter into separate, additional contractual arrangements for the non-exclusive distribution of the series's published
version of the work (e.g., post it to an institutional repository or publish it in a book), with an acknowledgment of its initial
publication in this series.
3. Authors are permitted and encouraged to post their work online (e.g., in institutional repositories or on their website) prior to and
during the submission process, as it can lead to productive exchanges, as well as earlier and greater citation of published work (See
Open access policy for details).
References
[1]. Han B, Zheng R, Zeng H, et al. Cancer incidence and mortality in China, 2022 [J]. Journal of the National Cancer Center, 2024.
[2]. Oser M G, Niederst M J, Sequist L V, et al. Transformation from non-small-cell lung cancer to small-cell lung cancer: molecular drivers and cells of origin [J]. The Lancet Oncology, 2015.
[3]. YUSUKE YOSHIOKA, TAKESHI KATSUDA, TAKAHIRO OCHIYA. Extracellular vesicles and encapusulated miRNAs as emerging cancer biomarkers for novel liquid biopsy [J]. Japanese Journal of Clinical Oncology, 2018.
[4]. SHEN Z Q, CAO P, YANG J Z, et al. WS-LungNet: A two-stage weakly-supervised lung cancer detection and diagnosis network [J/OL]. Computers in Biology and Medicine, 2023, 152: 106385. DOI: 10.1016/j.compbiomed.2022.106385.
[5]. KINOSHITA Y, KIYA H. Convolutional Neural Networks Considering Local and Global Features for Image Enhancement [C]//2019 IEEE International Conference on Image Processing (ICIP). Piscataway: IEEE, 2019: 2526-2530.
[6]. Guo J, Han K, Wu H, et al. Cmt: Convolutional neural networks meet vision transformers [C]//Proceedings of the IEEE/CVF Conference on Computer Vision and Pattern Recognition. 2022: 12175-12185.
[7]. Lambin P, Rios-Velazquez E, Leijenaar R, et al. Radiomics: extracting more information from medical images using advanced feature analysis [J]. European journal of cancer, 2012, 48(4): 441-446.
[8]. Pasini G, Bini F, Russo G, et al. matRadiomics: A Novel and Complete Radiomics Framework, from Image Visualization to Predictive Model [J]. Journal of Imaging, 2022, 8(8): 221.
[9]. Hu P, Chen L, Zhou Z. Machine Learning in the Differentiation of Soft Tissue Neoplasms: Comparison of Fat-Suppressed T2WI and Apparent Diffusion Coefficient (ADC) Features-Based Models [J]. Journal of Digital Imaging, 2021.
[10]. Balasubramaniam S, Velmurugan Y, Jaganathan D, et al. A Modified LeNet CNN for Breast Cancer Diagnosis in Ultrasound Images [J]. Diagnostics, 2023, 13(17): 2827.
[11]. LeCun Y, Bengio Y, Hinton G. Deep learning [J]. Nature, 2015, 521(7553): 436-444.
[12]. Chen J, Lu Y, Yu Q, et al. Transunet: Transformers make strong encoders for medical image segmentation [C]//Computer Vision and Pattern Recognition. 2021.
[13]. Hatamizadeh A, Nath V, Tang Y, et al. Swin UNETR: Swin Transformers for Semantic Segmentation of Brain Tumors in MRI Images [C]//Brainlesion: Glioma, Multiple Sclerosis, Stroke and Traumatic Brain Injuries: 7th International Workshop, BrainLes 2021, Held in Conjunction with MICCAI 2021, Strasbourg, France, September 27, 2021, Proceedings 7. Springer International Publishing, 2022: 272-284.
[14]. Xiao Z, Cai H, Wang Y, et al. Deep learning for predicting epidermal growth factor receptor mutations of non-small cell lung cancer on PET/CT images [J]. Quantitative Imaging in Medicine and Surgery, 2023, 13(3): 1286.
[15]. Wang S, Shi J, Ye Z, et al. Predicting EGFR mutation status in lung adenocarcinoma on computed tomography image using deep learning [J]. European Respiratory Journal, 2019, 53(3).
[16]. Xiong J, Li X, Lu L, et al. Implementation strategy of a CNN model affects the performance of CT assessment of EGFR mutation status in lung cancer patients [J]. IEEE Access, 2019, 7: 64583-64591.
[17]. Nair J K R, Saeed U A, McDougall C C, et al. Radiogenomic models using machine learning techniques to predict EGFR mutations in non-small cell lung cancer [J]. Canadian Association of Radiologists Journal, 2021, 72(1): 109-119.
[18]. Chen S, Han X, Tian G, et al. Using stacked deep learning models based on PET/CT images and clinical data to predict EGFR mutations in lung cancer [J]. Frontiers in Medicine, 2022, 9: 1041034.
[19]. Silva F, Pereira T, Morgado J, et al. EGFR assessment in lung cancer CT images: analysis of local and holistic regions of interest using deep unsupervised transfer learning [J]. IEEE Access, 2021, 9: 58667-58676.
[20]. Zhao S, Li W, Pang T, et al. End-to-end Prediction of EGFR Mutation Status with Denseformer [J]. IEEE Journal of Biomedical and Health Informatics, 2023.
[21]. Wang S, Yu H, Gan Y, et al. Mining whole-lung information by artificial intelligence for predicting EGFR genotype and targeted therapy response in lung cancer: a multicohort study [J]. The Lancet Digital Health, 2022, 4(5): e309-e319.
[22]. Yoon H J, Choi J, Kim E, et al. Deep learning analysis to predict EGFR mutation status in lung adenocarcinoma manifesting as pure ground-glass opacity nodules on CT [J]. Frontiers in Oncology, 2022, 12: 951575.