


1. Introduction
Recent years witnessed enormous growth in the economy. Shi analyzed that under promotion incentives and financial incentives, governments at all levels introduce target management into economic development [1]. The traditional concept of frugality has changed, and more and more people are becoming more willing to consume and spend tomorrow's money, which gives them bigger budgets [2]. More people are willing to purchase environmentally friendly products with economic benefits [3]. According to Stenersen and Machado, the development of sailboats is one of the most popular areas with social relationships which are worth investing [4,5]. Therefore, sailboats are being more popular. More people are expecting to have a sailboat of themselves. However, consumption is increasingly returning to rationality and pursuing cost-effectiveness. People are more willing to purchase used product which they believe is close to brand new but with half the price [6]. Therefore, a second-handed sailboat is becoming the first choice of many people. Meanwhile, the market for used sailboats is very confusing. It is important to build a random forest model to predict the price of used sailboats so that customers won’t get cheated. As Kathan illustrates, many second-hand businesses rely on digital information [7]. It is a trend that traditional businesses are corporate with advanced technology. For large corporations, it is important to establish a second-hand business model. According to research conducted by Adamo in 2022, a second-hand model in the economy can generate startup and awareness challenges [8]. In this regard, it is significant for sailboat companies to develop a business approach that allows them to either launch their second-hand operations or prepare for potential competitors in the space. However, in the current market, the development of traditional algorithm-based valuations for second-hand sailboats is mainly reliant on manual evaluations by human experts. This approach has obvious drawbacks such as low efficiency and potential inaccuracy, as it takes considerable time and experience for people to properly learn how to accurately assess the pricing of pre-owned sailboats since lots of factors influence the price of a sailboat [9]. There is therefore a need to explore alternative valuation methods that can address these limitations of human-centered evaluations for second-hand sailboat pricing.
The main objective of this study is to build a model by using machine learning so that the computer could automatically evaluate the value of the sailboat and return the ideal price of such a sailboat. Specifically, the study initializes the dataset. The study removes the useless vectors and checks the completeness of the dataset. Finally, the study removes columns that have little data to do the fitting. After initialization, the blank values in the dataset are fulfilled. Secondly, the study plots the distribution of the dataset to see how the data is distributed in the dataset. Meanwhile, the study uses Random Forest to do the machine learning, specifically using the random forest to do further study and returns the results. Additionally, comparisons are made to figure out that random forest performs best while doing machine learning and returns the score of such machine learning method by using LightGBM (LGB) and XGBoost (XGB) to do cross attempts. The experimental results demonstrate that the computer can evaluate the price of second-handed sailboats correctly. Customers could use this study to evaluate the price of the sailboat themselves and sailboat enterprises could use the study to build their system evaluating the price.
2. Methodology
2.1. Dataset description and preprocessing
The Used Sailboat Attributes and Prices dataset from Kaggle contains 2261 data and 24 variables [10]. As is shown in Table 1, the dataset consists of three components. The first type is information about the second-hand sailboat itself. The second type is the information that does not affect the regression: URL. The third type is the target variable, Listing Price: a variable that all variables may have an impact on. The dataset is divided into two sets: the training sets (80%) and the test sets (20%), which are efficient for classification. In preprocessing, the URL variable is removed as it is not useful for classification. The ballast type column is removed as there is not enough data. All the data is normalized to prepare it for the model.
Table 1. Composition of the dataset.
Component | Type | Fields |
Sailboat itself information | String | Make, Variant, Length, Geographic Region, Country/Region/State |
Sailboat itself information | Numeric | Year, Make-Variant, LOA, LWL, Beam, S.A., Draft, Displacement, S.A./Disp, Disp./Len |
Sailboat itself information | Categorical | Hull Type, Rigging Type, Ballast Type, Construction, First Built, Builder, Catamarans |
Irrelevant information | String | URL |
Target variable | Numeric | Listing Price |
2.2. Proposed approach
The key steps are displayed in Figure 1. The study started with data preprocessing, which is an essential method for machine learning. After preprocessing, the training data can be used to train classification models such as the Random Forest model. The test data can then be used to evaluate the model performance. Random Forest is compared to other methods such as LGB and XGB to cross-verify the accuracy. Finally, the model after training is used to classify the new sailboat data and predict prices. In this way, customers can assess prices themselves and companies can create pricing systems.
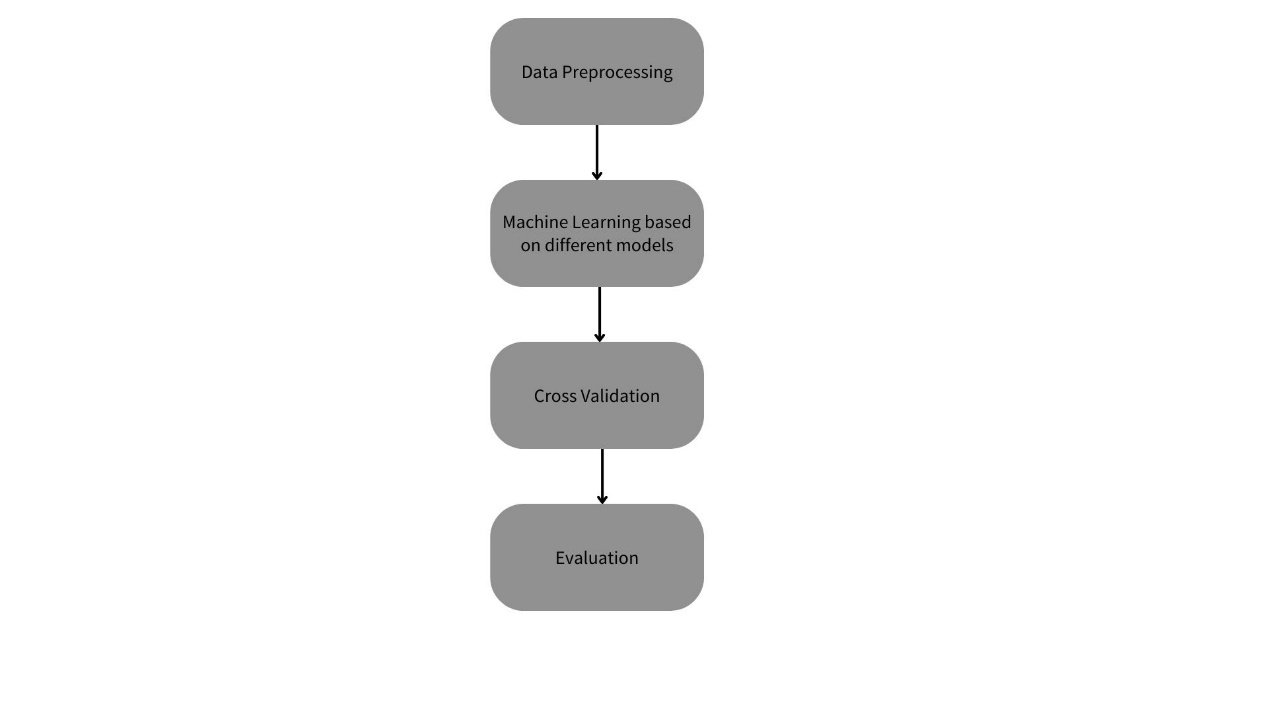
Figure 1. The flow chart of the research.
2.2.1. Random forest. Random forest is a popular machine-learning method for both classification and regression. It is operated by establishing multiple decision trees during training and outputting methods and returns the mode of classes or the mean prediction of different trees. Random forests correct the overfitting tendency of decision trees by introducing randomness when building each tree. As is shown in Figure 2, instead of searching for the very best feature when splitting a node, random forests randomly sample a subset of features and split on the best feature from that subset. This results in greater tree diversity, which averages out overfitting peculiarities and leads to better generalization. Overall, random forest exhibits high accuracy and is robust to noise. It can be used for a wide range of prediction and classification tasks. The algorithm outputs a forest of diverse decision trees whose aggregated votes or values give high-performance predictions. In this project, Random Forest is applied in different ways: Firstly, a Random Forest regressor model is defined in the list with hyperparameters like the number of trees and maximum features. Then, the Random Forest model is added to the list of candidate models to compare. During cross-validation, Random Forest is treated as one of the candidate models and goes through multiple rounds of cross-validation. This generates the average scores and variances of Random Forest across cross-validation folds. Finally, the cross-validation results of Random Forest are printed out. In summary, by defining the model, adding it to the candidate list, and comparing it through cross-validation scoring, Random Forest is effectively applied to this used sailboat price prediction problem.
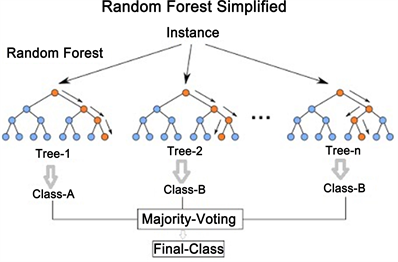
Figure 2. Principle of Random Forest.
2.2.2. Evaluating indicators. Four main evaluation metrics are utilized in this used sailboat price prediction project to assess the performance of different machine learning models: coefficient of determination measures (R2 score), Mean Absolute Error (MAE), Root Mean Squared Error (RMSE), Mean Absolute Percentage Error (MAPE). R2 score measures how well the predicted values fit the actual data. The value of R2 is between 0 and 1. Higher values indicates better fit. In the code, R2 score is computed on each cross-validation fold and averaged, as follows,
\( {R^{2}}=1-\frac{\sum _{i=1}^{n}{({y_{i}}-\hat{{y_{i}}})^{2}}}{\sum _{i=1}^{n}{({y_{i}}-\bar{{y_{i}}})^{2}}}∈[0,1] \) (1)
MAE calculates the average of absolute differences between predicted values and actual values. Lower MAE signifies higher prediction accuracy. MAE is computed on each fold after making predictions and averaged, as follows,
\( MAE=\frac{1}{n}\sum _{i=1}^{n}|{y_{i}}-\hat{{y_{i}}}|∈[0,+∞) \) (2)
RMSE is similar to MAE but squares the errors before averaging, amplifying larger errors. Lower RMSE also indicates better predictions. RMSE is calculated alongside MAE, as follows,
\( RMSE=\sqrt[]{\frac{1}{n}\sum _{i=1}^{n}{({y_{i}}-\hat{{y_{i}}})^{2}}}∈[0,+∞) \) (3)
MAPE computes the mean absolute percentage difference between predictions and actuals. Lower MAPE denotes higher accuracy. MAPE is averaged across folds, as follows,
\( MAPE=\frac{100\%}{n}\sum _{i=1}^{n}|\frac{{y_{i}}-\hat{{y_{i}}}}{{y_{i}}}|∈[0,+∞) \) (4)
These evaluating methods could efficiently show the result of the machine learning and return the completeness of the learning. By evaluating these metrics over cross-validation, the model with the best-validated performance can be chosen. The metrics provide a comprehensive assessment of model generalization capability on the sailboat pricing task.
3. Result and discussion
After running the classification, the computer successfully did machine learning and create a second-hand sailboat price evaluating the model. From Table 2 below, it can be seen that when doing specific missions, different machine learning models perform different performances. However, since the random forest performs better than the others, it is selected to do the cross-certification. The graph shows the correctness of machine learning, which is around 0.86.
Table 2. Accuracy among different models.
Punitive Regression | 0.813 |
KNN | 0.462 |
Decision Tree | 0.752 |
Random Forest | 0.860 |
Gradient Enhancement | 0.833 |
To accurately verify the result of machine learning, repeated attempts are used in the study. LGB and XGB are used to verify the random forest. LGB and XGB are two popular tree-based algorithms widely used in machine learning. LGB stands for Light Gradient Boosting Machine, which is a gradient boosting framework that is fast, distributed, and high-performance. It uses leaf-wise tree growth and exclusive feature bundling to effectively reduce computing costs while achieving competitive accuracy. As a result, LGB can lower memory usage and achieve faster training speed compared to other boosting algorithms. On the other hand, XGB represents extreme Gradient Boosting, which is another open-source scalable boosting library. It implements machine learning algorithms under the Gradient Boosting framework and optimized distributed gradient boosting is provided with efficiency. The XGB library supports various environments like Python, R, Julia, Scala, etc. In summary, both LGB and XGB utilize gradient tree boosting techniques and can deliver state-of-the-art results on many machine learning tasks with fast model training and prediction. From Figures 3 and 4 below, it can be seen that evaluating by the four evaluating indicators, the random forest performs better than the others.

Figure 3. R2 Variance Comparison and MAE Variance Comparison.
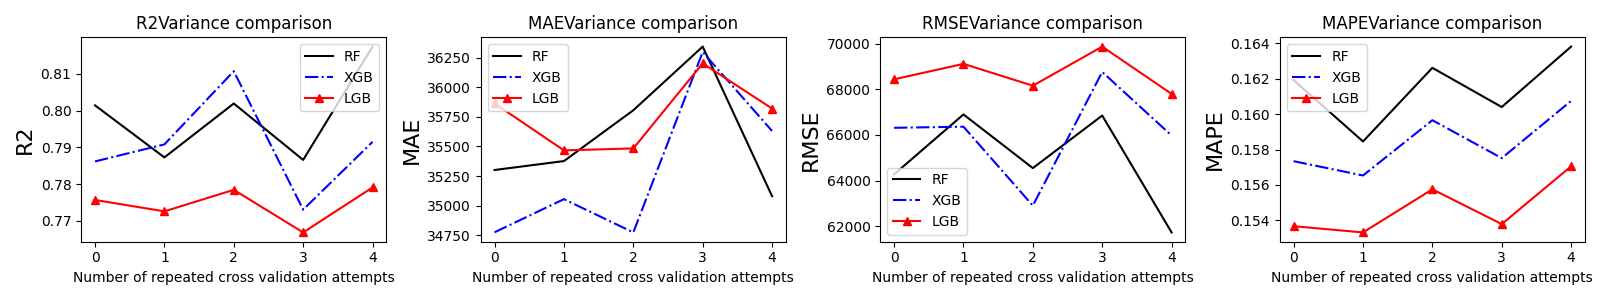
Figure 4. RMSE Variance Comparison and MAPE Variance Comparison.
4. Conclusion
This study demonstrates the viability of using machine learning models to accurately predict used sailboat prices. After cleaning and preprocessing the data, a random forest model is constructed and compared to gradient boosting and neural networks. Random forest is found to provide the best predictive performance through its ensemble approach. Rigorous cross-validation using K-folds is conducted to reduce bias and assess model generalization capability. Evaluation metrics like R2, RMSE, and MAE are tracked to quantify model fit. With an R2 of around 0.77, the random forest model is proven capable of reliably estimating the prices of second-hand sailboats. The algorithm can capture complex nonlinear relationships in the sailboat attributes and pricing. This has useful applications for both customers and sailboat companies. Customers can leverage the predictive model to evaluate the boats themselves and avoid overpaying. Meanwhile, companies can build automated valuation systems based on the machine learning approach to streamline operations. Overall, the study offers a data-driven solution for used sailboat price estimation that outperforms manual appraisal.
References
[1]. Shi Z Sun R 2023 Economic Growth Targets, Local Government Debt, and Radical Urbanization - An Empirical Study Based on Spatial Durbin Model and Mediating Effects Friends of Accounting / Friends of Accounting (3): pp 48-54
[2]. Li F X 2020 Is Consumption Downgrading or Upgrading of Consumption Structure, Quality, and Perception Research on Economic and Social Development 32: p 0098
[3]. Hu S Henninger C E Boardman R Ryding D 2019 Challenging Current Fashion Business Models: Entrepreneurship Through Access-Based Consumption in the Second-Hand Luxury Garment Sector Within a Circular Economy Springer Singapore
[4]. Stenersen H S 2016 Construction and Control of an Autonomous Sail Boat IFAC-PapersOnLine 49(23): pp 524-531
[5]. Machado M Almeida S de Bollick L C Bragagnolo G 2019 Second-hand fashion market: consumer role in circular economy Journal of Fashion Marketing and Management: An International Journal 23(3): pp 382-395
[6]. Waight E 2019 Mother, consumer, trader: Gendering the commodification of second-hand economies since the recession Journal of Consumer Culture 19(4): pp 532-550
[7]. Kathan W Matzler K Veider V 2016 The sharing economy: Your business model's friend or foe? Business Horizons 59 (6): pp 663 – 672
[8]. D AI Lupi G Morone P Settembre-Blundo D 2022 Towards the circular economy in the fashion industry: the second-hand market as a best practice of sustainable responsibility for businesses and consumers Environmental Science and Pollution Research 29(31): pp 46620-46633 doi:10.1007/s11356-022-19255-2
[9]. Sipic T 2017 Eco-labelling of marine recreation services: the case of Blue Flag price premium in Croatia Journal of Ecotourism 16(1): pp 1-23
[10]. Dataset https://www.kaggle.com/datasets/sty0077777/used-sailboat-attributes-and-prices
Cite this article
Ju,M. (2024). Automated valuation of used sailboat prices based on random forest regression modeling. Applied and Computational Engineering,36,1-6.
Data availability
The datasets used and/or analyzed during the current study will be available from the authors upon reasonable request.
Disclaimer/Publisher's Note
The statements, opinions and data contained in all publications are solely those of the individual author(s) and contributor(s) and not of EWA Publishing and/or the editor(s). EWA Publishing and/or the editor(s) disclaim responsibility for any injury to people or property resulting from any ideas, methods, instructions or products referred to in the content.
About volume
Volume title: Proceedings of the 2023 International Conference on Machine Learning and Automation
© 2024 by the author(s). Licensee EWA Publishing, Oxford, UK. This article is an open access article distributed under the terms and
conditions of the Creative Commons Attribution (CC BY) license. Authors who
publish this series agree to the following terms:
1. Authors retain copyright and grant the series right of first publication with the work simultaneously licensed under a Creative Commons
Attribution License that allows others to share the work with an acknowledgment of the work's authorship and initial publication in this
series.
2. Authors are able to enter into separate, additional contractual arrangements for the non-exclusive distribution of the series's published
version of the work (e.g., post it to an institutional repository or publish it in a book), with an acknowledgment of its initial
publication in this series.
3. Authors are permitted and encouraged to post their work online (e.g., in institutional repositories or on their website) prior to and
during the submission process, as it can lead to productive exchanges, as well as earlier and greater citation of published work (See
Open access policy for details).
References
[1]. Shi Z Sun R 2023 Economic Growth Targets, Local Government Debt, and Radical Urbanization - An Empirical Study Based on Spatial Durbin Model and Mediating Effects Friends of Accounting / Friends of Accounting (3): pp 48-54
[2]. Li F X 2020 Is Consumption Downgrading or Upgrading of Consumption Structure, Quality, and Perception Research on Economic and Social Development 32: p 0098
[3]. Hu S Henninger C E Boardman R Ryding D 2019 Challenging Current Fashion Business Models: Entrepreneurship Through Access-Based Consumption in the Second-Hand Luxury Garment Sector Within a Circular Economy Springer Singapore
[4]. Stenersen H S 2016 Construction and Control of an Autonomous Sail Boat IFAC-PapersOnLine 49(23): pp 524-531
[5]. Machado M Almeida S de Bollick L C Bragagnolo G 2019 Second-hand fashion market: consumer role in circular economy Journal of Fashion Marketing and Management: An International Journal 23(3): pp 382-395
[6]. Waight E 2019 Mother, consumer, trader: Gendering the commodification of second-hand economies since the recession Journal of Consumer Culture 19(4): pp 532-550
[7]. Kathan W Matzler K Veider V 2016 The sharing economy: Your business model's friend or foe? Business Horizons 59 (6): pp 663 – 672
[8]. D AI Lupi G Morone P Settembre-Blundo D 2022 Towards the circular economy in the fashion industry: the second-hand market as a best practice of sustainable responsibility for businesses and consumers Environmental Science and Pollution Research 29(31): pp 46620-46633 doi:10.1007/s11356-022-19255-2
[9]. Sipic T 2017 Eco-labelling of marine recreation services: the case of Blue Flag price premium in Croatia Journal of Ecotourism 16(1): pp 1-23
[10]. Dataset https://www.kaggle.com/datasets/sty0077777/used-sailboat-attributes-and-prices