1. Introduction
Detecting objects in images is a common task in Computer Vision. Object detection aims to see all cases of things and recognize each category from the image [1]. Object detection serves as the foundation for comprehending the high-level semantic information included in photos. This task has been extensively studied in academia and real-world applications, including automatic driving, educational supervision, and smart homes.
Accuracy and speed are the two most essential norms for object detection [2]. Numerous techniques based on deep learning have been developed to finish the task more quickly and accurately. One can distinguish between single-stage and multi-stage object detection techniques. Representative single-stage object detection algorithms include You Only Look Once (YOLO), Single Shot MultiBox Detector (SSD), RetinaNet, etc. The multi-stage object detection method must repeat the steps many times: candidate region acquisition, classification, and regression, and repeatedly modify the candidate region. Multi-stage object detection algorithms mainly lie in the Region-CNN (R-CNN) series.
Stage-of-art single-stage and two-stage object detection algorithms achieve good detection accuracy and speed. Many advanced models perform better on different data sets and are widely used for testing object detection models. However, the vast majority of such datasets detect significant differences between categories, specifically in the shape and colour of the object. Some detection algorithms to distinguish objects with slight differences are also needed. For example, it is easy for the model to determine the cats from cars, but it may be challenging to distinguish cats from tigers.
To have research about detecting objects with similar features, this article chooses the Cloud detection task as our research problem. Cloud detection is a problem that needs to see the clouds with their types from the given pictures, which is different from the Cloud Classification problem in the targets they met. Before this, many models were used to classify cloud types, and the neural network-based model achieved an overall cloud recognition accuracy of 93%, which is incredibly high [3]. However, the work related to real-time cloud detection doesn’t show much remarkable achievement. This paper prepared 310 images of clouds with typical categorizable morphological features as our training and testing data set. The data set is uploaded on the GitHub repository, which is available and can be downloaded at the following link: https://github.com/MikukuOvO/CloudDetectionDataSet. The clouds contained in these images were manually labeled into three categories: cumulus, stratus, and cirrus. This paper then chose YOLO, Faster-RCNN, and SSD as our test models, trained and tested on our data set. Calculate mAP50 on the test data set we prepared for each model to get our training results.
Due to the three clouds' similar shape and the dataset size limitation, this paper does not expect a high mAP50. To get a higher mAP50, this paper also analyses possible reasons and gives some possible ways in the discussion part.
2. Method
2.1. Comparative method
AP is a scientific method to measure the accuracy of the detection results. It is calculated by two aspects: Precision rate and Recall rate. The precision rate represents the accuracy rate of our judgment and mainly calculates the proportion of misjudgements we make for the detected objects. The recall rate represents the accuracy rate of our detection and mainly calculates the ratio of misdetection we make for the entire thing we labelled. To calculate AP, we need to consider all the confidence between 0 and 1 and draw the corresponding Precision-Recall figure, and the area is the result of AP. The mAP is the average AP for all categories. We get AP for all the classes and their mean value to calculate. The mAP50 we used to measure our detect results in this paper estimated is like the above, but only considering the confidence between 0.5 and 1.
YOLO considers the detection problem a regression problem; it divides the total picture into S × S grids, and each grid has B bounding boxes for prediction. For each prediction box, we need to calculate four parameters (horizontal and vertical coordinates and length and width) and a confidence level. Every bounding box is used to predict one object. During training, YOLO reserves bounding boxes with a high crossover ratio and suppresses unused bounding boxes. The significant advantage of the YOLO model is that it only considers once for each image, which will significantly speed up the detection process.
Faster R-CNN is based on the Fast R-CNN model. It uses a region proposal network (RPN) to generate region proposals, improving object detection speed [4]. Also, with a two-stage detection process, it usually has good detection results for the standard data set.
SSD get features by processing the pictures into the CNN networks and using the corresponding bounding box to detect objects with different size. Moreover, SSD also combines other feature maps with different resolutions to process things with different lengths.
Three different models this paper used have various features, and the models this paper chose both single-stage and multi-stage object detection ways, hoping to get a more comprehensive detection effect for our detection task. Also, we compared the detection results of the three models to determine their suitable types of detection.
2.2. Data Preparation
This paper gets our complete data set from the pictures published online and the images I took. The data mainly comes from the website https://cloudappreciationsociety.org, and I added some concepts to improve data diversity. This paper labeled the photos prepared manually with the Python library LabelImg in the VOC and YOLO data format. This paper prepared 310 images with different resolution ratios, backgrounds, and times. In a proportion of 7:3, the entire data set is split into the training and test sets. In this way, we have about 100 images for our validation, which will reduce errors due to chance and get reliable experimental results.
2.3. Training
This paper uses our prepared data set to test our three used models.
This paper chose YOLO v5 as our first training model [5]. The GitHub repository link this paper referenced is shown below: https://github.com/ultralytics/yolov5. This paper uses yolov5s as our initial model, sets our input image size to 640 \( × \) 640, and uses multi-scale to enhance the general moderation of the model. This paper takes Stochastic gradient descent (SGD) for good performance and puts the batch equal to 32 [6]. This paper selected 1000 epochs and set the early stopping patience to 50 [7]. This paper trained the model on our training data set with 212 images.
This paper chose Faster R-CNN as our second model for training. The GitHub repository link this paper referenced is shown below: https://github.com/bubbliiiing/faster-rcnn-pytorch. This paper sets our input image size as what we place in YOLO. To improve the effectiveness of the training, this paper divided the movement into two phases: the freezing phase and the thawing phase. This paper set the batch size to 4 and the epochs to 50 during the freezing phase. Additionally, this article set the batch size to 2 and the generations to 180 during the thawing phase [8]. This paper uses the cosine function to reduce the learning rate [9]. This paper uses Adam as our optimiser to perform better than SGD [10].
This paper chose SSD as our third model for training. The GitHub repository link this paper referenced is shown below: https://github.com/lufficc/SSD. This paper set our input image size to 300 \( × \) 300 for a faster training speed. This paper uses SGD as our optimiser and sets the batch equal to 32. This paper set 2000 epochs for the training.
The three models we used all take several hours to train; the adjusted parameters in this paper control the training time of the three models to about 4 hours to make a simple comparison of the learning ability of the three models.
3. Results & Discussion
3.1. YOLO
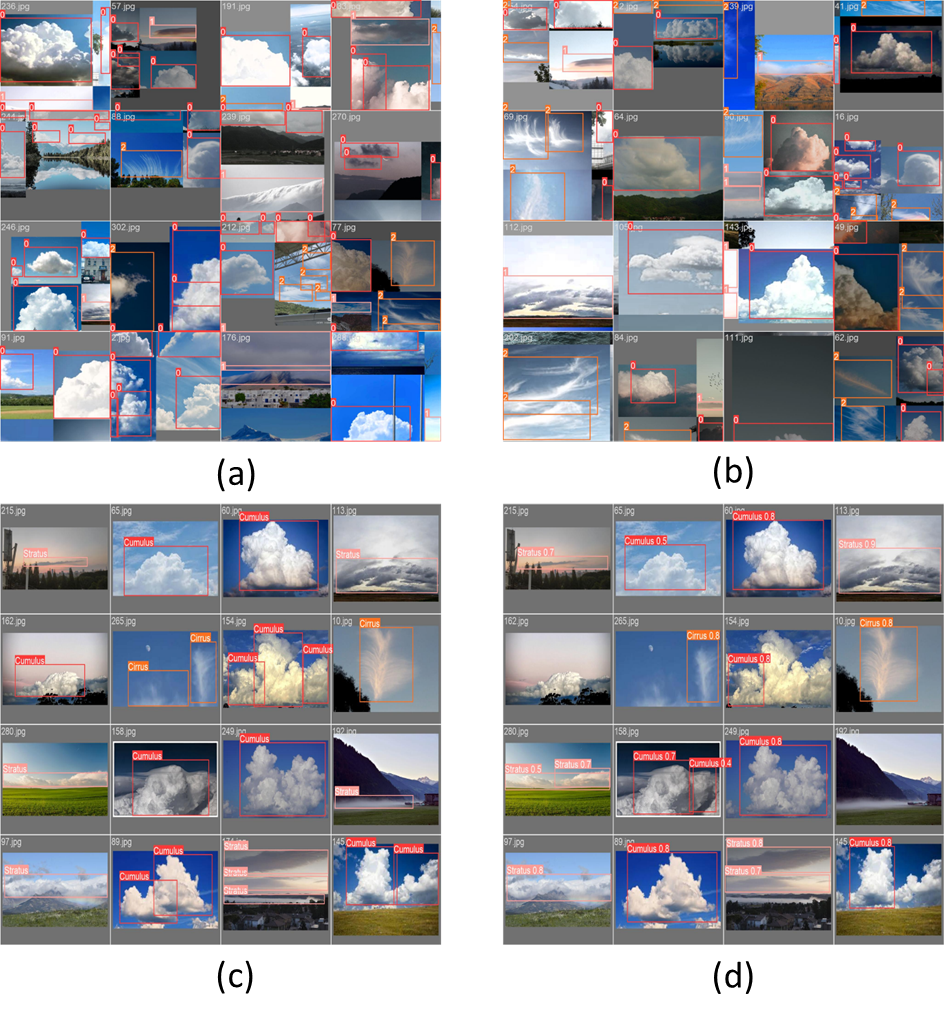
After training for 236 epochs, the model stops early. Part of the training and validation batch is presented in Figure 1 as follows.
|
Figure 1. Examples of experimental results. (a) (b) Training dataset. (c) labelled validation dataset. (d) predicted validation dataset. |
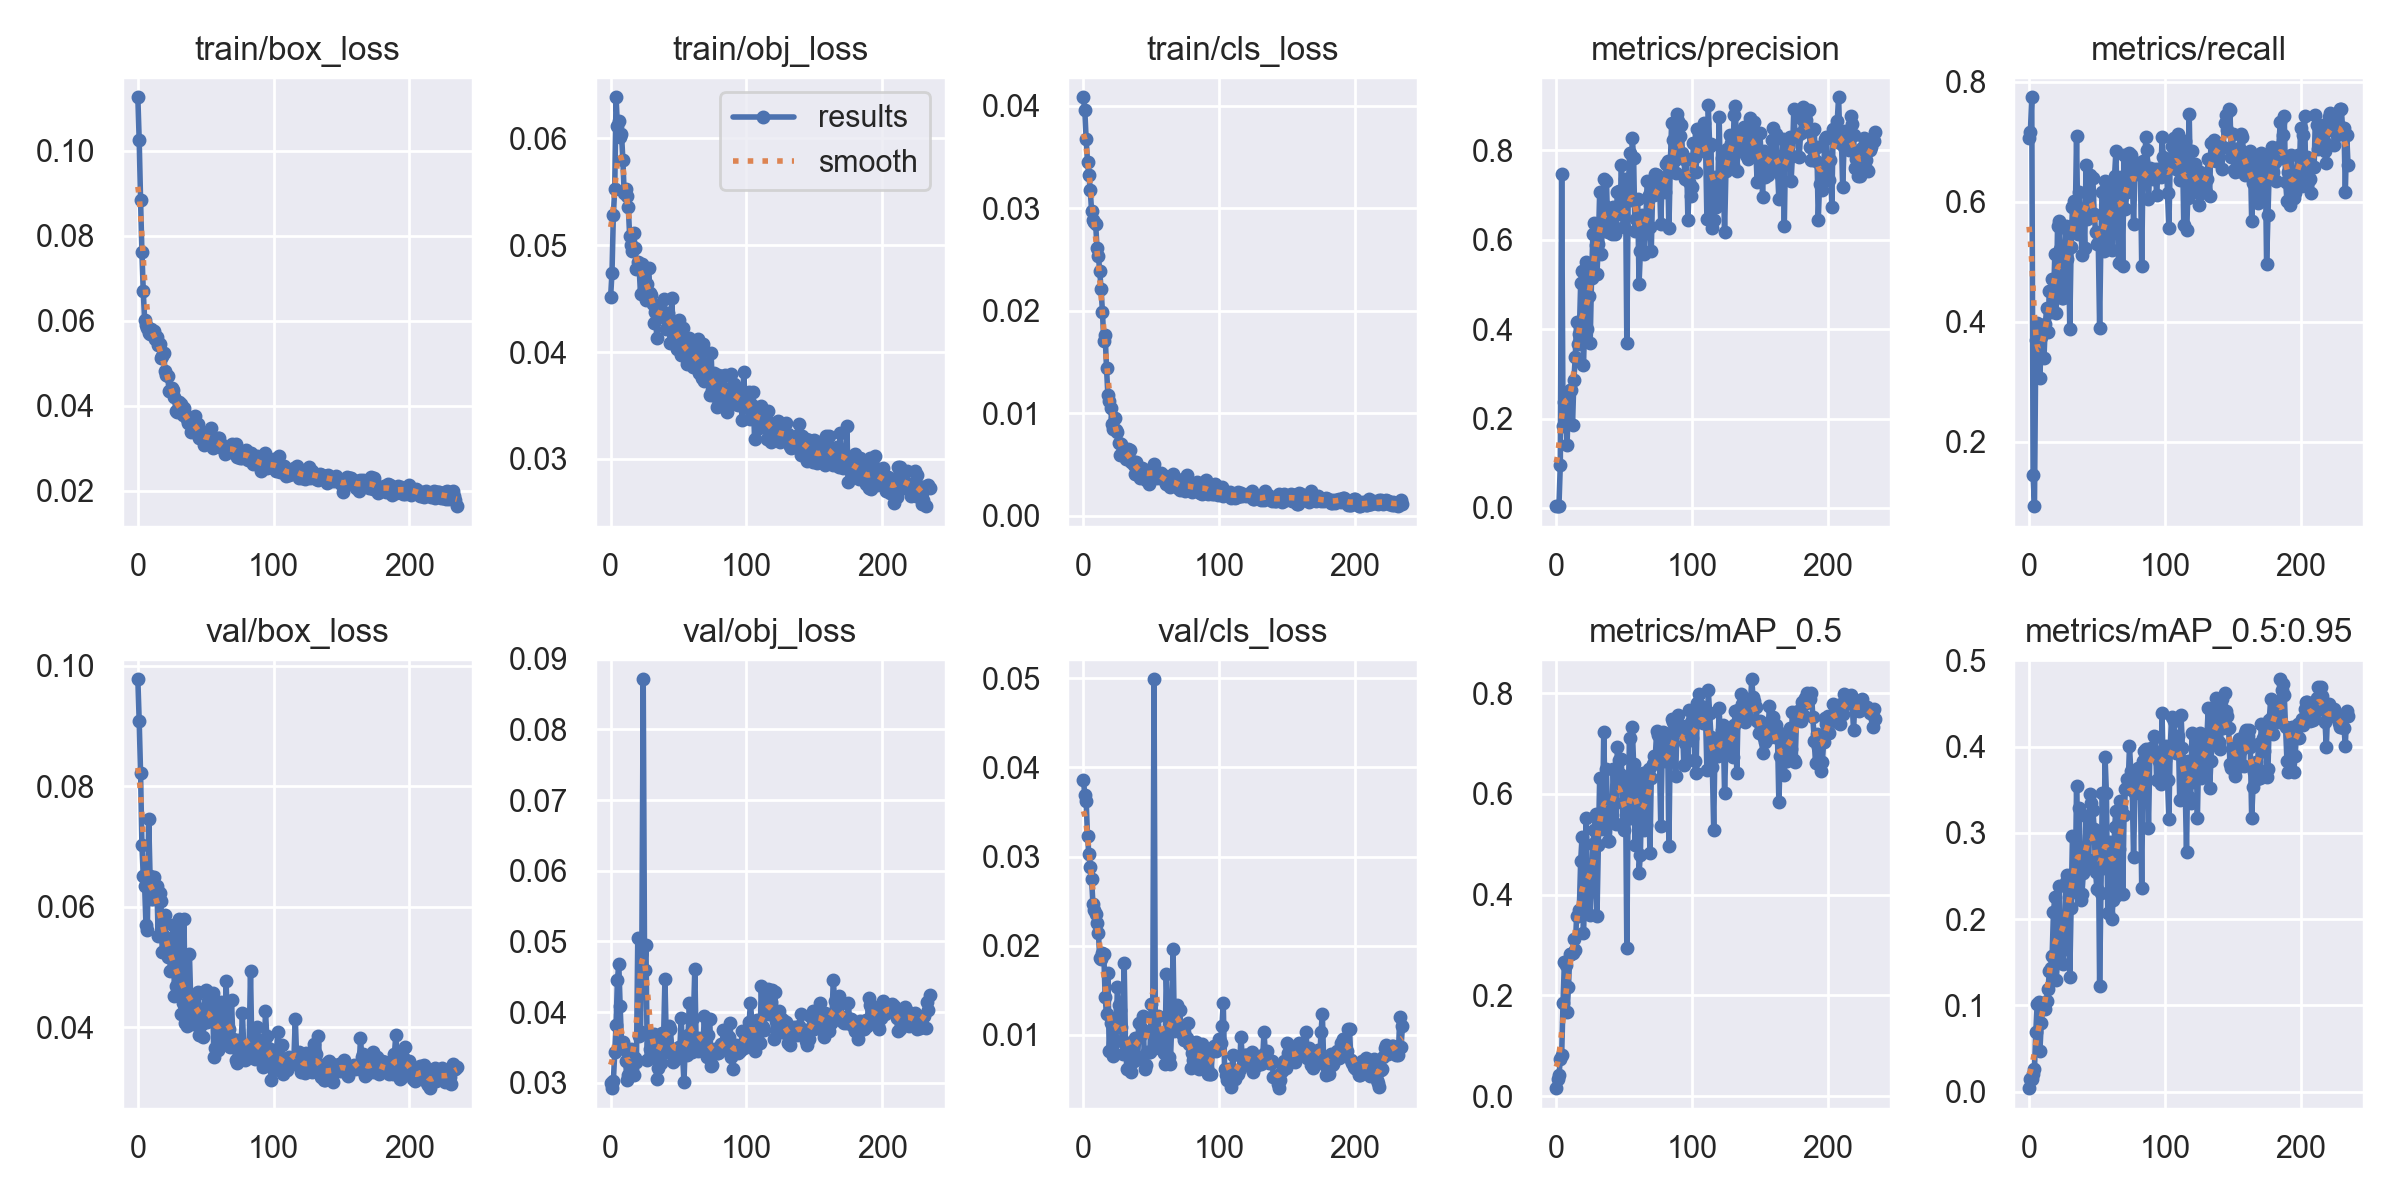
This paper records the training results during the training process, summarised in Figure 2.
|
Figure 2. Loss and mAP on the train and validation data set in the Faster R-CNN training process. |
By seeing Figure 2, we can see the loss for the box, object, and classification all show a decrease and finally get stable at a low level. The mAP0.5 (mAP50) shows an increase and receives a high level but is a little unstable. However, it doesn’t matter much; it still shows the model gets a good training result.
After testing the first model on our test data set with 98 images, this paper gets AP50, as shown in lines 1-3 of Table 1.
Table 1. The table represents AP50 for the different classes of the YOLO model.
Model | Class | AP50 |
Cumulus | 0.768 | |
YOLO | Stratus | 0.812 |
Cirrus | 0.817 | |
Faster R-CNN | Cumulus | 0.793 |
Stratus | 0.548 | |
Cirrus | 0.826 | |
Cumulus | 0.672 | |
SSD | Stratus | 0.743 |
Cirrus | 0.862 |
After calculating the total classes, this paper gets mAP50 for the first model, equal to 0.799.
3.2. Faster R-CNN
The loss and mAP change during the training process are shown in Figure 3.
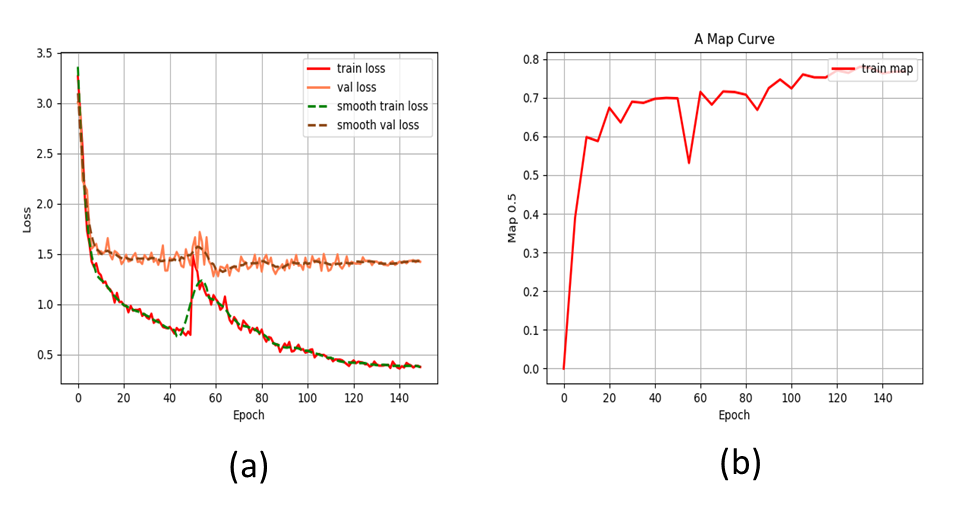
Figure 3. Loss and mAP changes during the training. (a) Loss curve. (b) mAP curve for training.
Seeing the training process also shows that we get a good training result. The mutations at the 50th epoch is due to the unfreeze training.
This paper trains for 50 epochs for the freezing phase and 180 for the thawing phase. The results are shown in lines 4-6 of Table 1.
After calculating the total classes, this paper gets mAP50 for the second model, equal to 0.722.
3.3. SSD
After training for 2000 epochs, this paper tests our model on the test data and gets our results. The results are shown in lines 6-9 of Table 1. This paper calculates the mAP50 for the third model, equal to 0.759.
Our three models all have a relatively good performance in our dataset, reaching a mAP of more than 0.7, among which the mAP of yolov5 comes 0.799, nearly 0.8. The mAP50 results are summarised in Table 2.
Table 2. The table represents mAP50 for the different models this paper chose.
Class | mAP50 |
YOLO | 0.799 |
Faster R-CNN | 0.722 |
SSD | 0.759 |
For different types of detection accuracy, different models have various performances. Among them, the YOLO model obtained similar AP values in the detection results of the three kinds of clouds, and the AP value of the cumulus cloud was slightly lower than that of the remaining two types of clouds. The Faster R-CNN model performs poorly for stratus clouds but better for cumulus and cirrus clouds. The SSD model has poor performance for cumulus clouds, average performance for stratus clouds, but outstanding performance for cirrus clouds.
3.4. Factors that may cause errors in the detection
Background: The sky is mostly the background of the photographs in both our training set and test set, but there are also some elements, such as mountains, water, and houses, which may affect the training effect of our model. For example, the places may block part of the whiteness of the water and may be confused with the colour of the clouds.
The similarity between the classes: Generally speaking, the classification boundary of three different categories of clouds is unclear, so for the same image, it may include some features of two or more clouds, which will have a corresponding impact on our detection accuracy. For example, some cirrus clouds are also in strips, which are the typical features of the stratus clouds. Our test results also find that the models often mistake these types of cirrus clouds with stratus clouds.
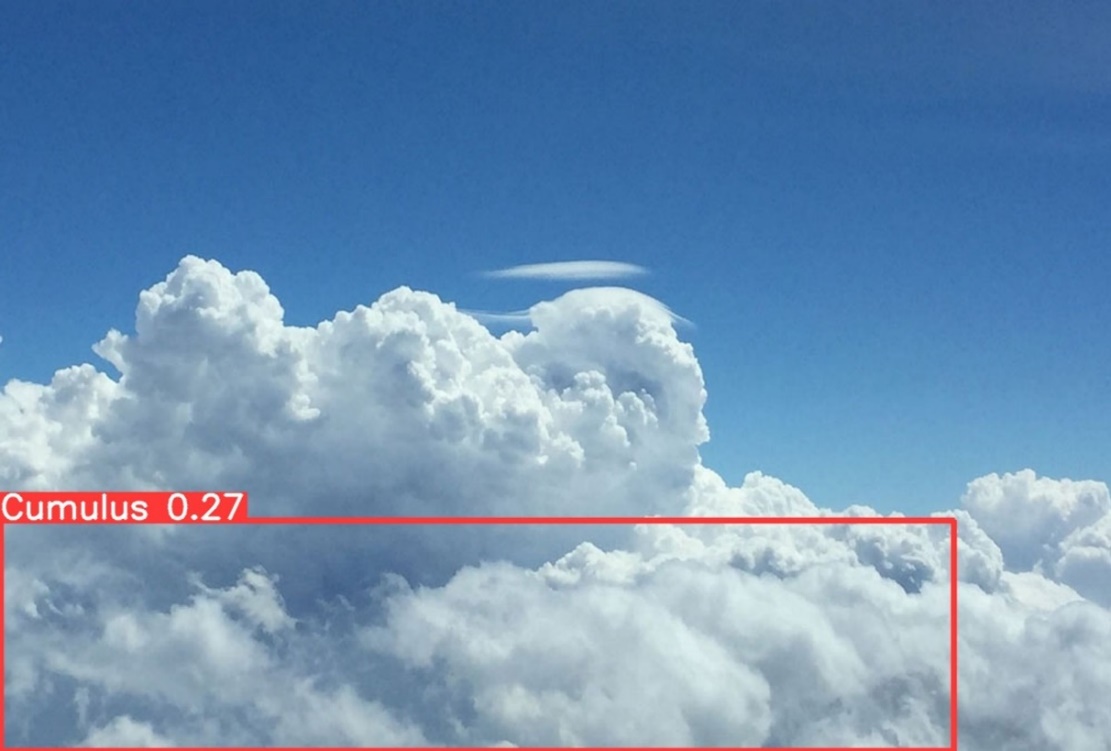
The gathering of clouds: For some of the images in our dataset, shadows come together in the form of two or more, and when labelling the dataset, this paper annotates the clouds separately in this case. However, in the case of cumulus clouds, it is generally difficult for the model to distinguish whether the cloud is a whole or a complex of multiple clouds, which is more evident in the type of cumulus cloud, which is also one of the reasons for the poor accuracy of cumulus cloud detection. Figure 4 shows an example of that.
|
Figure 4. An example of the gathering of clouds. |
3.5. Ways may improve detection performance
The background of our test set and training set is mainly blue sky. For some pictures, the contrast of the blue-sky background and white clouds is not high, which may make it difficult for our model to extract features. This paper can improve the detection accuracy by preprocessing images. Specifically, this paper can strengthen the cloud contour boundary by adjusting the contrast between blue and white to enhance the accuracy of cloud detection.
What’s more, the problem of unclear boundaries also affects the prediction a lot. To solve this problem, we can change the prediction tactics into predicting all types of objects with their probability instead of only predicting one object for one bounding box. And we get the thing with the maximum probability as our results. By using this way, the YOLOv5 performs better than the two other models we use, which certifies the feasibility of this method.
For cumulus clouds, the factors which influence the detection most are mentioned above. This paper recommends a way to modify the prediction process to address the gathering of clouds. First, this paper uses the models to get our predicted results. Then, this paper adds a second stage process to make a quadratic splitting. More specifically, we can use a convolution kernel to extract the internal boundary of the detected object and then determine whether to partition according to this boundary.
For stratus clouds, the shape of the clouds is usually long. This paper's bounding box set in YOLO and SSD methods is a more balanced ratio. So, it may influence the prediction of the stratus. We can arrange a set of bounding boxes to this specific shape to get a better performance of stratus clouds.
For cirrus clouds, the gap inside the cloud is also a relatively easy feature to extract. However, due to the resolution limitation of the input image, this feature is challenging to be captured by our detection model. By improving this of the input image, this paper can better grasp this kind of feature to enhance detection accuracy.
4. Conclusion
The three models have reached a mAP50 of more than 0.7, among which the mAP of yolov5 comes to 0.799, nearly 0.8. For different types of detection accuracy, other models have various performances. Among them, the YOLO model obtained similar AP values in the detection results of the three kinds of clouds, and the AP value of the cumulus cloud was slightly lower than that of the remaining two types of clouds. The Faster R-CNN model performs poorly for stratus clouds but better for cumulus and cirrus clouds. The SSD model has poor performance for cumulus clouds, average performance for stratus clouds, but outstanding performance for cirrus clouds.
According to the results, this paper proves that all three models perform well on the cloud detection problem based on our prepared data set. This paper also analysed the background and cloud aggregation effects on the detection results. Moreover, this paper also shows the possibility of improving detection accuracy by preprocessing images. This experiment attempts to detect objects with minor differences, gives the actual performance of several popular object detection models on such a class of data sets, and gets considerable results. Two possible suggestions for the optimisation direction of the detection effect are put forward, which provides some valuable ideas for the following research.
The shortcoming of this study lies in the limited size of the data set, which may cause the obtained results to be inaccurate and have specific errors. In addition, due to the limited hardware conditions, this paper has to train the model for a long time, and this paper cannot get the results of setting different training parameters well. Therefore, the result is only a test result for a relatively suitable training parameter, and it is possible to get a better result by choosing a better one. This paper can expand the data set size and adjust the appropriate training parameters to get more accurate and better detection results.
References
[1]. Amit, Y.,, Felzenszwalb, P., and Girshick, R., 2020. Object detection. Computer Vision, pp.1–9.
[2]. Zou, Z.,, Chen, K.,, Shi, Z.,, Guo, Y., and Ye, J., 2023. Object detection in 20 years: A survey. Proceedings of the IEEE, 111(3), pp.257–276.
[3]. Lee, J.,, Weger, R.C.,, Sengupta, S.K., and Welch, R.M., 1990. A neural network approach to cloud classification. IEEE Transactions on Geoscience and Remote Sensing, 28(5), pp.846–855.
[4]. Baghel, V.S.,, Srivastava, A.M.,, Prakash, S., and Singh, S., 2020. Minutiae points extraction using faster R-CNN. Advances in Intelligent Systems and Computing, pp.3–10.
[5]. Li, R., and Wu, Y., 2022. Improved Yolo V5 wheat ear detection algorithm based on attention mechanism. Electronics, 11(11), p.1673.
[6]. Amari, S., 1993. Backpropagation and stochastic gradient descent method. Neurocomputing, 5(4–5), pp.185–196.
[7]. Muhammad, A.R.,, Utomo, H.P.,, Hidayatullah, P., and Syakrani, N., 2022. Early stopping effectiveness for Yolov4. Journal of Information Systems Engineering and Business Intelligence, 8(1), pp.11–20.
[8]. Xu-hui, C.,, Haq, E.U., and Chengyu, Z., 2019. Notice of violation of IEEE Publication Principles: Efficient Technique to accelerate neural network training by freezing hidden layers. 2019 IEEE/ACIS 18th International Conference on Computer and Information Science (ICIS).
[9]. Xu, Y.,, Wang, H.,, Liu, X., and Sun’s, W., 2019. An improved multi-branch residual network based on random multiplier and adaptive cosine learning rate method. Journal of Visual Communication and Image Representation, 59, pp.363–370.
[10]. Zhu, A.,, Meng, Y., and Zhang, C., 2017. An improved adam algorithm using look-ahead. Proceedings of the 2017 International Conference on Deep Learning Technologies.
Cite this article
Yu,F. (2024). YOLO, Faster R-CNN, and SSD for cloud detection. Applied and Computational Engineering,37,239-247.
Data availability
The datasets used and/or analyzed during the current study will be available from the authors upon reasonable request.
Disclaimer/Publisher's Note
The statements, opinions and data contained in all publications are solely those of the individual author(s) and contributor(s) and not of EWA Publishing and/or the editor(s). EWA Publishing and/or the editor(s) disclaim responsibility for any injury to people or property resulting from any ideas, methods, instructions or products referred to in the content.
About volume
Volume title: Proceedings of the 2023 International Conference on Machine Learning and Automation
© 2024 by the author(s). Licensee EWA Publishing, Oxford, UK. This article is an open access article distributed under the terms and
conditions of the Creative Commons Attribution (CC BY) license. Authors who
publish this series agree to the following terms:
1. Authors retain copyright and grant the series right of first publication with the work simultaneously licensed under a Creative Commons
Attribution License that allows others to share the work with an acknowledgment of the work's authorship and initial publication in this
series.
2. Authors are able to enter into separate, additional contractual arrangements for the non-exclusive distribution of the series's published
version of the work (e.g., post it to an institutional repository or publish it in a book), with an acknowledgment of its initial
publication in this series.
3. Authors are permitted and encouraged to post their work online (e.g., in institutional repositories or on their website) prior to and
during the submission process, as it can lead to productive exchanges, as well as earlier and greater citation of published work (See
Open access policy for details).
References
[1]. Amit, Y.,, Felzenszwalb, P., and Girshick, R., 2020. Object detection. Computer Vision, pp.1–9.
[2]. Zou, Z.,, Chen, K.,, Shi, Z.,, Guo, Y., and Ye, J., 2023. Object detection in 20 years: A survey. Proceedings of the IEEE, 111(3), pp.257–276.
[3]. Lee, J.,, Weger, R.C.,, Sengupta, S.K., and Welch, R.M., 1990. A neural network approach to cloud classification. IEEE Transactions on Geoscience and Remote Sensing, 28(5), pp.846–855.
[4]. Baghel, V.S.,, Srivastava, A.M.,, Prakash, S., and Singh, S., 2020. Minutiae points extraction using faster R-CNN. Advances in Intelligent Systems and Computing, pp.3–10.
[5]. Li, R., and Wu, Y., 2022. Improved Yolo V5 wheat ear detection algorithm based on attention mechanism. Electronics, 11(11), p.1673.
[6]. Amari, S., 1993. Backpropagation and stochastic gradient descent method. Neurocomputing, 5(4–5), pp.185–196.
[7]. Muhammad, A.R.,, Utomo, H.P.,, Hidayatullah, P., and Syakrani, N., 2022. Early stopping effectiveness for Yolov4. Journal of Information Systems Engineering and Business Intelligence, 8(1), pp.11–20.
[8]. Xu-hui, C.,, Haq, E.U., and Chengyu, Z., 2019. Notice of violation of IEEE Publication Principles: Efficient Technique to accelerate neural network training by freezing hidden layers. 2019 IEEE/ACIS 18th International Conference on Computer and Information Science (ICIS).
[9]. Xu, Y.,, Wang, H.,, Liu, X., and Sun’s, W., 2019. An improved multi-branch residual network based on random multiplier and adaptive cosine learning rate method. Journal of Visual Communication and Image Representation, 59, pp.363–370.
[10]. Zhu, A.,, Meng, Y., and Zhang, C., 2017. An improved adam algorithm using look-ahead. Proceedings of the 2017 International Conference on Deep Learning Technologies.


