


1. Introduction
In recent years, the global hotel services have experienced unprecedented problems, with COVID-19 epidemic being a prominent disruptor. As Tauseef Ahmad states that government and private employees and customers stop entering their work, tourists and visitors complain that they may be exposed to the risk of infection, the pandemic has had a debilitating impact on the hotel services and reduced travel frequency and a general drop in passenger demand [1]. As a result, hospitality services experienced a recession for months or even 1 or 2 years, and most hotels around the world have experienced significant revenue losses and operational issues. However, as vaccination programs progressed and the global situation improved, there is a gradual recovery in the industry, marked by a surge in travel demand. This recovery presents both opportunities and challenges for hotel services.
According to the 2023 North American Airline Satisfaction Study from J.D. Power, demand in today’s airline industry has skyrocketed, and with the reopening of tourist cities around the world and the recovery of the global economy, demand in today’s hotel service has skyrocket and also hotel revenues have also been showing well [2]. However, the arrangement of holidays, crowded crowd, whether the transportation is convenient, the price and whether the complimentary breakfast, and even from the start of the car to the room hotel service comfort, are in varying degrees of customer satisfaction, which also affects the hotel’s revenue situation. It is only by making trade-offs and balancing the influence of different factors that a hotel, or even a series of hotels, can more effectively maximize its revenue. A lot of research has been done in the field of hotel customer satisfaction. Scholars have gone through different methods in their studies to explore the different influencing factors which affect the percentage of customer satisfaction and even the updated influencing factors after the epidemic. Wang, et al use TF-IDF and K-means algorithms to extract and cluster the keyworks of reviews text. They conclude factors such as consumption emotion, perceived value, and epidemic prevention affect customer’s satisfaction a lot [3]. By applying web scarping, Wong and his team collect and analyzed data from 192 three to five star rated hotels in Malaysia. Their study perceived the value mediates the relationship between service quality and customer satisfaction [4]. Song, et al also use latent Dirichlet Allocation and sentiment analysis to discover new factors that affect customer’s satisfaction during the COVID-19. Numerous attempts have been made by various studies to reveal influences on passenger satisfaction [5]. Bayad Jamal and his team apply random sampling method to prove that empathy, responsiveness, assurance and tangible have positive relation with customer satisfaction [6]. Yae-Ji and Hak-Seon conclude that after COVID-19, understanding online reviews can provide theoretical and practical implications for developing sustainable strategies for the hotel industry [7]. However, further optimization of the model to analyze complex relationships and understand decisions based on classification principles could be more effective in improving performance.
By utilizing the decision tree algorithm, a powerful tool follows a tree-like model of decisions and their possible consequences and known for its transparency and interpretability, the study seeks to construct an evaluation model [8]. This model will shed light on the intricate relationships between various factors, such as hygiene protocols, contactless services, room amenities, and guest experiences, among others. By uncovering the most influential elements on travel satisfaction, hotels can strategically allocate resources and prioritize areas for improvement, catering to the post-pandemic preferences of travelers. Ultimately, the study aims to help hotels maximize their efficiency in meeting guest expectations, leading to a positive and memorable travel experience. In doing so, hotels can gain a competitive edge in the highly dynamic and competitive travel industry landscape. As the world slowly emerges from the shadow of the pandemic, this research will play a vital role in shaping the future of hospitality, ensuring that hotels provide the highest standards of service, comfort, and safety to their valued guests.
2. Methodology
2.1. Dataset description and preprocessing
The Hotel Review Booking.com from Kaggle contains 1,500 data with 10 variables excluding the first ordinal feature [9]. This hotel review data sets includes two main components. The first one is the information about customers: Guest Name, Guest Country, Room Type, Number of Nights, Visit Date, Group Type. The second type is about comments and customer satisfaction rate: Title, Positive Review, Negative Review, Score, and Property Response.
For classification purposes, with a ratio of 80% to 20%, a training set and a testing set are created from the dataset. The first one feature, and Property Response are removed as they do not affect the classification. Categorical variables are transformed into multiple dummy variables.
2.2. Proposed approach
The main objective of this study is to develop a clear, accurate forecasting model that will assist hotel services in understanding the key variables affecting customer happiness. The first decision tree model is trained utilizing each input variable from the training dataset, as shown in Fig. 1. Second, overfitting can be identified by graphically displaying the training and testing accuracies against the depth of the tree. The first optimization technique is to restrict the depth of the model in order to avoid overfitting. Enhancing generalization capacity requires limiting the depth. In the meantime, feature importance scores are calculated using the decision tree’s feature selection approach. The critical relevance of particular features in prediction performance is highlighted by a graphical representation of feature importance. The top three features are those with the highest scores. In order to streamline the model, lessen decision tree complexity, and reduce the danger of overfitting, the final decision tree model is then trained using only these three features. After model training, metrics like accuracy, cross-validation, and Area Under the Receiver Operating Characteristic Curve (AUC) metrics are used to evaluate the predictive capability, stability, and discriminative power of the model.
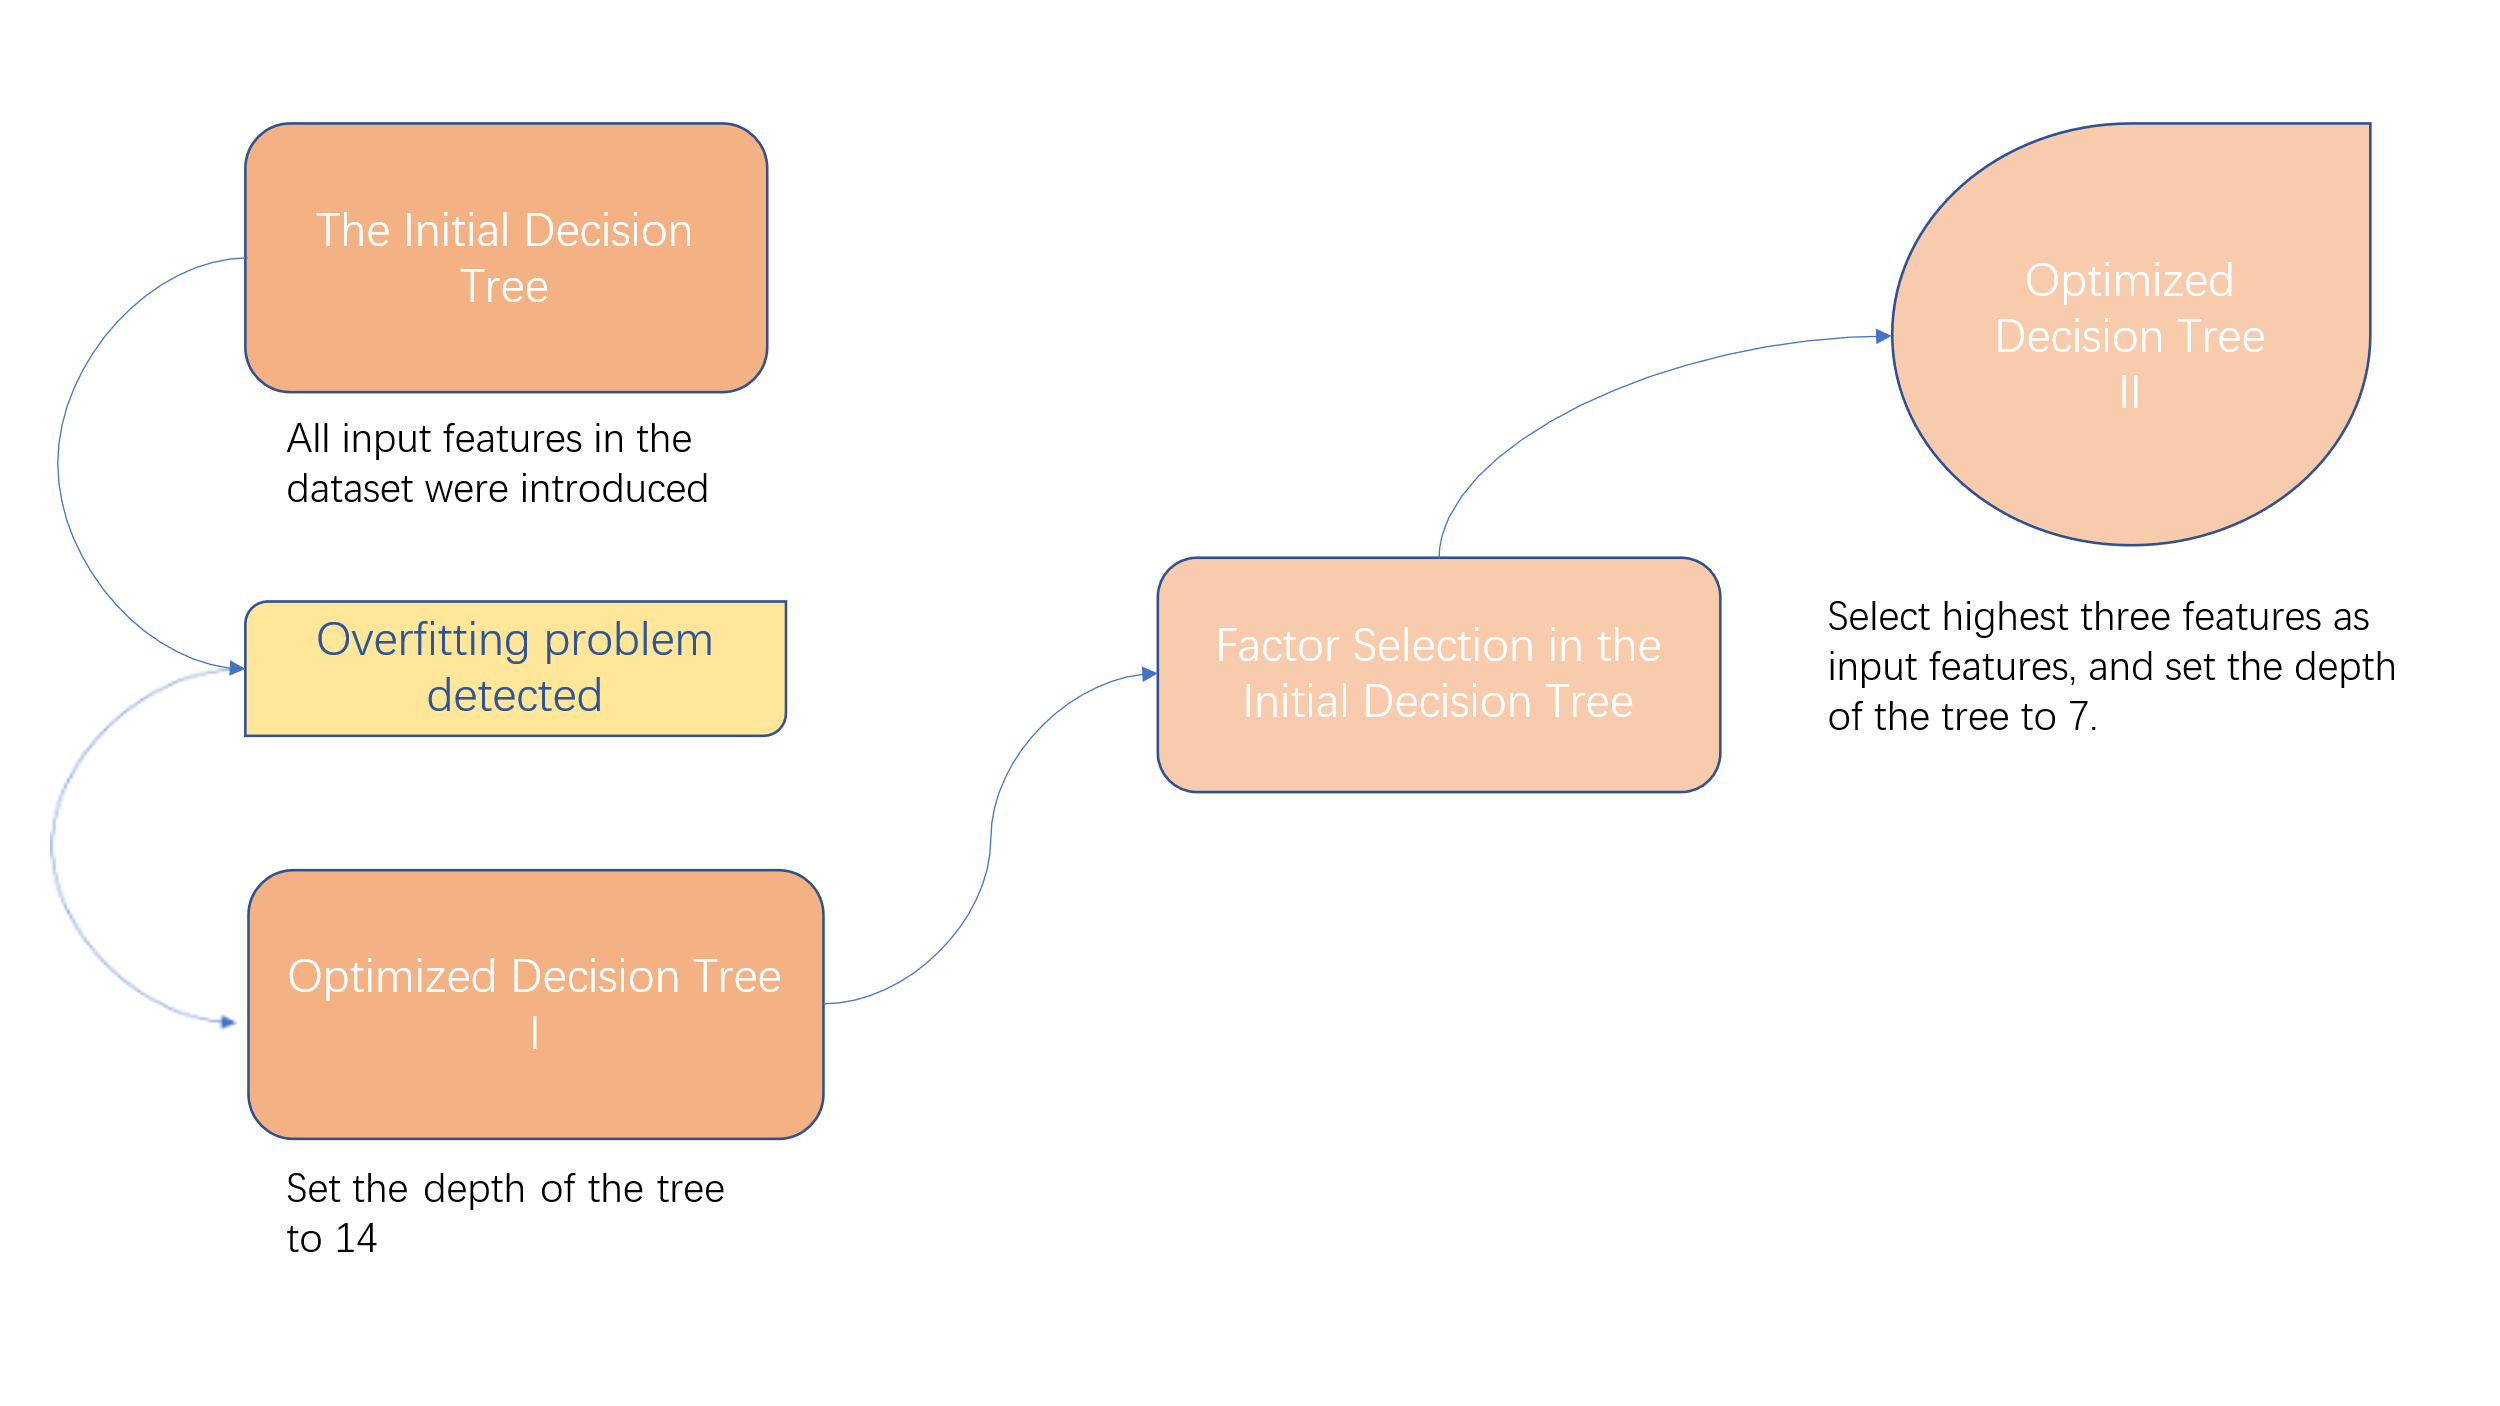
Figure 1. Flow Chart Process.
2.2.1. Decision Tree Algorithm. The decision tree stands as a supervised machine learning approach that employs a tree-like structure to tackle classification and regression tasks. By partitioning the dataset into smaller groups based on features, it emulates human decision processes, resulting in a predictive decision tree for upcoming samples. The foundational concept at the core of decision trees encompasses both feature selection and node splitting, depicted in Fig. 2. This algorithm designates the most pivotal attribute as the splitting criterion for the current node, accomplished by assessing the significance of each feature using metrics such as the Gini index or entropy. To enhance the uniformity of samples within subsets, the technique divides the dataset iteratively, only halting when specific termination criteria are met, like reaching the maximum depth or encountering a minute subset size. The decision tree methodology not only enables the examination and comprehension of extensive datasets but also furnishes a lucid and intelligible framework for decision-making. It proves suitable for tasks that demand the interpretation of causal components and a grasp of intricate relationships.
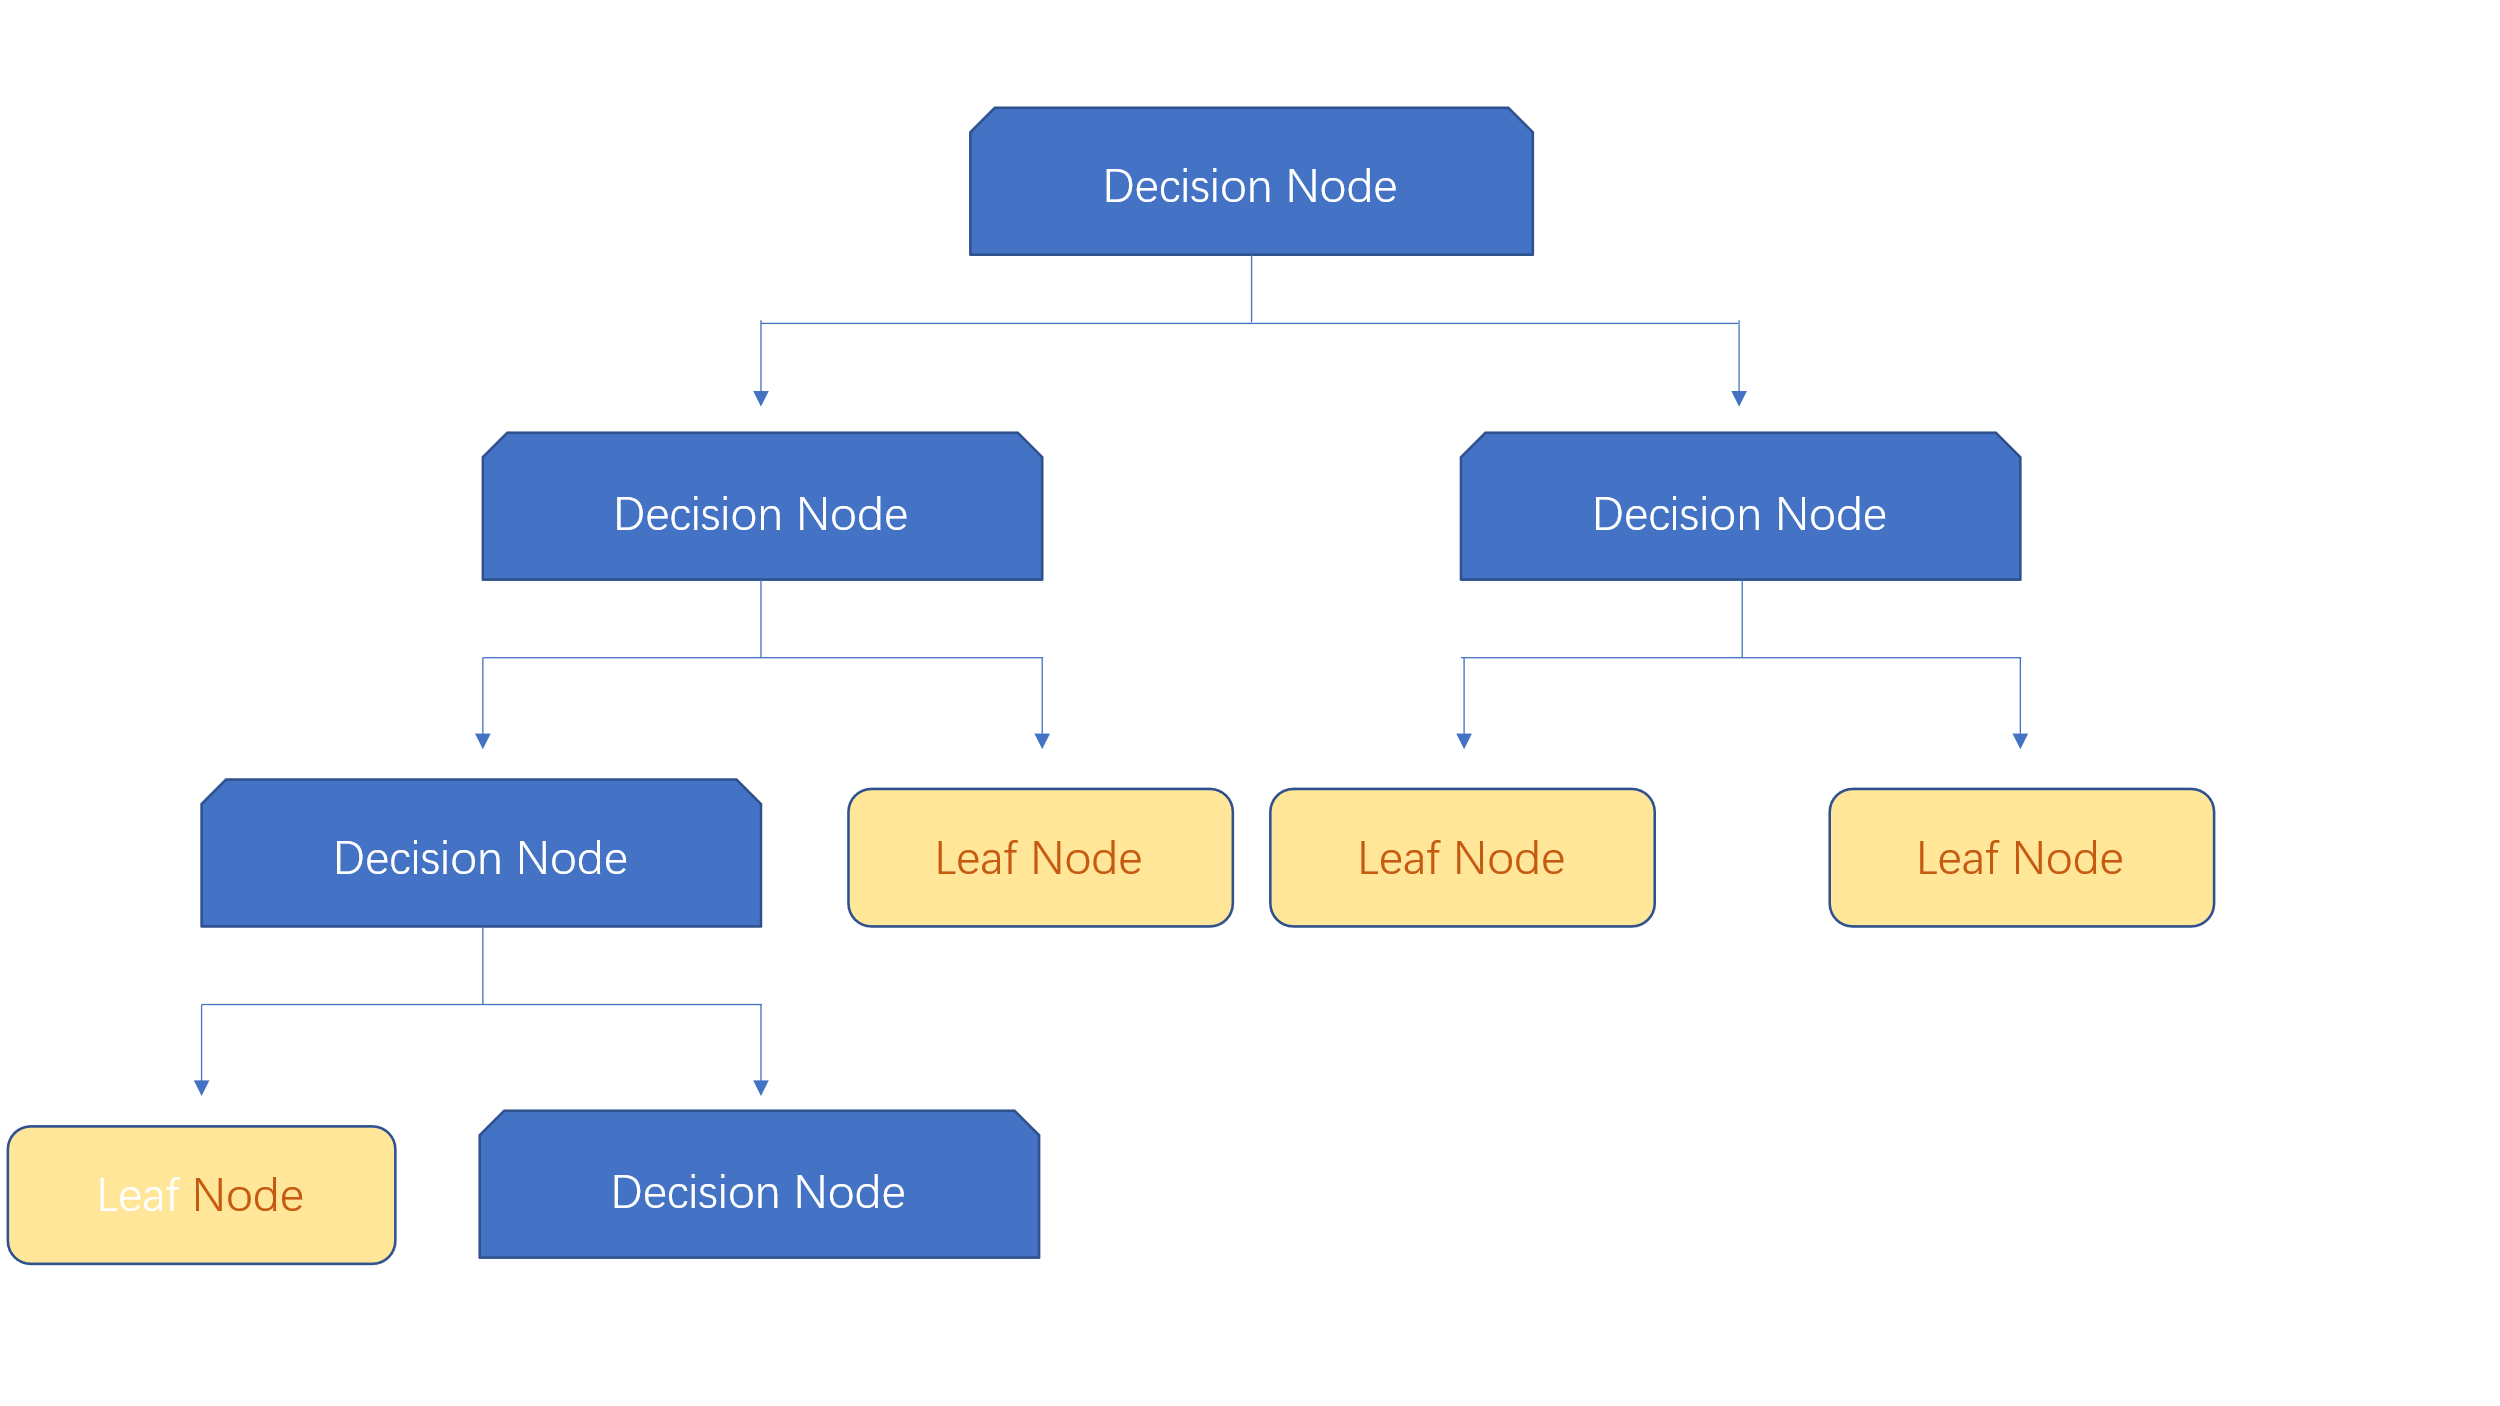
Figure 2. Diagram of a Decision Tree.
2.2.2. Feature Selection. Building simpler and more comprehensible models, improving data-mining performance, and preparing clean, understandable data, feature selection is a crucial aspect of machine learning [10]. This study employs decision trees directly for the purpose of feature selection, determining the significance of individual features. This significance is quantified through the calculation of importance scores, allowing for the identification of features that wield the greatest influence over classification outcomes. By prioritizing features based on these scores, the model can be streamlined and the complexity of the decision tree can be mitigated. Consequently, this approach enhances the model’s interpretability and its ability to generalize, simultaneously minimizing the risk of overfitting.
2.3. Evaluation Metrics and Visualization Tools
Accuracy, cross-validation, AUC, and visualizations like the confusion matrix, decision tree depth and accuracy line plot, and feature importance bar chart are some of the metrics and methods used to evaluate a decision tree model. Accuracy represents the correctness of a model’s fitting or prediction. It displays the proportion of correctly identified samples to all samples as follows,
\( Accuracy=\frac{Number of correctly classified samples}{Total number of samples}. (1) \)
It provides a valuable assessment of how well the model performs in terms of classification accuracy. The N-fold cross-validation evaluates a model’s capacity for generalisation. The dataset is divided into ten subsets of equal size, known as folds. N times are spent training and evaluating the model, with the first fold becoming a validation set and the other N-1 folds being utilised for training. The average accuracy of the N-fold cross-validation can be calculated by the following formula,
\( Average Accuracy=\frac{Accuracy1 + Accuracy2 +⋯+ AccuracyN}{N}, \)
\( N=the number of record accuracy (2) \)
In formula (2), Accuracy1 to AccuracyN are accuracies obtained by evaluating the model’s predictions on the corresponding validation set for each fold. By averaging the accuracies, a robust estimate of the model’s performance on different subsets of the data can be obtained. This allows for a more reliable assessment of its performance on unseen data.
The confusion matrix serves as a graphical instrument that depicts the alignment between the anticipated results of the model and the factual labels. It furnishes percentages representing true positives (TP), false positives (FP), true negatives (TN), and false negatives (FN), which are instrumental in evaluating the model’s classification prowess. AUC quantifies the effectiveness of binary classification models. It represents the area beneath the Receiver Operating Characteristic curve, formed by contrasting the True Positive Rate (TPR) with the False Positive Rate (FPR). The corresponding formulas are outlined below:
\( TPR=\frac{TP}{TP+FN}, FPR=\frac{FP}{FP+TN}.\ \ \ (3) \)
The AUC score gauges a model’s comprehensive performance and classification prowess across varying thresholds. It spans from 0 to 1, with a higher value signifying an enhanced ability to distinguish between positive and negative instances. Line plots showing the relationship between decision tree depth and testing accuracy help identify potential overfitting or underfitting. By observing the trend of the line, the optimal decision tree depth can be determined to achieve higher prediction accuracy.
2.4. Implemented details
The study used Python 3.10 and the Scikit-learn library for implementing decision tree models. Data visualization is done using the Seaborn and Matplotlib libraries. The study is conducted on a WINDOWS device with an 11th Gen Intel(R) Core (TM) i7-11800H. The decision tree has the following settings: Gini index for impurity measure, a minimum of 1 sample for each leaf node, minimum total sample weight of 0.0, unlimited maximum tree depth, and all features considered for splitting at each node. These settings allowed the initial decision tree model to capture patterns and relationships in the data accurately for further optimization and improvement.
3. Result and discussion
Decision tree models are believed to provide accurate categorization by finding key aspects after investigation, optimization, and review. To improve and assess the decision tree model, five steps are included in the data analysis process. All of the input variables from the training dataset are first used to train the first decision tree model. Second, the training and testing accuracy is visually displayed against the depth of the tree to reveal overfitting. As shown in Figure 3, up until a depth of 8, accuracy is comparable between the training and testing sets. The testing accuracy for the testing set rises with depth, reaching a maximum at a depth of 14, and then gradually drops and begins to distance itself from the training accuracy. The overfitting phenomenon is evident in this case. In conclusion, setting the maximum depth to 14 enables the model to perform at its most accurate. A feature importance assessment is completed in the third step.
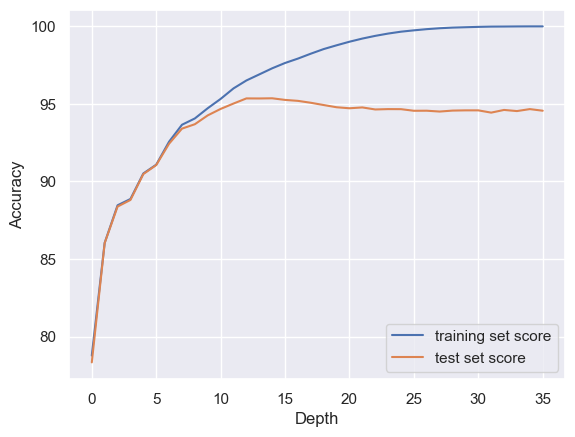
Figure 3. Dependency of Initial Decision Tree Model Depth and Accuracy.
The feature selection method of the decision tree is used to determine the relevance score of each feature. Fig. 4 illustrates the importance of each feature in the classification decision tree. Three factors stood out as being significantly more important than the rest, with a total relevance of over 70%: “Hotel_location,” “Hotel_price,” and “Online_booking.” The final prediction model is trained in the fourth step. As a result, the risk of overfitting is reduced while the decision tree is made simpler. Performance evaluation comes last. The trained model is assessed for discrimination, stability, and predictive capability.
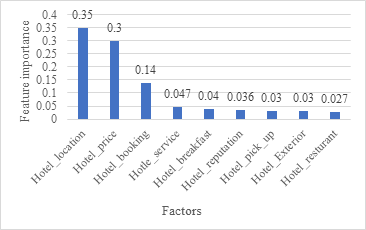
Figure 4. Factors Importance Plot.
Table 1 present the results of the initial decision tree model, which already exhibits a commendable prediction accuracy of 94.34%. The high values for cross-validation accuracy and AUC affirm the model’s predictive capability, stability, and discriminative power. The findings of the basic decision tree model, which already displays a commendable prediction accuracy of 94.34%, are presented in Table 1. The model’s capacity to predict outcomes and maintain stability and discriminative power is supported by its high cross-validation accuracy and AUC values. But Fig. 3 shows that more optimization is required. Maximum testing accuracy is achieved with a modest increase in cross-validation average accuracy and AUC values when the depth is set to 14. The decrease in overfitting is responsible for the observed improvements in the performance indicators of the optimized Model I, as shown in Fig. 3. The model’s ability to predict outcomes is enhanced while still maintaining a relatively simple structure because to this drop in depth. For the second optimised model, which is also the final model, all four metrics experienced a slight decrease to slightly below the 90% level. The optimised model achieves a testing accuracy of close to 90% for 3 features and a depth of 7.
In addition, Fig. 5 depicts the relationship between the depth of the second optimised decision tree and the testing accuracy. It shows a significant reduction in the overfitting problem of the model. It is clear from the research above that the characteristics “Hotel_location,” “Hotel_price,” and “Hotel_booking” have a significant impact on the decision tree model’s ability to predict hotel patron satisfaction. The particular values of these three characteristics operate as helpful indications for figuring out the general level of client satisfaction.
These findings carry practical implications for the hotel services. Firstly, choosing a good location can greatly increase the desire of customers to stay. Even if a hotel’s location cannot be changed, hotels can explore nearby restaurants, attractions, and convenient transportation systems to maximize the competitiveness of their location. Secondly, setting an appropriate price is more and more likely to make the hotel stand out. Affordable prices are often highly valued by customers. During different holidays, periods, hotels can design different offers. For example, the price includes breakfast, continuous or early booking can have discounts, stay in the hotel can be free tickets to nearby scenic spots and so on. Affordable prices and innovative activities usually get more attention from customers, thus increasing their satisfaction. Finally, Hotel bookings, too, are very much in the minds of customers. If you can have a set of fast, convenient and comfortable booking process, then the customer satisfaction level will be greatly increased. In addition to opening offline and online booking channels, hotels can also establish their own membership system to provide customers with more options and benefits to maximize customer satisfaction. Hotels may also improve their products and offer a more individualised travel experience by recognising and catering to the special preferences and demands of various categories of passengers. This focused strategy can make a considerable improvement in passenger satisfaction and loyalty.
Table 1. Performance of Different Decision Tree Models.
Model | Performance | |||
Accuracy | AUC | |||
Training | Testing | 10-Fold Cross-Validation | ||
Initial Decision Tree | 100.00% | 94.34% | 94.55% | 94.41% |
Optimised Decision Tree I (Depth = 14) | 96.71% | 95.33% | 95.23% | 95.23% |
Optimised Decision Tree II (Selected 3 Features, Depth = 7) | 89.08% | 88.32% | 89.20% | 88.96% |
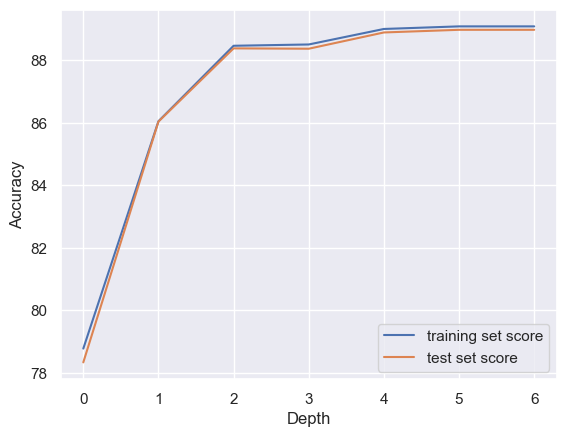
Figure 5. Dependency of Depth and Accuracy for the Optimised Model II.
4. Conclusion
This study employs the decision tree algorithm to analyse, model, and optimize a customer satisfaction dataset in order to identify the critical variables affecting customer satisfaction data in the airline business. Decision trees are able to handle vast and complicated datasets with ease since transparency and interpretability. Examining the model’s decision-making process and the complex interrelationships between the different components involved. The findings indicate that passenger happiness is significantly influenced by hotel location, hotel price, and hotel reservation. Researchers are able to clearly identify the key elements influencing hotel patron satisfaction using this model. It would be useful for future research to compare changes in consumer demand before and after the COVID-19 epidemic. This comparison analysis may offer insightful information about how the market has changed and how consumer tastes have changed over time. Future research may also concentrate on examining particular facets of the elements discovered and formulating plans to improve them, thereby increasing passenger pleasure.
References
[1]. Ahmad Tauseef Mukhtiar B Jin H 2019 Coronavirus disease 2019 (COVID-19) pandemic and economic impact Pakistan journal of medical sciences 36: p 73
[2]. Power J D 2012 North America airline satisfaction study Working Paper
[3]. Wang J et al. 2021 Research on the role of influencing factors on hotel customer satisfaction based on BP neural network and text mining Information 12(3): p 99
[4]. Wong E Rasoolimanesh S M Pahlevan Sharif S 2020 Using online travel agent platforms to determine factors influencing hotel guest satisfaction Journal of Hospitality and Tourism Technology 11(3) pp 425-445
[5]. Song Y et al. 2022 Does hotel customer satisfaction change during the COVID-19? A perspective from online reviews Journal of Hospitality and Tourism Management 51: pp 132-138
[6]. Ali B. J., et al. 2021 Hotel service quality: The impact of service quality on customer satisfaction in hospitality. 5(3): pp 14-28
[7]. Kim, Y. J., & Kim, H. S. (2022). The impact of hotel customer experience on customer satisfaction through online reviews. Sustainability, 14(2), 848.
[8]. Saini Anshul 2023 Decision Tree Algorithm – a Complete Guide Analytics Vidhya 29: 2021
[9]. The dataset https://www.kaggle.com/datasets/michelhatab/hotel-reviews-bookingcom
[10]. Li J et al. 2017 Feature selection: A data perspective ACM computing surveys (CSUR) 50(6): pp 1-45
Cite this article
Qian,Y. (2024). Feature analysis and evaluation of hotel customer satisfaction based on decision tree. Applied and Computational Engineering,38,251-258.
Data availability
The datasets used and/or analyzed during the current study will be available from the authors upon reasonable request.
Disclaimer/Publisher's Note
The statements, opinions and data contained in all publications are solely those of the individual author(s) and contributor(s) and not of EWA Publishing and/or the editor(s). EWA Publishing and/or the editor(s) disclaim responsibility for any injury to people or property resulting from any ideas, methods, instructions or products referred to in the content.
About volume
Volume title: Proceedings of the 2023 International Conference on Machine Learning and Automation
© 2024 by the author(s). Licensee EWA Publishing, Oxford, UK. This article is an open access article distributed under the terms and
conditions of the Creative Commons Attribution (CC BY) license. Authors who
publish this series agree to the following terms:
1. Authors retain copyright and grant the series right of first publication with the work simultaneously licensed under a Creative Commons
Attribution License that allows others to share the work with an acknowledgment of the work's authorship and initial publication in this
series.
2. Authors are able to enter into separate, additional contractual arrangements for the non-exclusive distribution of the series's published
version of the work (e.g., post it to an institutional repository or publish it in a book), with an acknowledgment of its initial
publication in this series.
3. Authors are permitted and encouraged to post their work online (e.g., in institutional repositories or on their website) prior to and
during the submission process, as it can lead to productive exchanges, as well as earlier and greater citation of published work (See
Open access policy for details).
References
[1]. Ahmad Tauseef Mukhtiar B Jin H 2019 Coronavirus disease 2019 (COVID-19) pandemic and economic impact Pakistan journal of medical sciences 36: p 73
[2]. Power J D 2012 North America airline satisfaction study Working Paper
[3]. Wang J et al. 2021 Research on the role of influencing factors on hotel customer satisfaction based on BP neural network and text mining Information 12(3): p 99
[4]. Wong E Rasoolimanesh S M Pahlevan Sharif S 2020 Using online travel agent platforms to determine factors influencing hotel guest satisfaction Journal of Hospitality and Tourism Technology 11(3) pp 425-445
[5]. Song Y et al. 2022 Does hotel customer satisfaction change during the COVID-19? A perspective from online reviews Journal of Hospitality and Tourism Management 51: pp 132-138
[6]. Ali B. J., et al. 2021 Hotel service quality: The impact of service quality on customer satisfaction in hospitality. 5(3): pp 14-28
[7]. Kim, Y. J., & Kim, H. S. (2022). The impact of hotel customer experience on customer satisfaction through online reviews. Sustainability, 14(2), 848.
[8]. Saini Anshul 2023 Decision Tree Algorithm – a Complete Guide Analytics Vidhya 29: 2021
[9]. The dataset https://www.kaggle.com/datasets/michelhatab/hotel-reviews-bookingcom
[10]. Li J et al. 2017 Feature selection: A data perspective ACM computing surveys (CSUR) 50(6): pp 1-45