


1. Introduction
1.1. Problem background
After the discovery of the nest of Vespa mandarinia, referred to as the Asian giant hornet, in September 2019 in British Columbia, Canada, the public attention to this pest has increased rapidly [1]. The special habits of the Asian giant hornet make this species an undeniable enemy of agriculture. The State of Washington has organized a series of activities to monitor the track of these hornets. A very important part of this is to collect and analyze the so-called wasp sightings reported by the general public. Among these eyewitness reports, some are confirmed to be true and effective, but more are false eyewitnesses.
If not handled properly, it will not only increase people's panic but also cause great harm to the economic field represented by agriculture. The Agriculture Apartment of the State is looking forward to finding a series of systematic solutions to explain the information presented in public reports and the approach for prioritizing these reports, considering the constraints on government agency resources.
1.2. Literature review and motivation
With the swift progress of fields such as deep learning, people have gained clearer and deeper digital pre-processing capabilities for integrated pest control in recent years. The introduction of alien plant pests to new regions is occurring at unprecedented rates due to global trade, transportation, tourism, and travel activities, posing threats to both biodiversity and agriculture. Increasingly, analysts are employing new methods like pathway models to assess the movement and introduction of these pests, thereby furnishing risk managers with quantitative estimates of the risks associated with their introduction and the efficacy of potential management strategies [2].
In similar studies, people have already studied the geographical route of bee swarm movement, which predicts the propagation path of this pest over time and provides the accuracy of the predicted time and spatial range. In practical application scenarios, relevant methods have been widely applied. Li X J et al. used a trajectory simulation approach to model the rate of expansion and future migratory range combined with flight behavior and meteorological data, to evaluate the invasion risk in eastern China [3]. Van Dyke Parunak H et al. have also found some approaches promising to instantiate a large population of simple computer agents that explore possible paths through the landscape for geospatial reasoning. The aggregate behavior of this swarm of agents estimates the possible real-world behavior [4].
Although the studies above provide valuable information, existing studies generally lack a classification process for eyewitness reports, which distinguishes a considerable portion of the public's misjudgments in eyewitness reports. There have been multiple developments in the classification of insect sighting reports. In an international collaborative project, Kusrini K et al. proposed a machine learning method for analyzing large-scale mango fields and identification of the onset of biological threats using computer vision and deep-learning technologies to address the need for an early-stage automated or semi-automated pest identification system [5]. At the same time, Rustia D J A et al. from Taiwan proposed an automatic method for the multi-class recognition of small-size greenhouse insect pests on sticky study trap images acquired by wireless imaging devices [6]. However, these studies generally lack scalability and are not as accurate as expected. This deficiency may result in incorrect resource allocation and the development of prevention and control strategies, thereby affecting the effectiveness of pest management. Therefore, this study aims to conduct in-depth research from the perspective of eyewitness report classification and fill the gaps in related fields.
The significance of this research is not only to fill the gaps in existing research but also to provide practical and feasible prevention and control strategies for addressing the threat of Asian giant bees, making positive contributions to protecting ecological balance and agricultural economy. Through in-depth research and analysis, the study expects to provide decision-makers with more comprehensive and accurate information to better respond to the increasingly severe threat of pests. This study obtained relevant datasets from official sources and conducted specific data analysis and model construction.
2. Method
2.1. Dataset introduction and preliminary cleaning
The real-world materials from the Washington State Department of Agriculture are used in this research. The first part is a spreadsheet with 4440 reports of sightings with variables including GlobalID, Notes, Lab Status, Lab Comments, Latitude, and Longitude. The ‘Notes’ variable contains comments provided by the individual submitting the report. In contrast, the ‘Lab Status’ variable represents the official classification assigned to the sighting by the State Department of Agriculture following their analysis. Additionally, the ‘Lab Comments’ variable captures annotations made by the state entomology lab after their analysis. The main time span of the sightings is from January 2019 to December 2020. In the second part, there is a file containing 3305 images that were provided alongside the sighting reports. The third part contains a spreadsheet that links the images to the sightings, featuring the fields including FileName, GlobalID, and FileType. The direct provider of this dataset is the Consortium for Mathematics and Its Applications and these materials have been used as the topic content in the 2021 Mathematical Contest In Modeling and Interdisciplinary Contest In Modeling as well [7]. The author has obtained authorization to use them in this study.
To simplify the model, this study decides to focus on the data that can be used in the context of a given task. As the ‘unprocessed’ data have little effect, this study will only take the dichotomy of ‘positive’, ‘negative’, and ‘unverified’ into consideration temporarily. The elimination only results in a reduction of the data by less than 0.338%, which is acceptable. It’s also been found that there are some missing parts in the datasets, which mainly consist of Lab Comments of some sightings, making these data unusable. Considering the small amount of the missing data, the missing parts are excluded.
2.2. Image and text processing
The Word Cloud is used to complete the Image processing part, which is a data visualization tool that is widely used for text data analysis and visualization. It visually presents key features of the text data by placing words in a text in order of their frequency or importance. The text data is processed by word segmentation and the text is divided into a single word and how often each word appears in the text is calculated. When generating a word cloud map, words that appear more frequently take up more space in the graph to highlight their importance.
For text processing, it’s found that the word ‘sure’ occupies a large space in the word cloud picture. However, after scanning many samples, the study finds that most ‘sure’ appears in the phrase ‘not sure’, ‘Not sure’, ‘don’t sure’ and so on. Therefore, the study changes those phrases into ‘unsure’ before making a word cloud picture. Other words following the negation term exhibit distinct meanings; however, their influence on the analysis appears minimal, leading this research to exclude them from consideration.
In the ‘Lab Comments’ section of the data sheet, it is noted that many samples are classified as ‘unverified’ due to the absence of pictures, while others are classified as ‘negative’ because they provide pictures that can prove their misclassification. It can be seen that the importance of pictures submitted by witnesses in this classification problem. The following discussion of the three categories of ‘positive’, ‘negative’, and ‘unverified’ is based on pictures.
• Positive: The image clearly conformed to the characteristics of the Asian giant Hornet.
• Negative: The image that belongs to other species of bees, such as the golden digger wasp.
• Unverified: The image that is not clear and cannot be judged.
For image processing, this study chooses to use Pytorch, the deep learning framework of Python to build and train the neural network. In the specific processing, this study uses a one-hot coding method, that is, ‘negative’ corresponds to the number 0, ‘positive’ corresponds to the number 1, and ‘unverified’ corresponds to the number 2.
Data Augmentation is a commonly used technique in machine learning and deep learning, aimed at increasing the diversity of the dataset by transforming and expanding training data. This helps to improve the generalization performance of the model, alleviate overfitting problems, and enhance the model’s resilience. In image classification, by transforming images, the model can have better robustness to changes such as rotation and scaling. In object detection, transformations can help models better identify targets of different sizes and angles. In text generation, transforming sentences can increase the model's ability to generate diverse sentences [8].
In the data set, the sample size of ‘positive’ is relatively small, with only 10 images. Therefore, by using the Data Augmentation methods in Pytorch, including flipping, color modification and so on, the sample size of ‘positive’ is expanded to 40. In the same way, this study expanded the number of ‘unverified’ images from 54 to 108. The reason for not expanding to the same scale as the ‘negative’ sample size (1929) is that the Data Augmentation method retains a large amount of information about the original image and has high similarity with the original image.
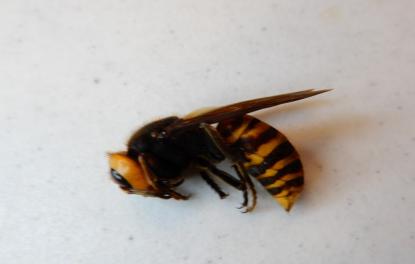
Figure 1. Original figure of the bee before data augmentation.
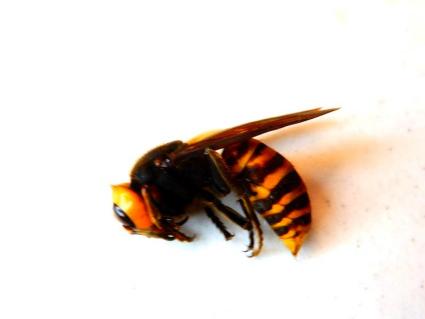
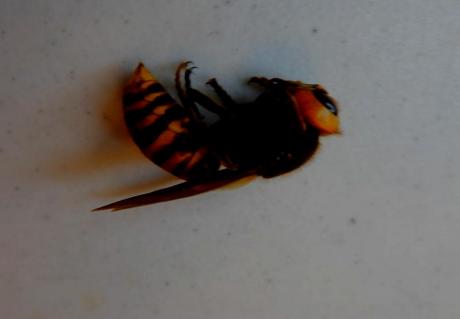
For example, Figure 1 above is augmented with Figure 2 as shown below.
|
| |
(a) | (b) | |
Figure 2. Figures of the bee after data augmentation. | ||
The popular deep convolutional neural network structure, ResNet, aims at solving the problems of gradient vanishing and gradient explosion in deep network training. It introduces residual blocks, allowing the network to maintain stable gradient flow at deeper levels. The core idea is to learn residuals by skipping connections (i.e. residual connections), enabling the network to learn new representations without losing previous information. Based on the above considerations, identity functions are added to the fitted functions. Assuming that within a certain layer, the optimal function is denoted as \( H(x) \) , then the objective function \( F(x) \) which are being fitted is defined as \( F(x) :=H(x)-x \) , and the function \( F(x) \) is called the ‘residual function’ [9]. The function needed consists of two parts: the identity function and the residual function.
The basic architecture of ResNet is composed of residual blocks as shown in Figure 3.
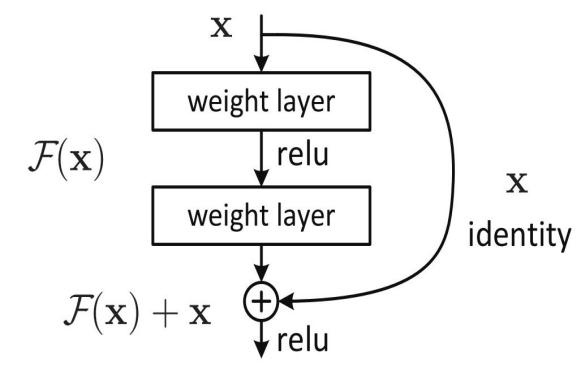
Figure 3. Intuitive principle of the ResNet model.
Transfer Learning aims at improving the performance of a model by applying knowledge learned from one task to another related task. The core idea is that the previously learned features may have a certain shared value between different tasks, and performance can be improved through migration [10]. Transfer learning can be achieved through some main methods including Feature extraction transfer and Model fine-tuning transfer [11]. For example, in the field of images, zero sample learning, which people pay more attention to, can be formalized as the following equation:
\( {f^{*}}, {g^{*}} = arg \underset{f,g}{min}{\sum _{n}max(0, k-f({x^{n}}) · g({y^{n}})+\underset{m≠n}{max}{f({x^{n}}) · g({y^{m}})})} \) (1)
As the sample size is relatively small, this study uses the Transfer Learning method to download the pre-trained ResNet18 model in Pytorch and changes the number of output features of the last linear layer to 3. The position corresponding to the largest of the three final output values represents the classification result. The dataset is randomly divided into a 70% training set and a 30% test set. Based on the pre-trained model, this study undergoes 10 iterations using the training set and finally achieves 99% accuracy in the test set.
This study abbreviates ‘Positive’, ‘Negative’, and ‘Unverified’ to P, N, and U and records the true value before the predicted value. For example, ‘PN’ represents all samples that are ‘positive’ but predicted to be ‘negative’. By analogy, the remaining variables are defined in a standard format, as well as the accuracy A, the precision rate P, and F1, the harmonic mean of A and P [12]. The value of F1 reflects the comprehensive performance of the model.
2.3. Geographic location processing
If the geographic location information in the dataset is visualized on the map by classification, the image results can be easily obtained and shown in Figure 4 and Figure 5.
|
| |
Figure 4. Panorama of the sighting reports. | Figure 5. Partial enlarged drawing of the sighting reports. |
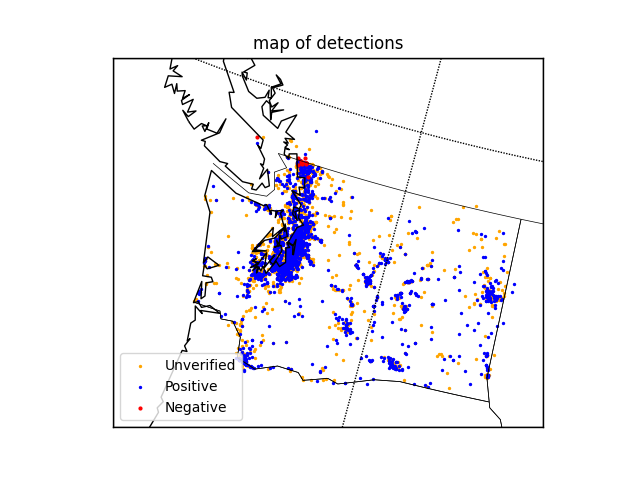
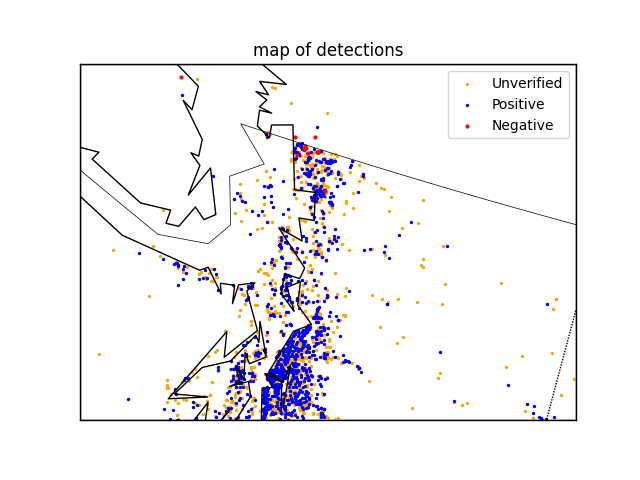
It can be seen from the figure and data that the average distance between ‘negative’ and ‘unverified’ samples is relatively short (only 16.726km), and the distribution is also extremely similar, therefore, it is difficult to distinguish them from the geographical location information, while the average distance between them and ‘positive’ samples is 175.492km and 159.490km, respectively. Therefore, distinction between ‘positive’ and not ‘positive’ (‘negative’ or ‘unverified’) can be made by constructing a special function.
Hence, the Sigmoid Function is considered, \( S(x)={(1+{e^{-x}})^{-1}} \) , which maps all real numbers into the interval (0,1), and increases monotonically with respect to x. The function value 0.5 can be used as the dividing line to complete the classification [13].
After calculating the distance d, \( {d^{-1}} \) is chosen as the parameter input function (if d = 0, it is directly judged to be ‘positive’) for two reasons: First, this operation changes the monotonic relationship between the predicted value and d, in line with the rule that the farther the distance is, the smaller the ‘positive’ probability is; Second, mapping (0,+∞) to (0,1) is convenient for subsequent construction.
The function \( f(x)=2{(1+{e^{-ax}})^{-1}}-1 \) (a > 0) is taken into consideration, which maps (0,1) to (0,1) itself. The distance between the ‘positive’ sample is observed and its average value is mostly within 15km which means it’s necessary to find out one specific function which lets \( f({x_{0}})=0.5 \) when \( {x_{0}}={15^{-1}} \) .
The next part is constructing an auxiliary function \( g(x) \) :
\( g(x)=\begin{cases} \begin{array}{c} 1, x≥0.5 \\ 0, x \lt 0.5 \end{array} \end{cases} \) (2)
In the later analysis, \( g(f({d^{-1}}))=1 \) indicates that the forecast is ‘positive’, and 0 indicates that the forecast is ‘negative’ or ‘unverified’.
3. Result
After completing the text processing operations, this study gets the word cloud as Figures 6, 7, and 8.
|
| |
Figure 6. Word cloud of the sighting reports with the tag ‘positive’. | Figure 7. Word cloud of the sighting reports with the tag ‘negative’. |
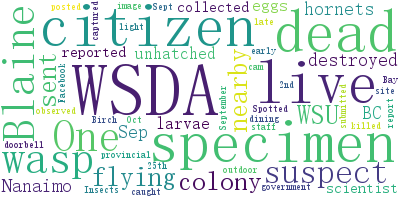
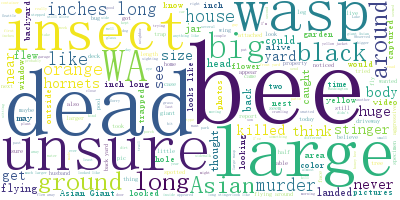
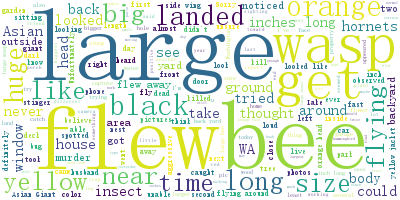
Figure 8. Word cloud of the sighting reports with the tag ‘unverified’.
It can be seen that there are ‘dead’, ‘live’, ‘flying’, and other words to describe the state of bees, ‘hornet’, ‘bee’, ‘insect’, ‘wasp’, and other words to describe the creatures seen, ‘big’, ‘large’, ‘long’, ‘inches’, and other words to describe the size, ‘unsure’, ‘suspect’, and other words to express uncertainty. The difference is not obvious.
The obvious characteristics ‘large’ and ‘long’ appear in ‘negative’ and ‘unverified’ samples many times, which cannot be used as the basis for judgment. Therefore, ‘notes’ is not considered to be used as a basis for judging ‘positive’ or ‘negative’ since most witnesses cannot describe it accurately. In the absence of images, most of them are judged as ‘unverified’.
This study primarily focuses on the misclassification of sighting, specifically those classified as ‘negative’. Consequently, these ‘negative’ instances in the status category are treated as ‘positive’ in the context of the confusion matrix. The result of the data is presented in Figure 9.
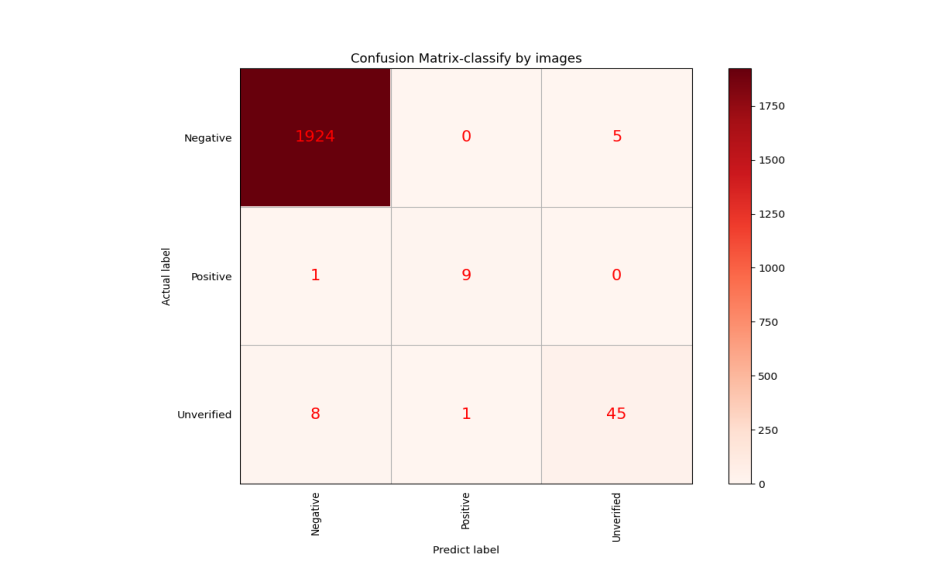
Figure 9. Confusion matrix of the image model.
The comparison data is shown in Table 1 that the comprehensive performance of the model after image information processing is better.
Table 1. Comparison of the two models.
Index Model | Accuracy | Precision | Recall | F1 |
Image | 0.992 | 0.995 | 0.997 | 0.996 |
Model | 0.968 | 0.968 | 1.000 | 0.984 |
The equation in the part of geographic is solved and shows that  . Finally, the concrete expression of the function is shown below:
\( f(x)=2{(1+{e^{-16.749x}})^{-1}}-1 \) (3)
Simultaneously, within the 2342 ‘unverified’ samples, only 54 contain the image data. This observation suggests that among samples categorized as ‘not positive’, there is a notable likelihood of classifying those lacking image information as ‘unverified’. Out of the 2428 samples devoid of image information, 140 were categorized as ‘negative’, while the remaining 2288 were designated as ‘unverified’. Hence, within the samples that are categorized as ‘not positive’ and do not possess image information, there is a probability of 0.058 for them to be classified as ‘negative’, and a probability of 0.942 for them to be classified as ‘unverified’.
The trained neural network can accurately get the ‘positive’, ‘negative’, or ‘unverified’ classification according to the image information to a great extent, therefore the samples containing images through the images can be directly predicted. The samples without images are classified according to the longitude and latitude. The confusion matrix of the model is shown in Figure 10.
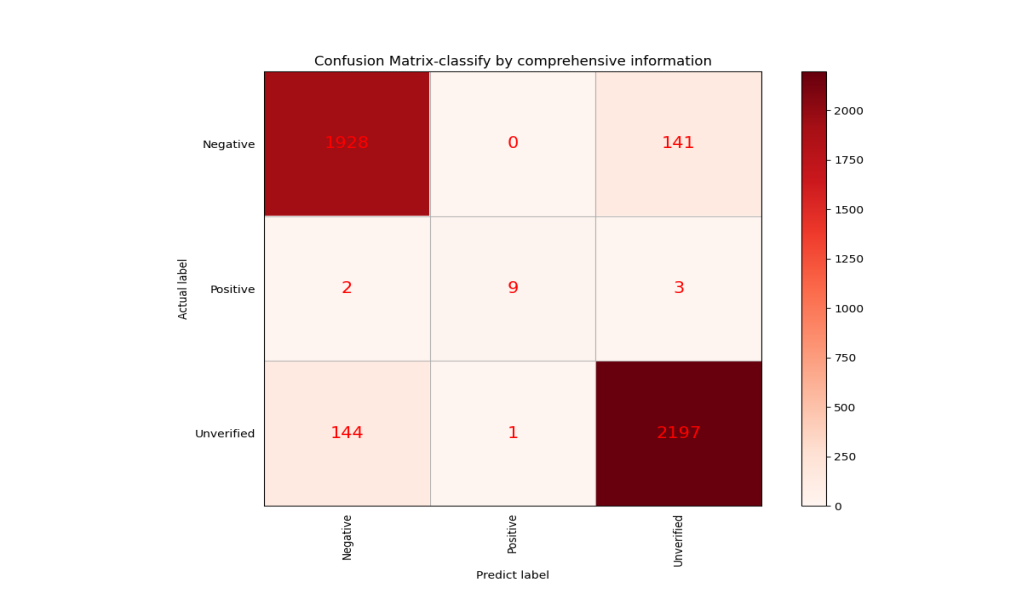
Figure 10. Confusion matrix of the comprehensive model.
The data of the final comprehensive model are shown in Table 2 and the model fits well.
Table 2. Data of the comprehensive model.
Accuracy | Precision | Recall | F1 Measure | |
Rate | 0.934 | 0.930 | 0.932 | 0.931 |
4. Conclusion
The recent discovery of the nest of Vespa mandarinia in British Columbia, Canada, caught the public's attention and the Agriculture Apartment of the State is looking forward to finding out a series of systematic solutions to explain the information presented in public reports and what strategies should be used to give priority to these public reports and conduct extra investigations as the resources of government apartments are limited. This study presents a comprehensive prediction and classification model for hornet sighting reports. This study constructs the model from three aspects, text, image, and position. The form of word cloud is used to show the frequency of words in text information. Pytorch is used to enhance the image information and to make up for the disadvantages of some types of images. This research constructs a new function based on the sigmoid function and analyzes the position data.
This research is partly consistent with the work of Yixin Liu et al. The analysis of the text data section yielded the same results [14]. The accuracy difference of the predictive classification model for image information on similar test sets is less than 0.02 as well. However, their research provides fitting results that differ significantly from those of this study in terms of geographical location processing. C Y Li et al. shows a quite different form of the geographical fitting as well [15]. The reason for this difference is that different studies have adopted different forms of pre-set fitting functions. For example, C Y Li et al. choose GM-Logistic and CSRF Models to process the geographic data, instead of the Sigmoid function used in this research. For nonlinear multi-modal data matrices, different fitting forms have their own advantages and disadvantages, and adjustments need to be made based on future data.
This study has several strengths, including accuracy and comprehensiveness. Firstly, the use of emerging deep learning models such as ResNet has led to a qualitative improvement in the model’s prediction accuracy compared to traditional unsupervised learning. The accuracy of the image prediction model is higher than 0.99 and the accuracy of the comprehensive model is also higher than 0.90. Secondly, comprehensive evaluation and analysis of eyewitness reports from multiple aspects including text, images, and geographical location can maximize the utilization of real data and provide more accurate prediction and classification. The introduction of data augmentation technology eliminates deviation phenomena such as overfitting caused by insufficient data in traditional application scenarios as well.
However, this study also has some weaknesses. Firstly, it relies too much on data and ignores the in-depth study on the bees’ habits. The biological characteristics of the hornets are not well considered. Secondly, the positive samples are too few and the generalization ability of the model may not be strong. Thirdly, there is still plenty of room for in-depth analysis of the text section. When there is more text, simple word frequency statistics and word cloud graph display will no longer be convenient and intuitive.
For future expectations, several methods can be used to update and improve the model. Firstly, the frequency of model updates would be once every 200 reports (about 10% of the original data set) with pictures. The final updated model could be built by combining the updated neural network model with the new function classified by geographical location according to the original method. Secondly, the Q-learning Decision Transformer method can be considered for use in text information processing, using offline reinforcement learning methods to improve the analysis accuracy of this part [16]. The improvement of this study would contribute to supporting effective pest management, particularly in response to the threat of the Asian giant hornet. The obtained comprehensive model can accurately classify future collected eyewitness reports to guide relevant departments in their prevention and control strategies and reduce ineffective expenses for false witness reports.
References
[1]. ScienceNews. More ‘murder hornets’ are turning up. Here’s what you need to know. MAY 29, 2020 [cited 2021 Feb 23]; Available from: https://www.sciencenews.org/article/asian-giant-murder-hornet-sightings-washington-canada.
[2]. Douma, J., et al., Pathway models for analysing and managing the introduction of alien plant pests - an overview and categorization. Ecological Modelling, 2016. 339: p. 58-67.
[3]. Li, X.-J., et al., Prediction of migratory routes of the invasive fall armyworm in eastern China using a trajectory analytical approach. 2019.
[4]. Parunak, V., et al., Swarming methods for geospatial reasoning. International Journal of Geographical Information Science, 2006. 20: p. 945-964.
[5]. Kusrini, K., et al., Data augmentation for automated pest classification in Mango farms. Computers and Electronics in Agriculture, 2020. 179: p. 1.
[6]. Rustia, D.J., et al., Automatic greenhouse insect pest detection and recognition based on a cascaded deep learning classification method. Journal of Applied Entomology, 2020: p. 1-17.
[7]. Agriculture, W.S.D.o. 2020 Asian Giant Hornet Public Dashboard. 2020 [cited 2020 11/5]; Available from: https://agr.wa.gov/departments/insects-pests-and-weeds/insects/hornets/data.
[8]. Shorten, C. and T. Khoshgoftaar, A survey on Image Data Augmentation for Deep Learning. Journal of Big Data, 2019. 6.
[9]. He, K., et al., Deep Residual Learning for Image Recognition. 2016. 770-778.
[10]. Pan, S. and Q. Yang, A Survey on Transfer Learning. Knowledge and Data Engineering, IEEE Transactions on, 2010. 22: p. 1345-1359.
[11]. Yosinski, J., et al., How transferable are features in deep neural networks? Advances in Neural Information Processing Systems (NIPS), 2014. 27.
[12]. Powers, D., Evaluation: From Precision, Recall and F-Factor to ROC, Informedness, Markedness & Correlation. Mach. Learn. Technol., 2008. 2.
[13]. Hinton, G. and T. Sejnowski, Learning and relearning in Boltzmann machines. Parallel Distributed Processing, 1986. 1.
[14]. Liu, Y., et al. Priority prediction of Asian Hornet sighting report using machine learning methods. in 2021 IEEE International Conference on Software Engineering and Artificial Intelligence (SEAI). 2021.
[15]. Li, C., et al. Spread Prediction and Classification of Asian Giant Hornets Based on GM-Logistic and CSRF Models. Mathematics, 2023. 11, DOI: 10.3390/math11061332.
[16]. Yamagata, T., A. Khalil, and R. Santos-Rodriguez, Q-learning Decision Transformer: Leveraging Dynamic Programming for Conditional Sequence Modelling in Offline RL. 2022.
Cite this article
You,H. (2024). Prediction and classification model of hornet sighting report in Washington state based on deep learning. Applied and Computational Engineering,48,87-95.
Data availability
The datasets used and/or analyzed during the current study will be available from the authors upon reasonable request.
Disclaimer/Publisher's Note
The statements, opinions and data contained in all publications are solely those of the individual author(s) and contributor(s) and not of EWA Publishing and/or the editor(s). EWA Publishing and/or the editor(s) disclaim responsibility for any injury to people or property resulting from any ideas, methods, instructions or products referred to in the content.
About volume
Volume title: Proceedings of the 4th International Conference on Signal Processing and Machine Learning
© 2024 by the author(s). Licensee EWA Publishing, Oxford, UK. This article is an open access article distributed under the terms and
conditions of the Creative Commons Attribution (CC BY) license. Authors who
publish this series agree to the following terms:
1. Authors retain copyright and grant the series right of first publication with the work simultaneously licensed under a Creative Commons
Attribution License that allows others to share the work with an acknowledgment of the work's authorship and initial publication in this
series.
2. Authors are able to enter into separate, additional contractual arrangements for the non-exclusive distribution of the series's published
version of the work (e.g., post it to an institutional repository or publish it in a book), with an acknowledgment of its initial
publication in this series.
3. Authors are permitted and encouraged to post their work online (e.g., in institutional repositories or on their website) prior to and
during the submission process, as it can lead to productive exchanges, as well as earlier and greater citation of published work (See
Open access policy for details).
References
[1]. ScienceNews. More ‘murder hornets’ are turning up. Here’s what you need to know. MAY 29, 2020 [cited 2021 Feb 23]; Available from: https://www.sciencenews.org/article/asian-giant-murder-hornet-sightings-washington-canada.
[2]. Douma, J., et al., Pathway models for analysing and managing the introduction of alien plant pests - an overview and categorization. Ecological Modelling, 2016. 339: p. 58-67.
[3]. Li, X.-J., et al., Prediction of migratory routes of the invasive fall armyworm in eastern China using a trajectory analytical approach. 2019.
[4]. Parunak, V., et al., Swarming methods for geospatial reasoning. International Journal of Geographical Information Science, 2006. 20: p. 945-964.
[5]. Kusrini, K., et al., Data augmentation for automated pest classification in Mango farms. Computers and Electronics in Agriculture, 2020. 179: p. 1.
[6]. Rustia, D.J., et al., Automatic greenhouse insect pest detection and recognition based on a cascaded deep learning classification method. Journal of Applied Entomology, 2020: p. 1-17.
[7]. Agriculture, W.S.D.o. 2020 Asian Giant Hornet Public Dashboard. 2020 [cited 2020 11/5]; Available from: https://agr.wa.gov/departments/insects-pests-and-weeds/insects/hornets/data.
[8]. Shorten, C. and T. Khoshgoftaar, A survey on Image Data Augmentation for Deep Learning. Journal of Big Data, 2019. 6.
[9]. He, K., et al., Deep Residual Learning for Image Recognition. 2016. 770-778.
[10]. Pan, S. and Q. Yang, A Survey on Transfer Learning. Knowledge and Data Engineering, IEEE Transactions on, 2010. 22: p. 1345-1359.
[11]. Yosinski, J., et al., How transferable are features in deep neural networks? Advances in Neural Information Processing Systems (NIPS), 2014. 27.
[12]. Powers, D., Evaluation: From Precision, Recall and F-Factor to ROC, Informedness, Markedness & Correlation. Mach. Learn. Technol., 2008. 2.
[13]. Hinton, G. and T. Sejnowski, Learning and relearning in Boltzmann machines. Parallel Distributed Processing, 1986. 1.
[14]. Liu, Y., et al. Priority prediction of Asian Hornet sighting report using machine learning methods. in 2021 IEEE International Conference on Software Engineering and Artificial Intelligence (SEAI). 2021.
[15]. Li, C., et al. Spread Prediction and Classification of Asian Giant Hornets Based on GM-Logistic and CSRF Models. Mathematics, 2023. 11, DOI: 10.3390/math11061332.
[16]. Yamagata, T., A. Khalil, and R. Santos-Rodriguez, Q-learning Decision Transformer: Leveraging Dynamic Programming for Conditional Sequence Modelling in Offline RL. 2022.